

Briefly: in our opinion, full (300% of the regular position size) speculative short positions in junior mining stocks are justified from the risk/reward point of view at the moment of publishing this Alert.
It’s happening! The massive upswing in the USD Index and the slide in the precious metals market are here.
Just like you knew in advance. I’m receiving multiple messages where you’re sharing your gratitude with me, and I’m extremely happy that you’re enjoying the results that you were able to get thanks to my help.
All right, what’s next?
First of all, I would like you to keep perspective.
The huge slide that we saw on Friday is most likely just a first step lower. A big step, but just the first one, nonetheless.
Here’s how the situation looks from a long-term point of view.
The Big Picture
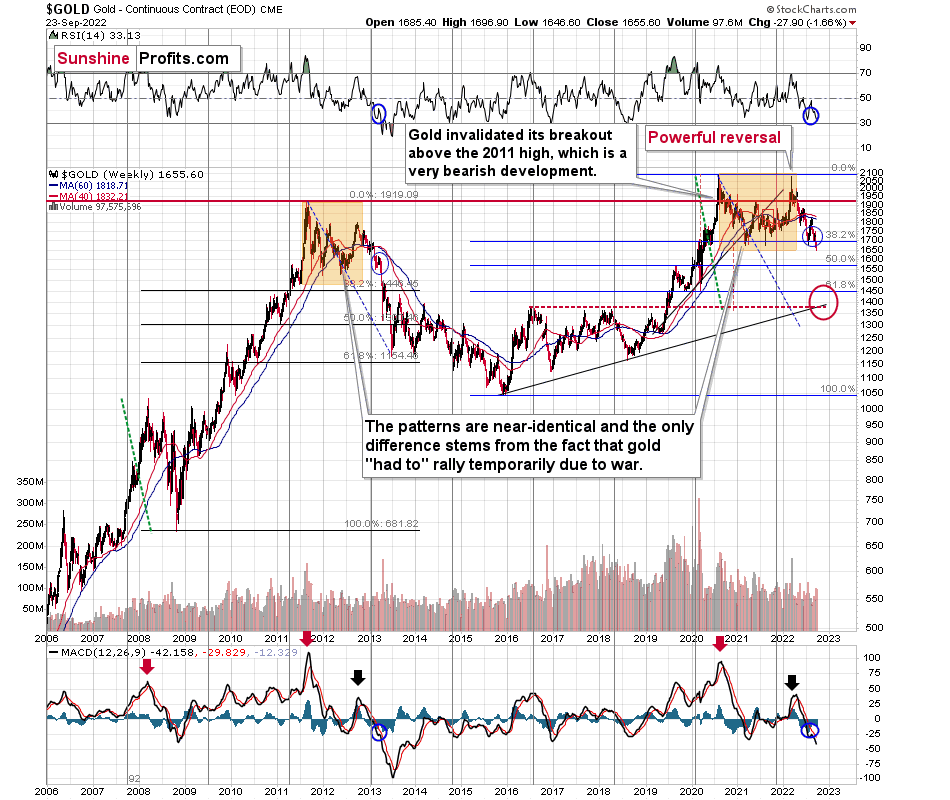
Gold is below its previous lows but not significantly so. Neither the RSI nor MACD indicators suggest that the decline is over – based on the analogy to 2013 that I described more thoroughly on Friday (and in many previous analyses – you knew about this analogy’s existence for months).
Here’s what the situation looks like in the case of the HUI Index – a proxy for gold stocks.
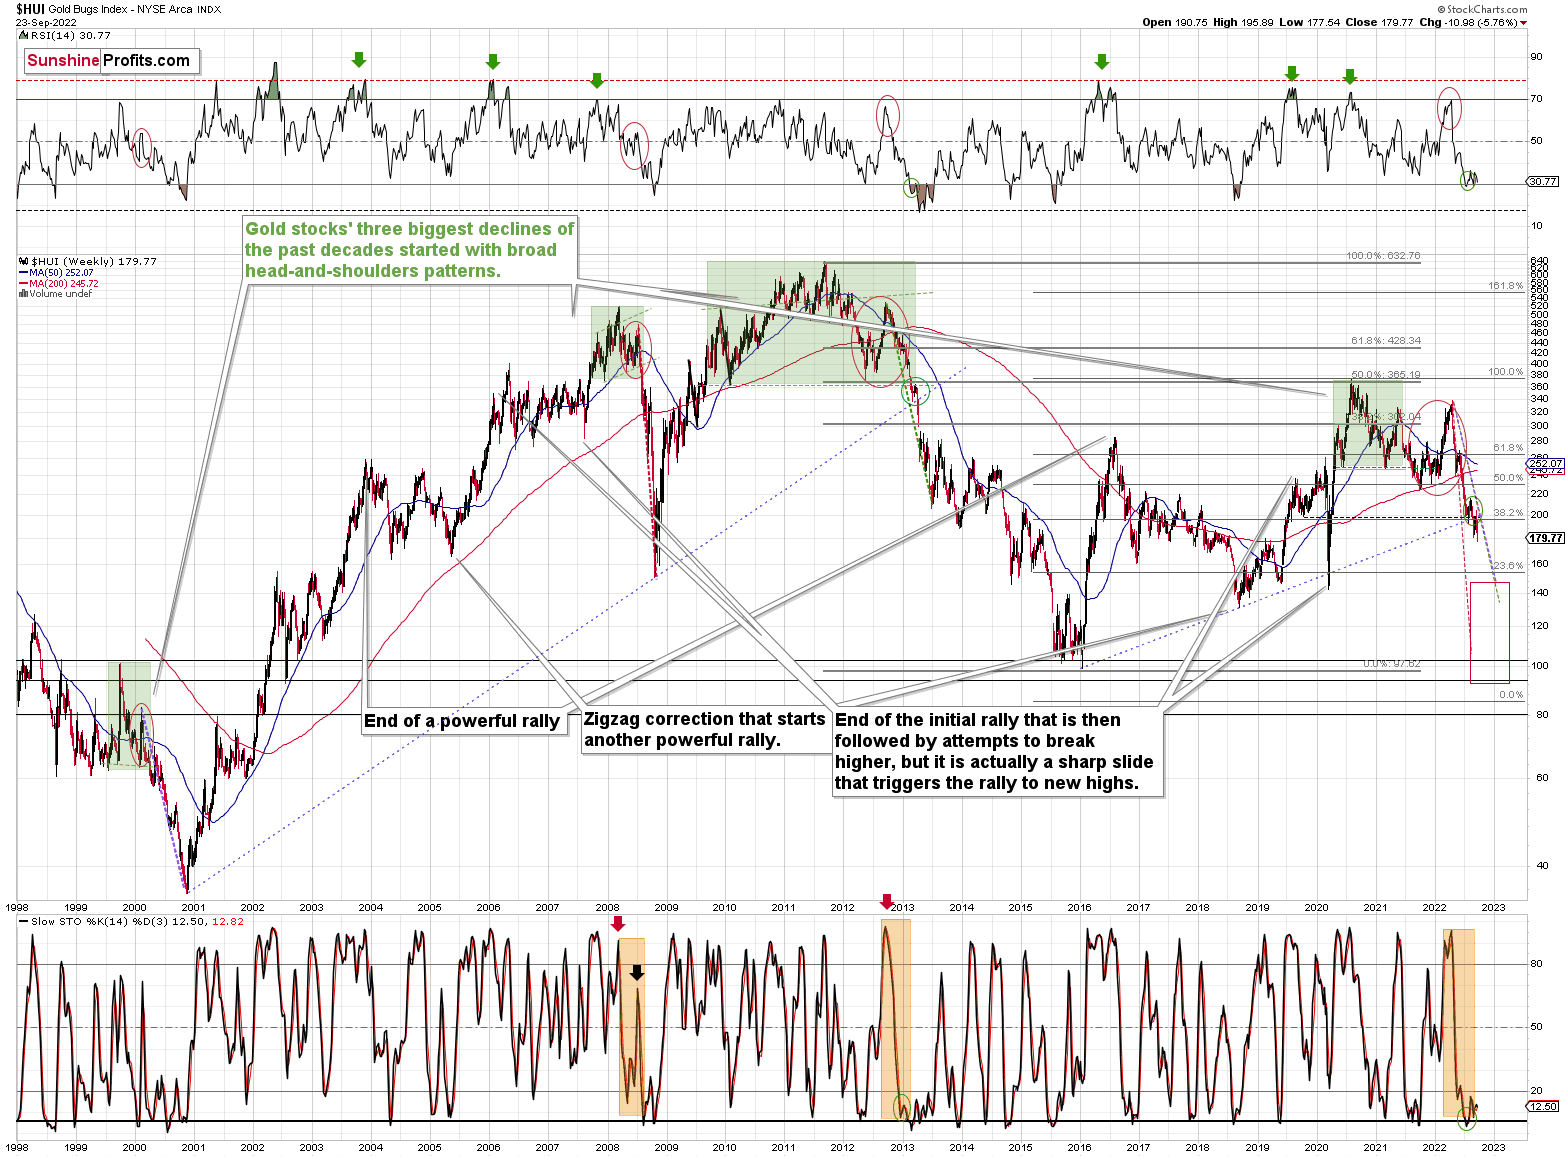
After the breakdown below the long-term support line (based on the 2016 and 2020 bottoms), gold stocks consolidated a bit. This means that the breakdown was verified. This, in turn, opened the door wide open for more significant declines.
Therefore, the fact that miners just declined significantly on Friday – and moved to new yearly lows – is not surprising. It’s a perfectly normal consequence of the breakdown, and something that’s in perfect tune with the analogy to 2013 (and to a smaller extent with the analogy to 2008).
As we zoom in, you can see how big Friday’s daily decline really was.
The Little-Huge Detail
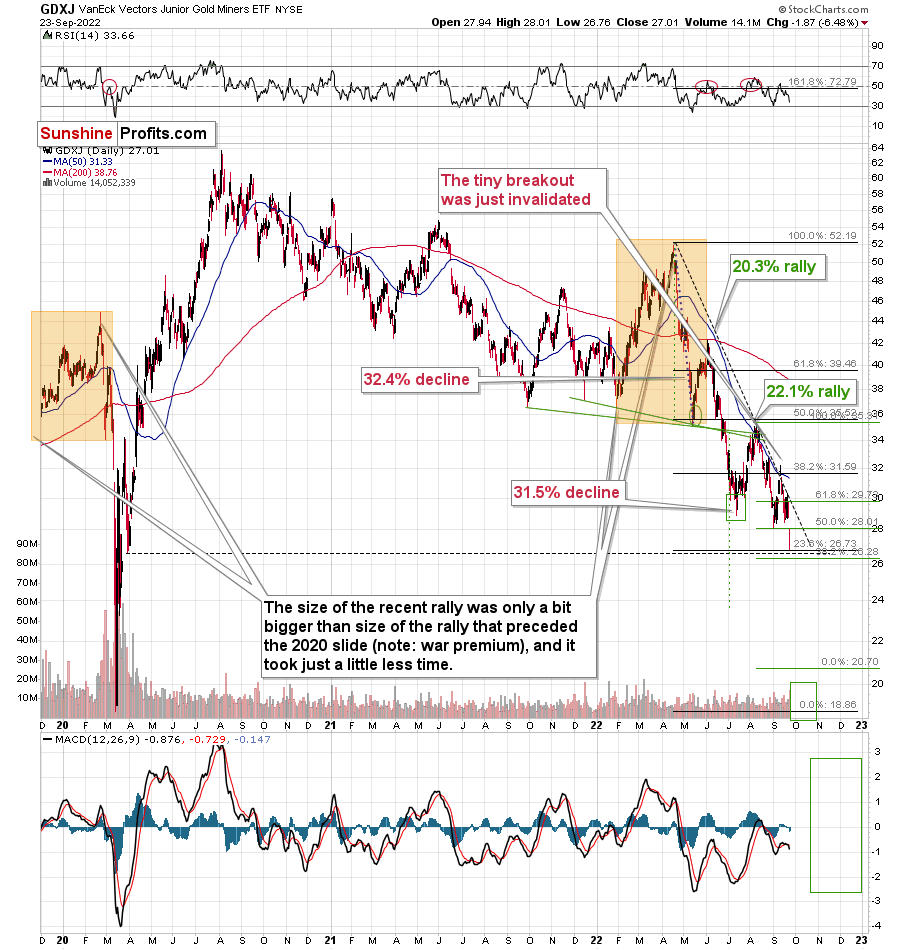
Will we get a temporary correction from the current levels?
We might, or we might not. I previously planned to take profits at – more or less – current price levels, but I dropped this idea based on the fact that we’ve already seen two corrective upswings from below $30 in the GDXJ.
Without those two previous corrections, seeing a correction now would have been very likely. However, they did happen, so now it’s relatively unclear if we’re going to see a corrective bounce or not.
There’s an old Wall St. saying “when in doubt, stay out,” but what most people miss about this saying is that it makes sense as long as one is thinking about a single time-frame. In this case, it is the very short-term outlook that is unclear (next several days or so), and as a consequence, I’m not participating in a very short-term trade.
However, the short-term / medium-term oriented trade – the one that’s based on the likely biggest part of the current decline in the precious metals market is very likely to continue. Consequently, I’m remaining on the short side of the precious metals market, and even if we see a corrective upswing here, I won’t mind that.
Not every correction / price move is worth trading – only those with very favorable risk-to-reward ratios. In this case, the corrective bounce ratio is not that favorable. Our profits this year are already huge, so waiting out a relatively short period before they increase even more (of course, I’m not promising any kind of performance) should be rather easy.
Instead of a small corrective upswing, we might see a sharp drop to $20. Missing huge profits on the latter would be much worse than having to wait out a very short-term correction.
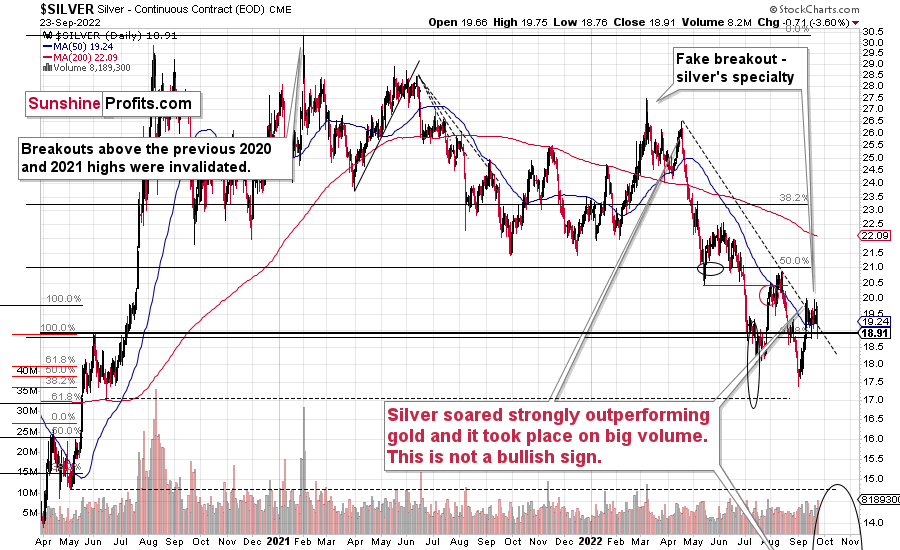
Besides, silver is not catching up with miners yet, so we don’t have this confirmation that the move is close to its end.
The USD Index is soaring, but this – by itself – doesn’t mean that it’s already too high.
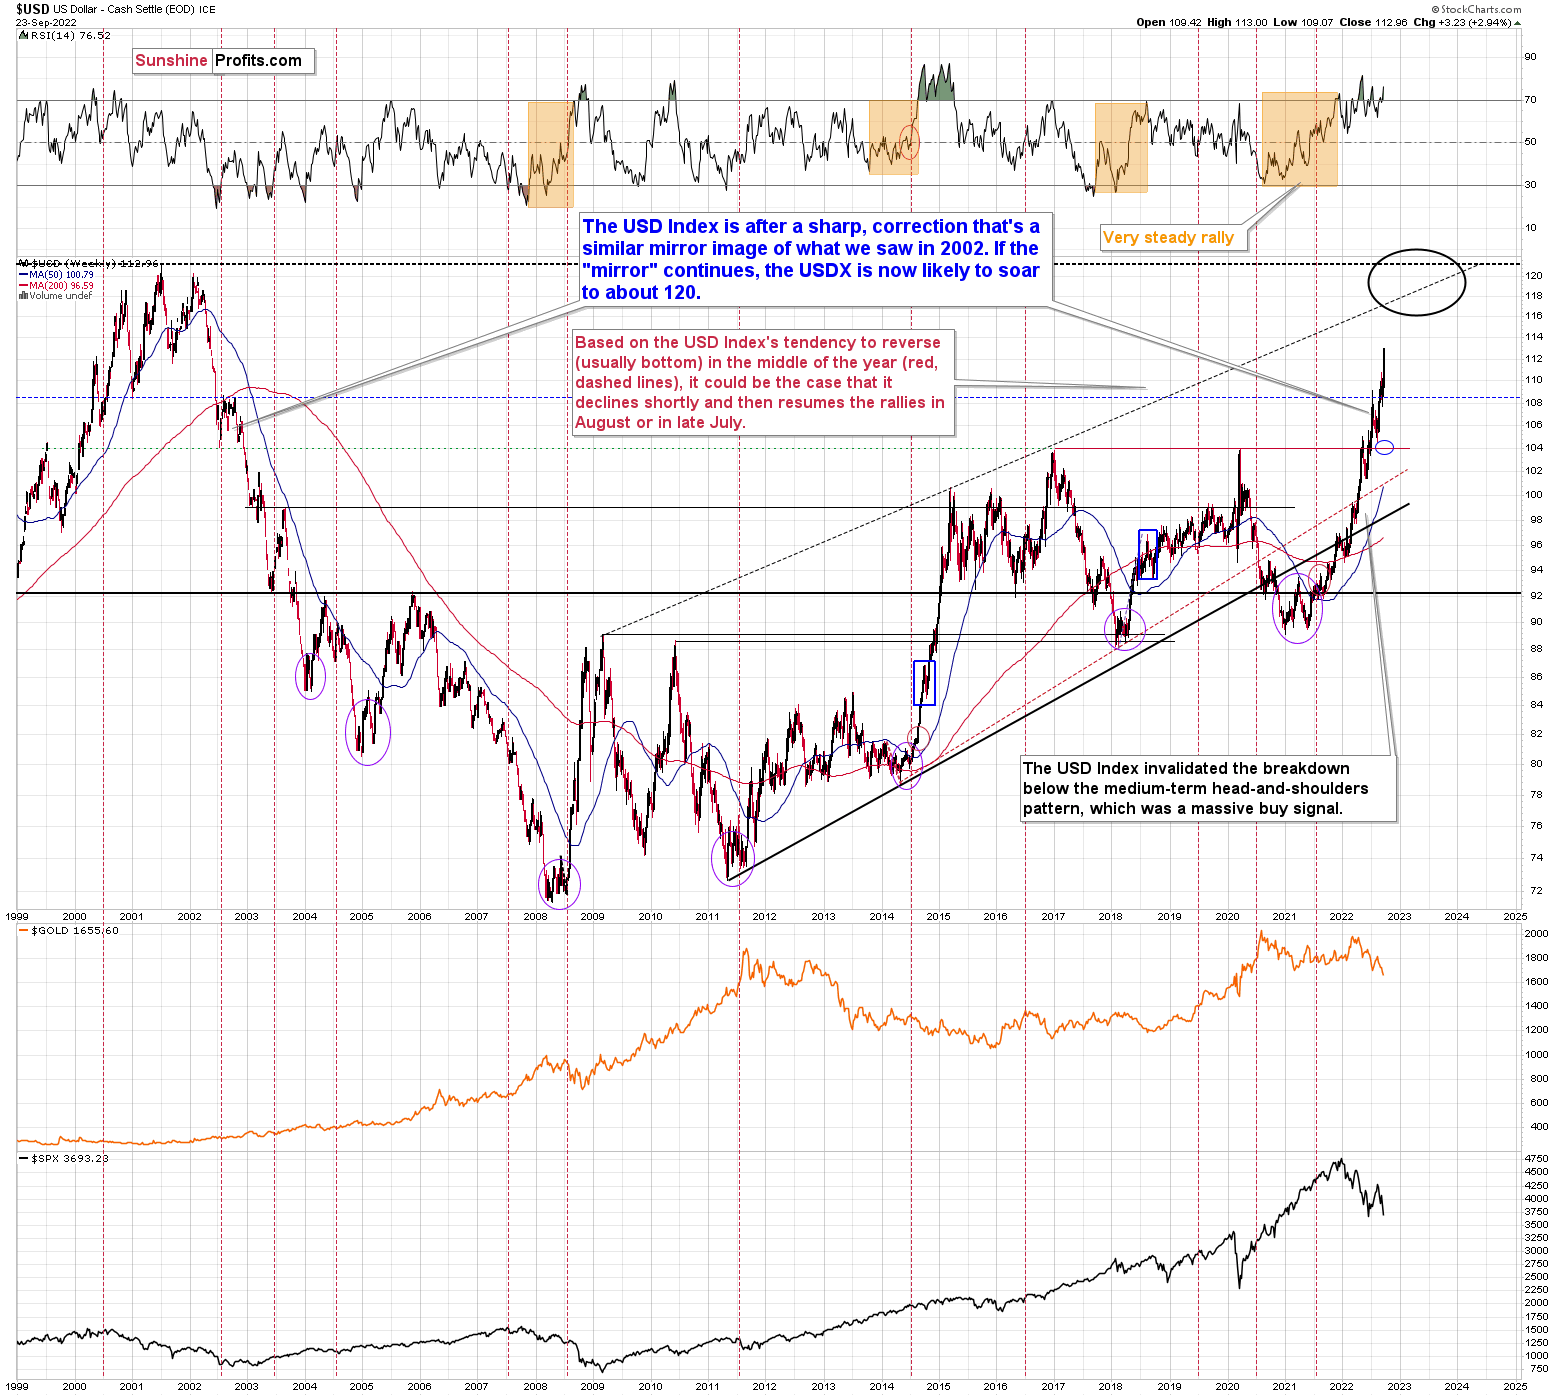
There’s no meaningful technical resistance all the way until 117-20, so the USD Index could continue to climb.
The above doesn’t mean that it has to rally every single day or week, though, so a correction here won’t mean that the medium-term rally is over.
No. The rally is likely to continue. The 120 is the next very strong resistance, but I wouldn’t rule out the situation in which the USD Index actually breaks above this level and then soars to new all-time highs.
Let’s keep in mind that at some point, gold is likely to rally regardless of the USD’s upswing. Ideally, it “should” happen after gold moves briefly below $1,400. Then there would be an extremely big chance that the bottom of gold is in.
For now, it seems that gold needs to decline further.
Having said that, let’s take a look at the markets from a more fundamental angle.
Reality Reigns
With gold, silver, mining stocks and the S&P 500 suffering mightily on Sep. 23, financial assets were crushed as risk-on sentiment continues to evaporate. Moreover, with the medium-term price action unfolding as expected, the GDXJ ETF closed at a new 2022 low, while the USD Index and the U.S. 10-Year real yield hit new 2022 highs. As a result, the technicals and the fundamentals continue to prove prescient.
Furthermore, while I warned repeatedly throughout 2021 that non-transitory inflation would rattle risk assets, the bond market sell-off has reached epic proportions; and with the U.S. 2-Year Treasury yield hitting new 2022 intraday and closing highs on Sep. 23, the benchmark’s vertical ascent highlights the ferocity of the 2021/2022 bond bear market.
Please see below:
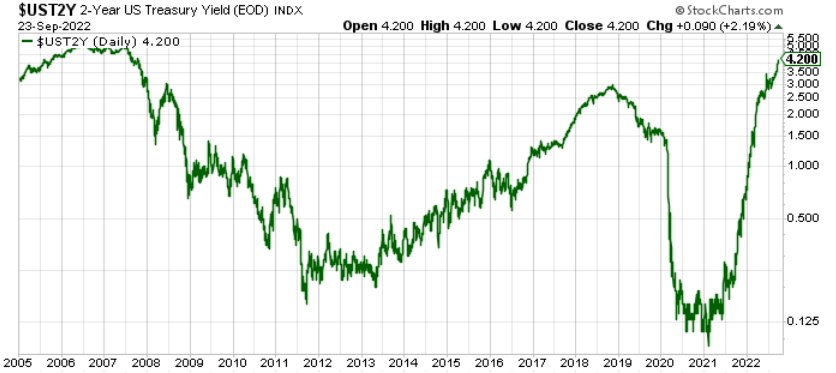
To explain, the green line above tracks the U.S. 2-Year Treasury yield. If you analyze the right side of the chart, you can see that the benchmark hit its highest level since 2007. More importantly, the slope of the surge emphasizes why the move has been so material. Instead of a gradual ascent, the interest rate has gone vertical. Thus, the filter-through should hurt U.S. economic growth in the months ahead, and the ramifications are profoundly bearish for risk assets.
Likewise, while I warned for months that investors were underestimating the resiliency of inflation, the transitory crowd’s lack of foresight has resulted in plenty of financial pain.
Please see below:
 Source: Bank of America
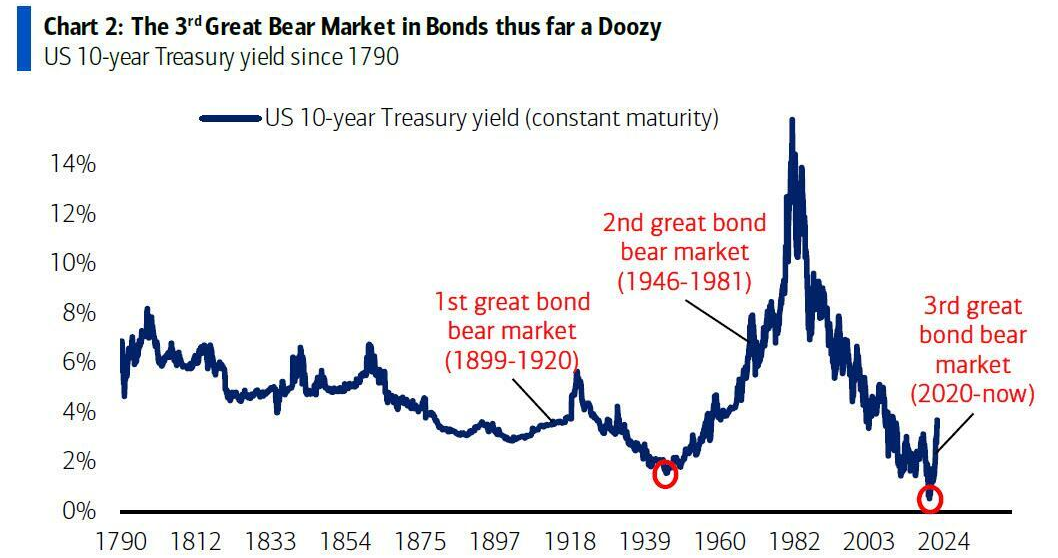
To explain, the blue line above tracks the U.S. 10-Year Treasury yield since 1790. If you analyze the annotations, you can see that the third “great” bond bear market has arrived. As such, gold, silver, mining stocks and the S&P 500 are much less attractive when lower-risk assets like Treasuries offer higher returns.
To that point, the USD Index has been one of the best-performing assets in 2022, while the GDXJ ETF has been one of the worst. Moreover, with the divergence poised to persist as the Fed’s inflation fight continues, the PMs’ medium-term outlooks remain quite ominous.
Please see below:
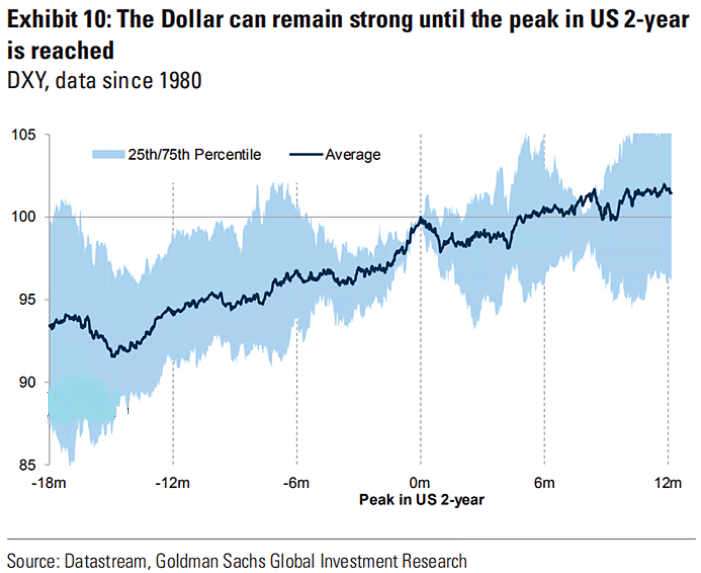
To explain, the dark blue line above tracks the average performance of the USD Index, while the x-axis plots the performance of the U.S. 2-Year Treasury yield. If you analyze the dark blue line's initial peak near the middle of the chart, you can see that the USD Index often tops alongside the U.S. 2-Year Treasury yield. Then, the dollar basket often suffers for roughly four to five months before continuing its uptrend.
However, the important point is that the Fed is far from achieving its inflation goal. Therefore, the USD Index should remain elevated as the U.S. 2-Year Treasury yield continues to rise. Likewise, our U.S. federal funds rate (FFR) expectation is 4.5% to 5.5% in 2023; and with the U.S. 2-Year Treasury yield often front-running the FFR, the 4.20% close on Sep. 23 is still materially below what's needed to curb inflation.
As a result, the wind remains at the USD Index and U.S. nominal and real yields' backs, and the PMs are unlikely to make any lasting progress until these forces subside.
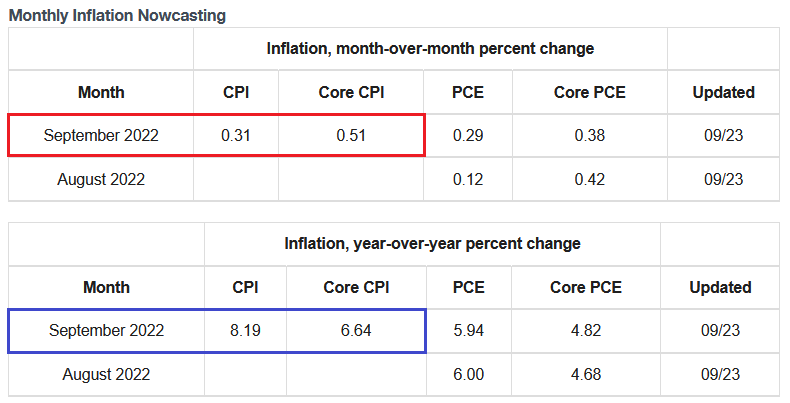
Speaking of which, carnage has unfolded across the financial markets in recent weeks and commodities have suffered mightily. However, the Cleveland Fed still projects the headline and core Consumer Price Indexes (CPI) to increase by 0.31% and 0.51% month-over-month (MoM) in September. Moreover, since a realization equates to readings of 8.19% and 6.64% year-over-year (YoY), the projections highlight why the medium-term outlooks are so bullish for the FFR, the U.S. 2-Year Treasury yield, the USD Index and U.S. real yields.
Please see below:
 Source: Cleveland Fed
All in all, the PMs’ main fundamental adversaries continue to wreak havoc on their performance. Furthermore, I warned on Oct. 26, 2021 that when the liquidity drain intensifies, the GDXJ ETF is often a major underperformer. I wrote:
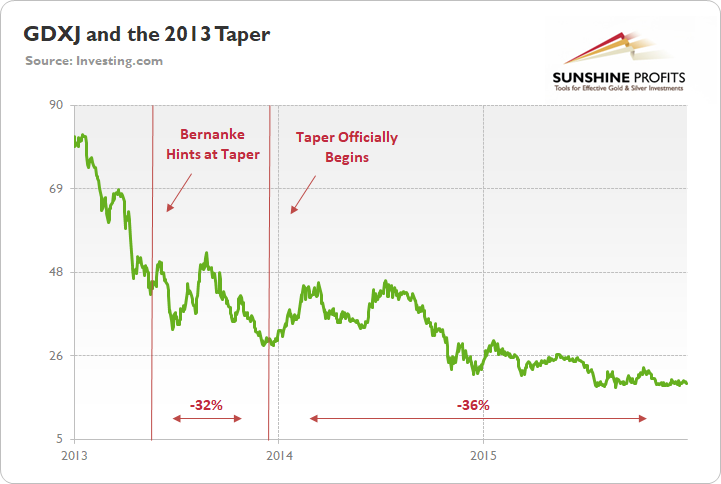
To explain, the green line above tracks the GDXJ ETF from the beginning of 2013 to the end of 2015. If you analyze the left side of the chart, you can see that when Fed Chairman Ben Bernanke hinted at tapering on May 22, 2013, the GDXJ ETF declined by 32% from May 22 until the taper began on Dec. 18.
Moreover, the onslaught didn’t end there. Once the taper officially began, the GDXJ ETF enjoyed a relief rally (similar to what we’re witnessing now), as long-term interest rates declined and the PMs assumed that the worst was in the rearview.
However, as the liquidity drain caught up to the junior miners over the medium term, the GDXJ ETF declined by another 36% from when the taper was announced on Dec. 18, 2013 until the end of 2015.
Hawkish PMI
S&P Global released its U.S. Composite PMI on Sep. 23; and with the results largely aligning with the data above, it was another month of the same fundamental problems. For example, the headline index increased from 44.6 in August to 49.3 in September. More importantly, the report revealed:
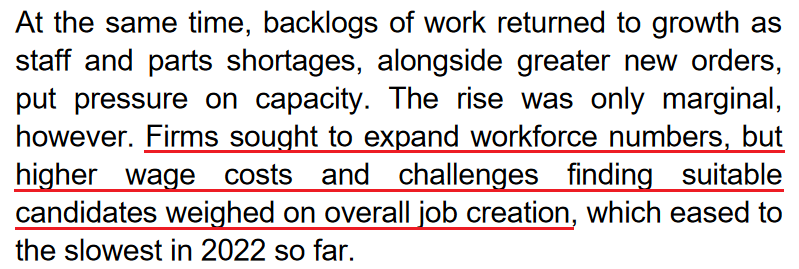
“Employment across the private sector rose further in September, albeit at a softer pace than in August. The moderate upturn in workforce numbers reflected expansions in manufacturing and service sector staffing levels. The rate of job creation at goods producers was the sharpest for six months amid greater success in hiring suitable candidates for vacancies.”
Thus, while investors hope the U.S. labor market craters so the Fed can pivot, the reality is that employment remains resilient. Therefore, with U.S. manufacturing and service sector firms continuing to increase their workforces, we’re far from the demand destruction that would cause the Fed to pause.
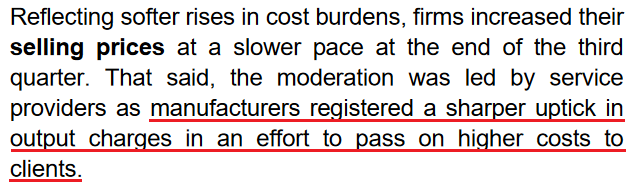
In addition, while input inflation rose at its “slowest since the start of 2021,” the uptick still occurred at a “historically elevated pace.” Furthermore, while inflation cooled across the service sector, U.S. manufacturers increased their output prices at a faster pace in September. As such, after 12 25 basis point rate hikes in 2022, little inflation progress has materialized.
Please see below:
 Source: S&P Global
So, with the Fed’s dual mandate – maximum employment and price stability – still materially out of whack, the duo is moving in the wrong direction. Likewise, with demand for labor outweighing supply, wage inflation is unlikely to subside until firms reduce job openings, stop hiring and then lay off staff. Yet, on aggregate, we’re nowhere near this outcome.
As a result, with U.S. service sector companies still dealing with the same old problems, S&P Global’s data also highlights why the medium-term outlooks are so bullish for the FFR, the U.S. 2-Year Treasury yield, the USD Index and U.S. real yields.
 Source: S&P Global
Multiple Compression
While a higher U.S. 10-Year real yield is fundamentally bearish for the PMs, its uprising is also an ominous sign for the S&P 500’s forward price-to-earnings (P/E) ratio. As such, with the GDXJ ETF more correlated to the general stock market than its precious metals peers, a sharp sell-off could spell trouble for the junior miners.
Please see below:
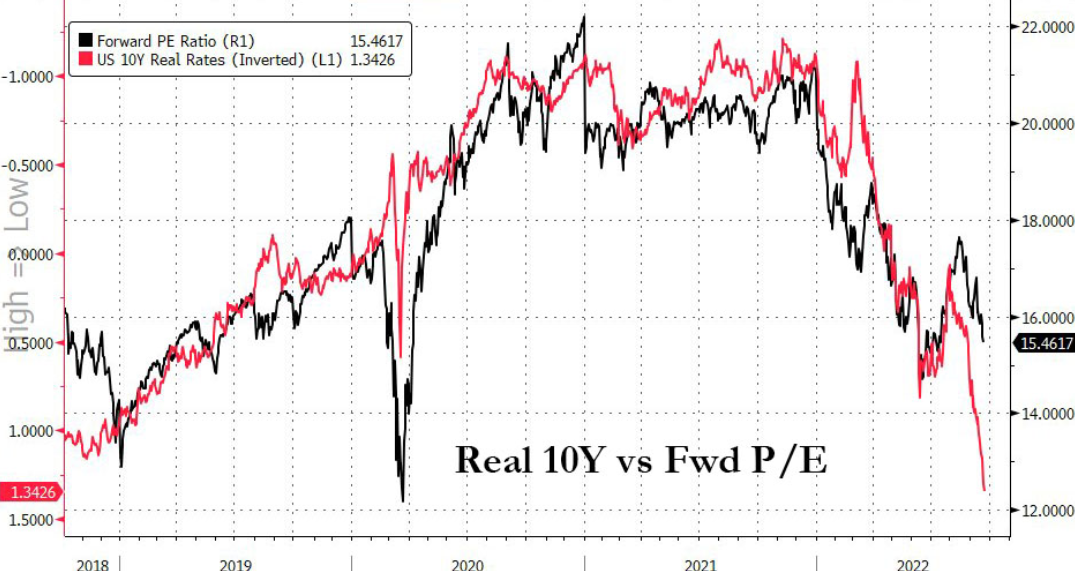 Source: Bloomberg/ZeroHedge
To explain, the black line above tracks the S&P 500's forward P/E, while the red line above tracks the inverted (down means up) U.S. 10-Year real yield. If you analyze the right side of the chart, you can see that the U.S. 10-Year real yield has surged recently.
Moreover, while the S&P 500's recent drawdown may seem substantial, the reality is that a current forward P/E of ~15.5x should look more like ~12.5x, given the U.S. 10-Year real yield's performance. Thus, if the S&P 500 re-rates substantially, it should culminate with lower lows for the GDXJ ETF.
The Bottom Line
With the GDXJ ETF plunging by more than 6% on Sep. 23, the junior miners have been on a collision course lower for much of 2021 and 2022. Likewise, with gold also closing at a new 2022 low on Sep. 23, the cross-asset price action continues to unfold as expected. In addition, while I warned that the Fed’s inflation fight would be one of attrition, the battle is far from over. Therefore, new lows should confront gold, silver and mining stocks in the months ahead before long-term buying opportunities emerge.
In conclusion, the PMs declined on Sep. 23, as the bloodbath intensified. Moreover, with the EUR/USD sinking to another 2022 low, reality has caught up to several financial assets. As such, we expect more of the same over the medium term.
Overview of the Upcoming Part of the Decline
- It seems to me that the corrective upswing is over, and that the next big move lower is already underway.
- If we see a situation where miners slide in a meaningful and volatile way while silver doesn’t (it just declines moderately), I plan to – once again – switch from short positions in miners to short positions in silver. At this time, it’s too early to say at what price levels this could take place and if we get this kind of opportunity at all – perhaps with gold prices close to $1,600.
- I plan to switch from the short positions in junior mining stocks or silver (whichever I’ll have at that moment) to long positions in junior mining stocks when gold / mining stocks move to their 2020 lows (approximately). While I’m probably not going to write about it at this stage yet, this is when some investors might consider getting back in with their long-term investing capital (or perhaps 1/3 or 1/2 thereof).
- I plan to return to short positions in junior mining stocks after a rebound – and the rebound could take gold from about $1,450 to about $1,550, and it could take the GDXJ from about $20 to about $24.
- I plan to exit all remaining short positions once gold shows substantial strength relative to the USD Index while the latter is still rallying. This may be the case with gold prices close to $1,400 and GDXJ close to $15 . This moment (when gold performs very strongly against the rallying USD and miners are strong relative to gold after its substantial decline) is likely to be the best entry point for long-term investments, in my view. This can also happen with gold close to $1,400, but at the moment it’s too early to say with certainty.
- The above is based on the information available today, and it might change in the following days/weeks.
You will find my general overview of the outlook for gold on the chart below:
Please note that the above timing details are relatively broad and “for general overview only” – so that you know more or less what I think and how volatile I think the moves are likely to be – on an approximate basis. These time targets are not binding nor clear enough for me to think that they should be used for purchasing options, warrants, or similar instruments.
Summary
Summing up, it seems that the biggest part of the 2013-like decline is taking place right now, and – while I can’t make any promises regarding performance - it seems likely to me that our big profits are about to become huge, and then ridiculously big in the relatively near future.
Things might happen very fast in the coming days, and if I plan to make any adjustments, I’ll keep you informed. Still, if the targets that I’m mentioning in the “Trading” part of the summary are reached, I think that profits should be taken off the table without an additional confirmation from me. I will probably get on the long side of the market at that time, but I’ll send a confirmation if I decide to do so.
After the final sell-off (that takes gold to about $1,350-$1,500), I expect the precious metals to rally significantly. The final part of the decline might take as little as 1-5 weeks, so it's important to stay alert to any changes.
As always, we'll keep you – our subscribers – informed.
To summarize:
Trading capital (supplementary part of the portfolio; our opinion): Full speculative short positions (300% of the full position) in junior mining stocks are justified from the risk to reward point of view with the following binding exit profit-take price levels:
Mining stocks (price levels for the GDXJ ETF): binding profit-take exit price: $20.32; stop-loss: none (the volatility is too big to justify a stop-loss order in case of this particular trade)
Alternatively, if one seeks leverage, we’re providing the binding profit-take levels for the JDST (2x leveraged). The binding profit-take level for the JDST: $29.87; stop-loss for the JDST: none (the volatility is too big to justify a SL order in case of this particular trade).
For-your-information targets (our opinion; we continue to think that mining stocks are the preferred way of taking advantage of the upcoming price move, but if for whatever reason one wants / has to use silver or gold for this trade, we are providing the details anyway.):
Silver futures downside profit-take exit price: $12.32
SLV profit-take exit price: $11.32
ZSL profit-take exit price: $79.87
Gold futures downside profit-take exit price: $1,504
HGD.TO – alternative (Canadian) 2x inverse leveraged gold stocks ETF – the upside profit-take exit price: $19.87
HZD.TO – alternative (Canadian) 2x inverse leveraged silver ETF – the upside profit-take exit price: $49.87
Long-term capital (core part of the portfolio; our opinion): No positions (in other words: cash)
Insurance capital (core part of the portfolio; our opinion): Full position
Whether you’ve already subscribed or not, we encourage you to find out how to make the most of our alerts and read our replies to the most common alert-and-gold-trading-related-questions.
Please note that we describe the situation for the day that the alert is posted in the trading section. In other words, if we are writing about a speculative position, it means that it is up-to-date on the day it was posted. We are also featuring the initial target prices to decide whether keeping a position on a given day is in tune with your approach (some moves are too small for medium-term traders, and some might appear too big for day-traders).
Additionally, you might want to read why our stop-loss orders are usually relatively far from the current price.
Please note that a full position doesn't mean using all of the capital for a given trade. You will find details on our thoughts on gold portfolio structuring in the Key Insights section on our website.
As a reminder - "initial target price" means exactly that - an "initial" one. It's not a price level at which we suggest closing positions. If this becomes the case (as it did in the previous trade), we will refer to these levels as levels of exit orders (exactly as we've done previously). Stop-loss levels, however, are naturally not "initial", but something that, in our opinion, might be entered as an order.
Since it is impossible to synchronize target prices and stop-loss levels for all the ETFs and ETNs with the main markets that we provide these levels for (gold, silver and mining stocks - the GDX ETF), the stop-loss levels and target prices for other ETNs and ETF (among other: UGL, GLL, AGQ, ZSL, NUGT, DUST, JNUG, JDST) are provided as supplementary, and not as "final". This means that if a stop-loss or a target level is reached for any of the "additional instruments" (GLL for instance), but not for the "main instrument" (gold in this case), we will view positions in both gold and GLL as still open and the stop-loss for GLL would have to be moved lower. On the other hand, if gold moves to a stop-loss level but GLL doesn't, then we will view both positions (in gold and GLL) as closed. In other words, since it's not possible to be 100% certain that each related instrument moves to a given level when the underlying instrument does, we can't provide levels that would be binding. The levels that we do provide are our best estimate of the levels that will correspond to the levels in the underlying assets, but it will be the underlying assets that one will need to focus on regarding the signs pointing to closing a given position or keeping it open. We might adjust the levels in the "additional instruments" without adjusting the levels in the "main instruments", which will simply mean that we have improved our estimation of these levels, not that we changed our outlook on the markets. We are already working on a tool that would update these levels daily for the most popular ETFs, ETNs and individual mining stocks.
Our preferred ways to invest in and to trade gold along with the reasoning can be found in the how to buy gold section. Furthermore, our preferred ETFs and ETNs can be found in our Gold & Silver ETF Ranking.
As a reminder, Gold & Silver Trading Alerts are posted before or on each trading day (we usually post them before the opening bell, but we don't promise doing that each day). If there's anything urgent, we will send you an additional small alert before posting the main one.
Thank you.
Przemyslaw Radomski, CFA
Founder, Editor-in-chief

