

Briefly: in our opinion, full (300% of the regular position size) speculative short positions in mining stocks are justified from the risk/reward point of view at the moment of publishing this Alert.
The Greatest Show
Ladies and gentlemen, we have a breakdown! Junior miners have just broken to new yearly lows, which means that everyone who joined us in the short position in the junior miners this year is now profitable (if they kept their position intact, that is). In fact, everyone who joined the trade in the past 12 months is profitable as well. In many cases, the profits are already huge.
And the best part is that this move is just getting started! That’s what the long-term HUI Index chart and long-term gold charts tell us. I went over both in detail in yesterday’s flagship Gold & Silver Trading Alert, so I don’t want to go through them once again today. I want, however, to make sure that the context of the breakdown to new yearly lows in the GDXJ is clear: this is not the end of the move, but a confirmation that its key (and the most profitable) part has just started.
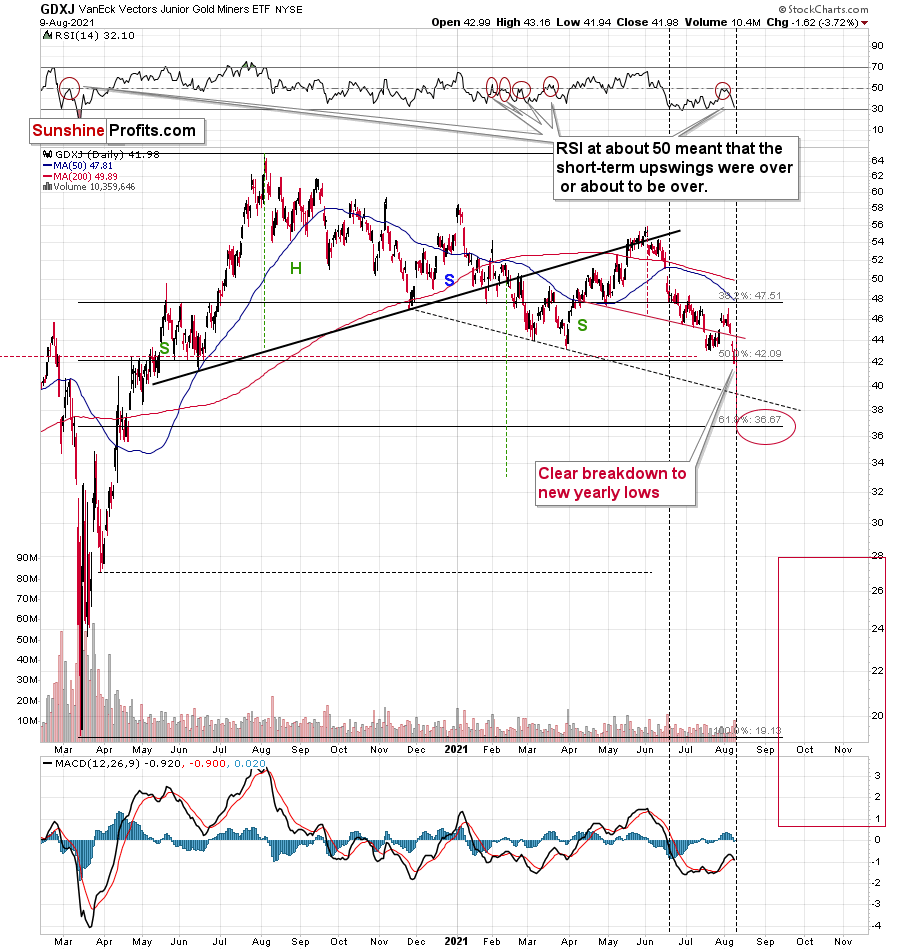
The volume on which yesterday’s decline took place was significant enough to confirm the validity of the breakdown. However, I wouldn’t be myself if I didn’t check what happened when we previously saw a boost in the volume levels. I marked it with vertical dashed lines, and as you can see on the above chart, we saw the same thing in mid-June. We also saw the RSI indicator move relatively close to 30 then.
Some might view this as a sign of a reversal, but history suggests otherwise. Back in mid-June, there was a slight pause which was then followed by more declines, and a short-term bottom almost a month later. While it seems that we might see the next short-term bottom sooner, the key takeaway remains intact – the possible bullish indications that might appear to be important at first sight are actually nonexistent. Thus, the profits on the short positions are likely to become much bigger in the upcoming weeks.
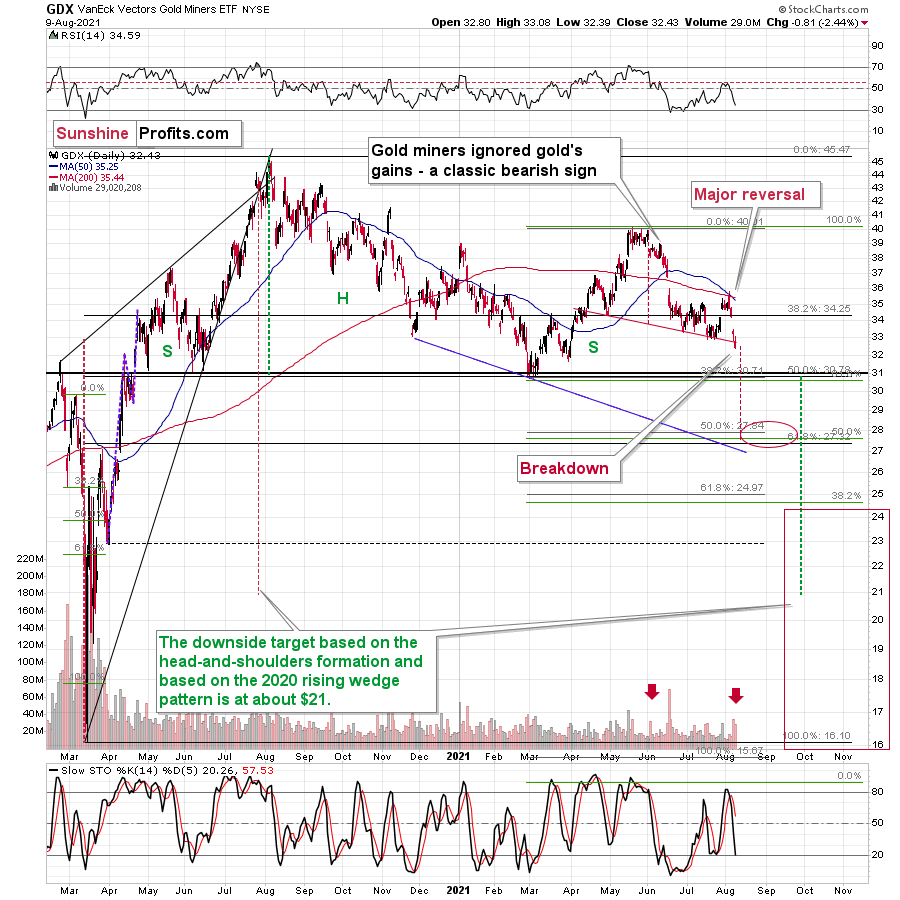
Senior miners (GDX) didn’t decline as much as the GDXJ, and, unlike the latter, they didn’t move to new yearly lows. But they did something important from the technical point of view. Namely, the GDX ETF broke below the neck level of its head-and-shoulders pattern.
This move was not yet confirmed, but with the significant volume on which it took place, it looks quite believable. Therefore, it wouldn’t be surprising to see a few days of consolidation before senior miners move much lower.
In fact, gold has been consolidating so far in today’s pre-market trading, doing almost nothing.
Gold is a few dollars higher, which is actually more bearish than bullish as far as the immediate term is concerned. Why? Because if the recent move lower was fake, gold would be likely to rally without looking back. Remember silver’s fake-out just a few days ago? Silver didn’t hesitate before declining shortly thereafter. So, the fact that gold is up by only a few dollars is actually bearish, as it’s less bullish price action than what one would expect if the recent decline was fake / temporary.
This means that the scenario that I outlined yesterday remains very much up-to-date:
I previously wrote multiple times that the gold market seems to really want to decline, and what happened over the last few trading days shows you that the market agreed with me.
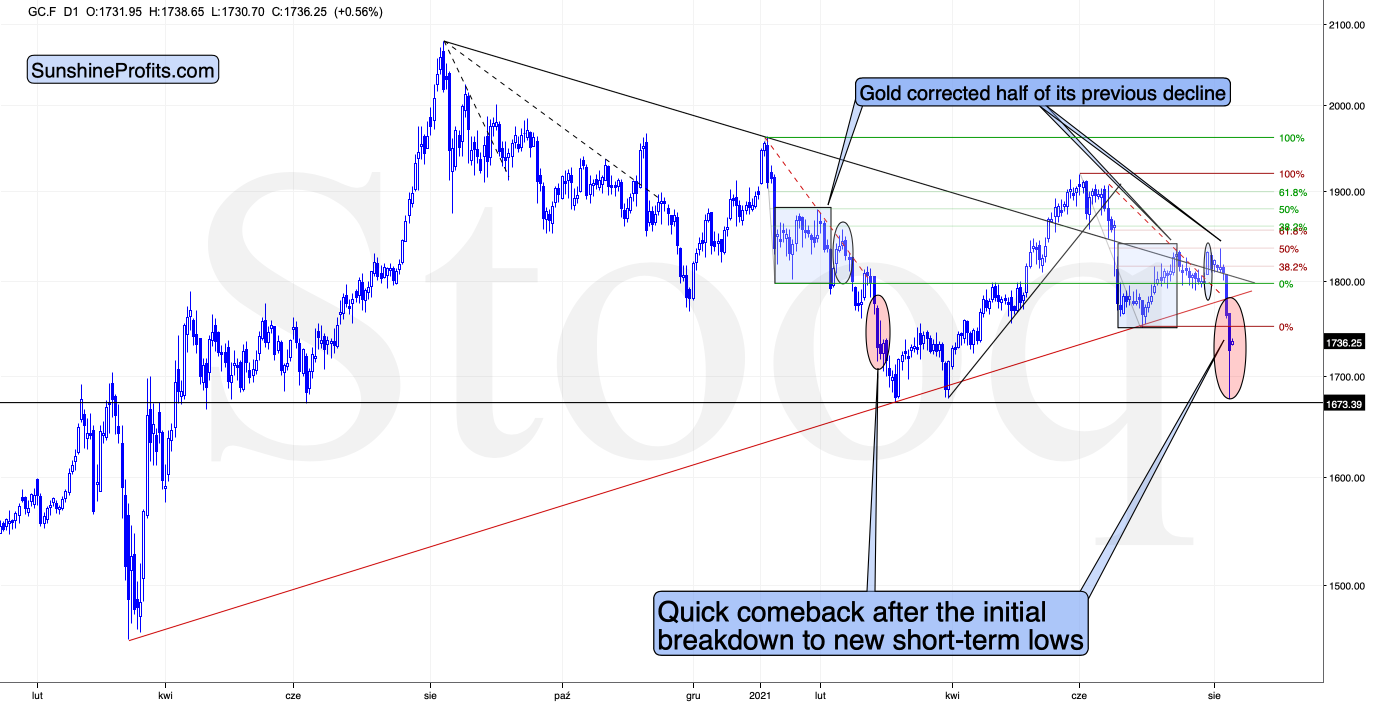
Now, the shape of today’s pre-market movement might be concerning, as it’s ultimately a huge intraday reversal – at least so far. And intraday reversals tend to be bullish. Should we view the current movement as bullish then?
No.
As always, context is important. And this time, the context is provided by two similar situations: one from February and one from June. Back in February (marked with a red ellipse), when gold was right after a breakdown below the previous lows, it moved back up quickly after the initial slide. This didn’t mean that the decline ended. Consequently, seeing something similar this time shouldn’t make one think that the decline is over.
The most recent case when gold plunged was the fall in June. That’s when the yellow metal declined below $1,800. Right after the most volatile part of the decline, it moved back up, but that was not the true bottom. Gold continued to move lower after a quick breather, and it bottomed less than two weeks later.
All in all, based on both the above-mentioned analogies and on the triangle-vertex-based reversal, it seems quite likely that we’ll see a short-term bottom in the PMs and miners in the second half of August.
Also, let’s keep in mind that while gold corrected in June, junior gold miners really didn’t – they declined in a much steadier manner.
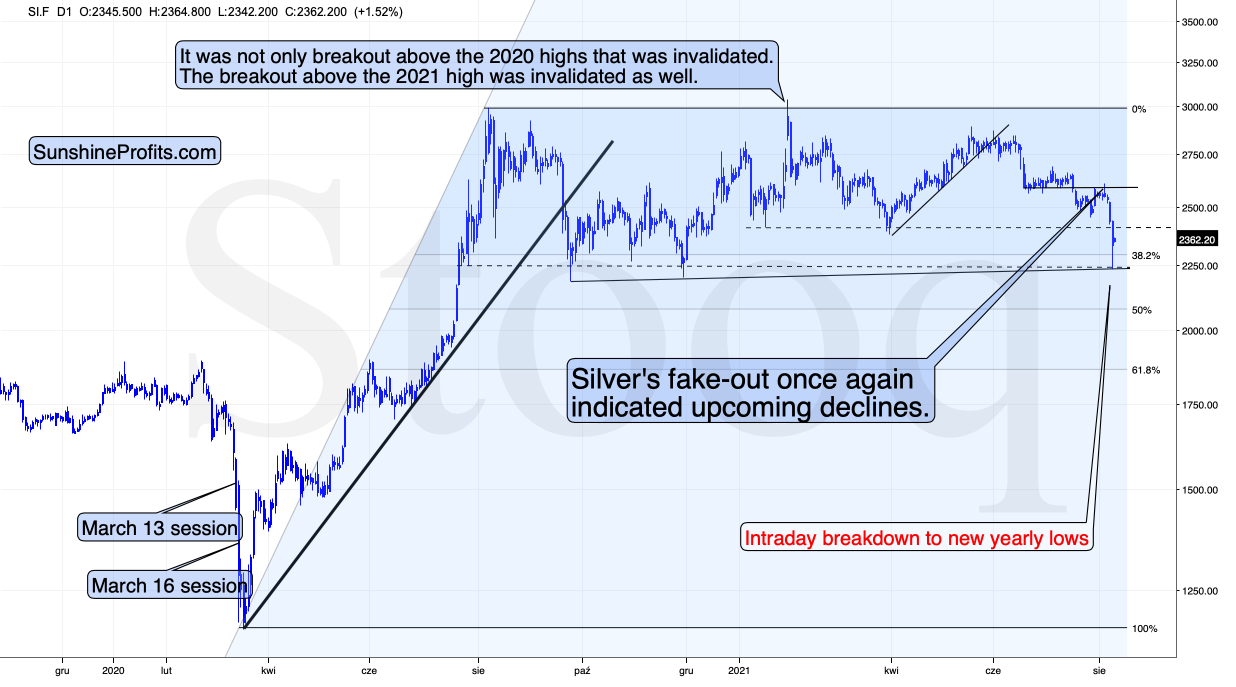
And speaking of silver, please note that despite yesterday’s correction, silver didn’t invalidate its breakout to new yearly lows.
Consequently, my yesterday’s comments on silver remain up-to-date:
While silver already moved to its support lines and then bounced back up, it doesn’t mean that the final medium-term bottom is in.
The move lower was volatile, and the support provided by the previous lows was strong. Consequently, a quick rebound here is quite natural.
Why isn’t silver likely to rally once again to $30 or so before declining (or not to decline at all)? Because of all the reasons that I wrote due to which gold is likely to decline. The white metal is unlikely to move completely independently of the yellow one. Instead, it’s likely to magnify its declines in their final parts. Besides, let’s keep in mind silver’s long-term cycle that I discussed earlier today.
The Dollar’s Importance
There are many very good reasons to expect continued declines in the precious metals; the breakout above the inverse head-and-shoulders pattern in the USD Index is one of them.
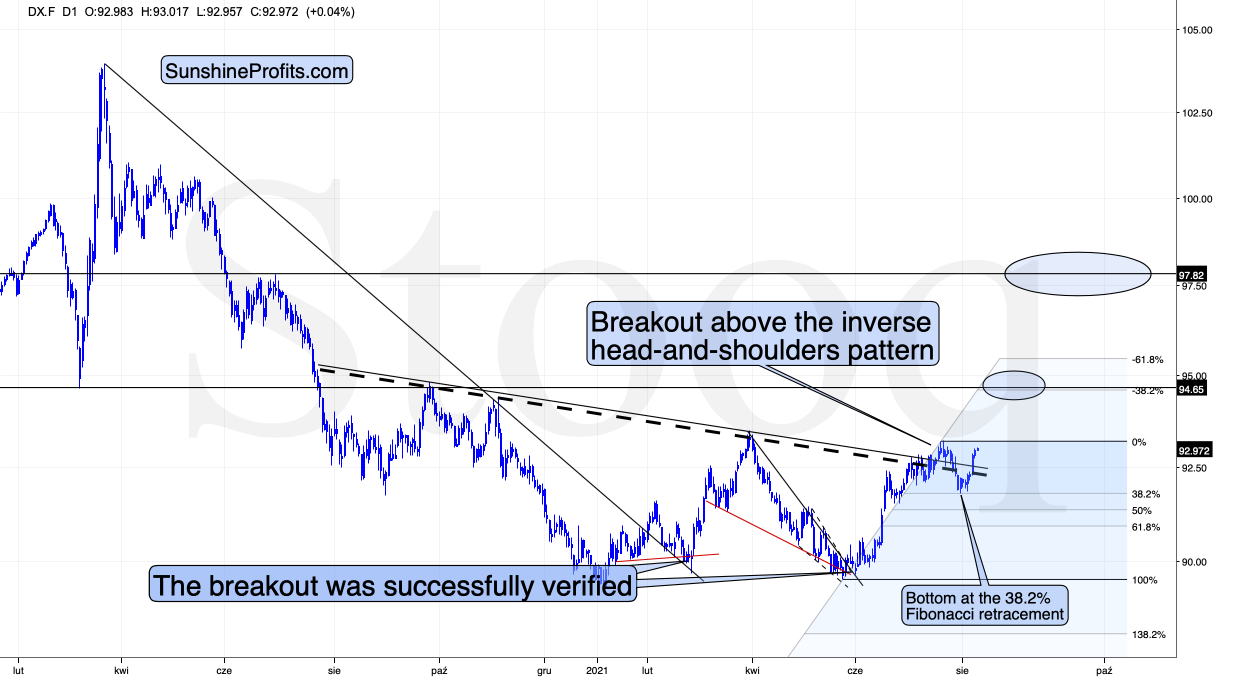
The August 2020 highs are the next short-term resistance for the USD Index, but I don’t expect it to decline significantly from there. Instead, it seems to me that the USDX will rally to almost 98 based on the inverse H&S pattern, and then it might consolidate.
The recent invalidation of the pattern was fake, similar to the fake nature of the pullback that we saw in 2014 – right before the USD’s massive upswing.
After all, they both took place in the middle of the year.
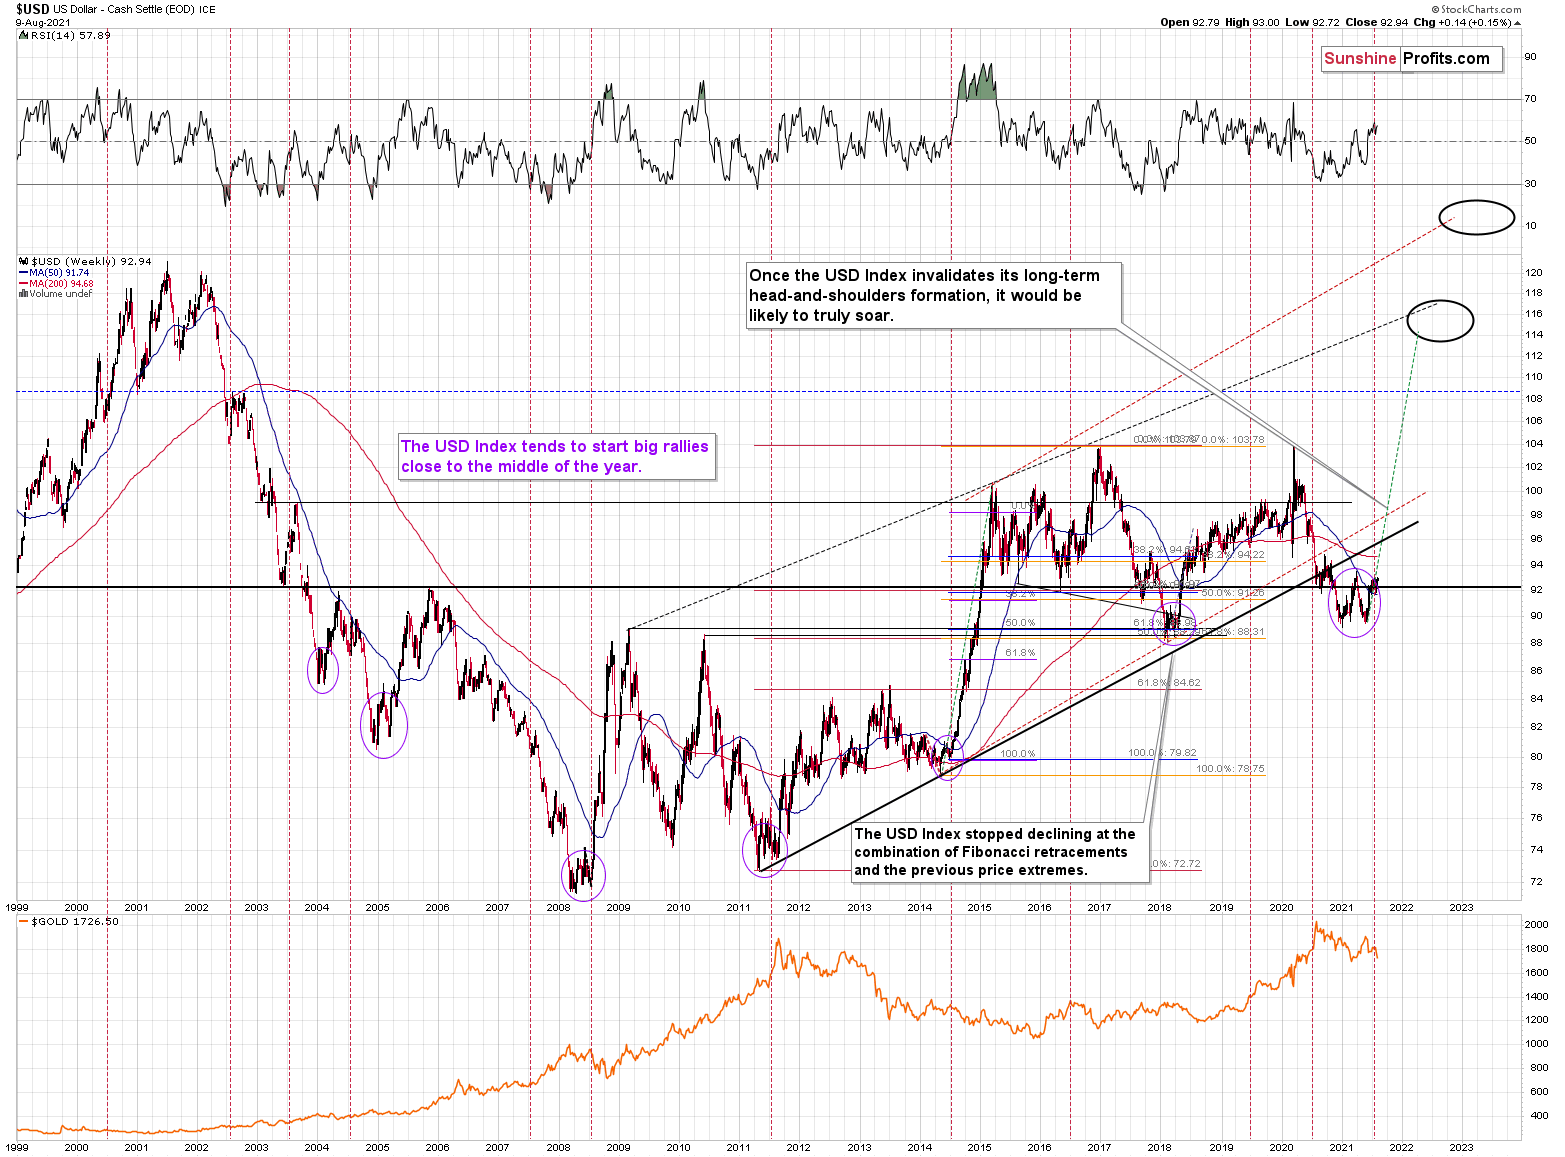
Let’s not forget that gold has been declining for a year now, and it has been doing so while the USD Index was declining (mostly). If the gold market was so weak that it declined despite the factor that should normally make it rally, then just think how significantly it will decline when the USD Index finally does rally in a meaningful way.
Having said that, let’s take a look at the market from a more fundamental angle.
Employment Appetite
With rising U.S. employment the key to decoding the U.S. Federal Reserve’s (FED) taper timeline, I warned on Jun. 9 that the labor market’s strength in August and September could devour the PMs.
I wrote:
With U.S. nonfarm payrolls well below their pre-pandemic highs, the FED can ignore rampant inflation and use high unemployment as an excuse for further easing. However, with the U.S. Bureau of Labor Statistics (BLS) revealing on Jun. 8 that U.S. job openings surged to an all-time high of 9.286 million – and came in well above the consensus estimate of 8.300 million – the only thing depressing the U.S. labor market are ill-advised enhanced unemployment benefits.
Please see below:
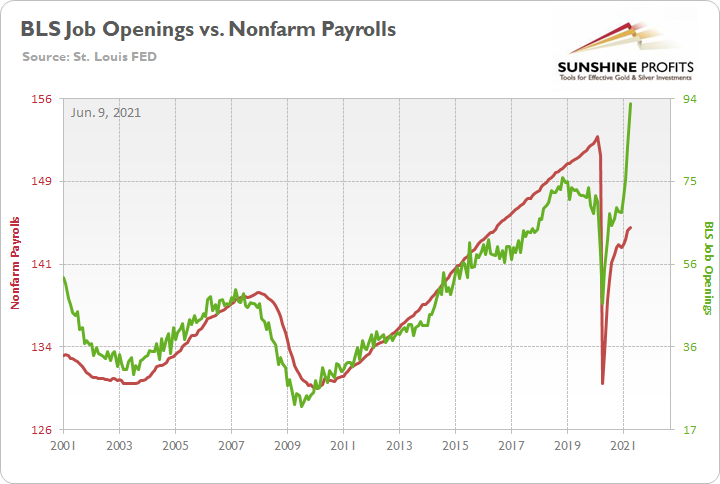
To explain, the red line above tracks U.S. nonfarm payrolls, while the green line above tracks U.S. job openings. If you analyze the relationship, you can see that the latter is often a strong predictor of the former. However, with enhanced unemployment benefits still in effect until mid-to-late June or early July (across ~25 states) – and nationwide until Sep. 6 (expected) – the shift likely won’t occur overnight. But once the benefits expire, U.S. nonfarm payrolls will likely spike in August (reflecting July’s data) and September (reflecting August’s data) and lift the U.S. 10-Year Treasury yield and the USD Index in the process.
And while some investors enjoyed a five-minute head start on Aug. 6, with U.S. nonfarm payrolls (released at 8:30 a.m. ET) coming in at 943,000 vs. 845,000 expected (Dow Jones consensus estimate), the employment surge took a huge bite out of the PMs’ performance.
Please see below:
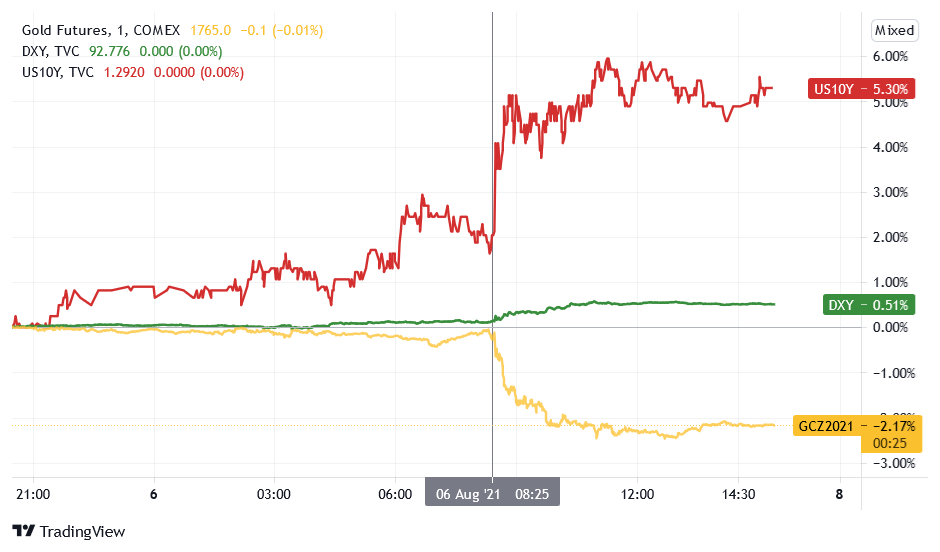
To explain, the green and red lines above track the USD Index and the U.S. 10-Year Treasury yield, while the gold line above tracks the gold futures price. If you analyze the right side of the chart, you can see that the morning announcement was extremely unkind to the yellow metal.
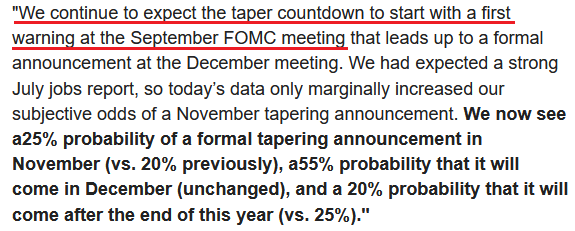
To that point, with the coming months expected to elicit more of the same, Jan Hatzius, chief economist at Goldman Sachs, wrote that the “countdown” to the FED’s taper announcement is already underway.
Please see below:
 Source: Zero Hedge
Accelerating her timeline, Katherine Judge, senior economist at CIBC Capital Markets, also expects a September to remember:
“With many states set to see the unemployment benefit top-ups expire in early September, healthy job gains should continue ahead, in line with elevated job openings. This print should be enough to allow the Fed to announce an early 2022 tapering of QE at the September meeting.”
Aligning with his peers, Chris Turner, head of FX strategy at ING Bank, told clients that the FED’s pain is the U.S. dollar’s gain:
“The stronger-than-expected jobs report makes it more likely that Federal Reserve Chair Jerome Powell may drop heavy hints at the Jackson Hole Symposium later this month that the central bank may prepare to start tapering over subsequent months. The data is positive for the dollar versus the low-yielders such as the yen and euro.”
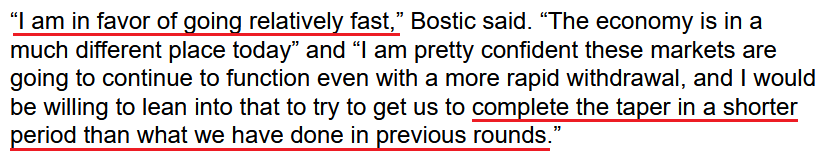
On top of that, Atlanta FED President Raphael Bostic told reporters on Aug. 9 that “we are well on the road to substantial progress toward our goal” and “I’m thinking in the October-to-December range” for a formal reduction of the FED’s bond-buying program. What’s more, not only did Bostic amplify the FED’s hawkish stance, but he also advocated for an accelerated unwind.
Please see below:
 Source: Bloomberg
We Are Famous!
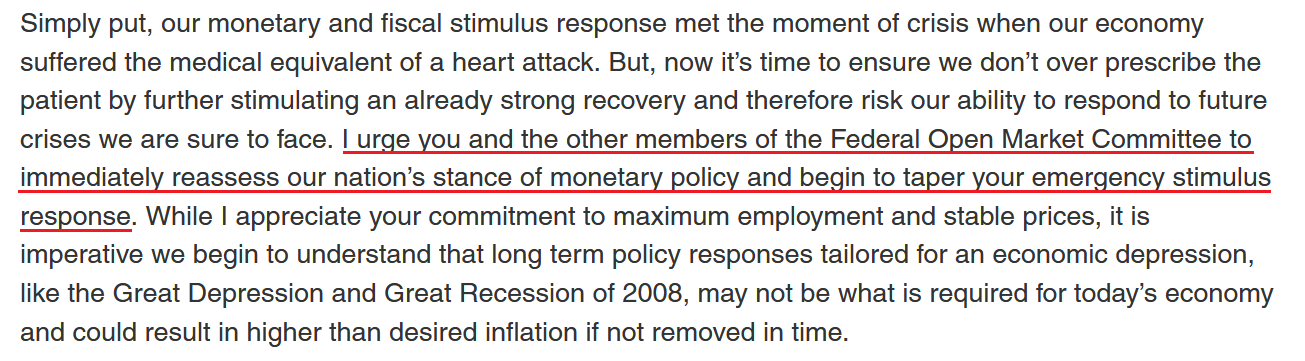
If that wasn’t enough, political pressure on the FED has officially gone mainstream. With inflation surging and the U.S. labor market healing, the dichotomy between growth and the FED’s policies has become so noticeable that U.S. Senator Joe Manchin (a Democrat from West Virginia) wrote a letter to Chairman Jerome Powell on Aug. 5 urging action. He wrote:
“With the recession over and our strong economic recovery well underway, I am increasingly alarmed that the Fed continues to inject record amounts of stimulus into our economy... The Fed has sustained $120 billion per month in asset purchases since June 2020, despite increasing vaccination rates to combat the virus and additional fiscal stimulus from Congress in the ARP. The record amount of stimulus in the economy has led to the most inflation momentum in 30 years, and our economy has not even fully reopened yet. I am deeply concerned that the continuing stimulus put forth by the Fed, and proposal for additional fiscal stimulus, will lead to our economy overheating and to unavoidable inflation taxes that hard-working Americans cannot afford.”
And how does he want Powell to respond?
 Source: manchin.senate.gov
Adding to the PMs’ ills, while their version of a taper tantrum resulted in a ‘flash crash’ on Aug. 8 (during futures trading hours), pressure on the FED will likely accelerate in the coming months. Case in point: the U.S. Bureau of Labor Statistics (BLS) revealed on Aug. 9 that U.S. job openings hit another all-time high of 10.1 million. More importantly, though, there are now more job openings than U.S. citizens unemployed. An excerpt from the report read:
“On the last business day of June, the job openings level increased to a series high of 10.1 million (+590,000). The job openings rate rose to 6.5 percent. Job openings increased in several industries, with the largest increases in professional and business services (+227,000); retail trade (+133,000); and accommodation and food services (+121,000). The number of job openings increased in the South region.”
To that point, while Powell has preached patience on numerous occasions, the U.S. jobs recovery is tracking well ahead of prior recessions.
Please see below:
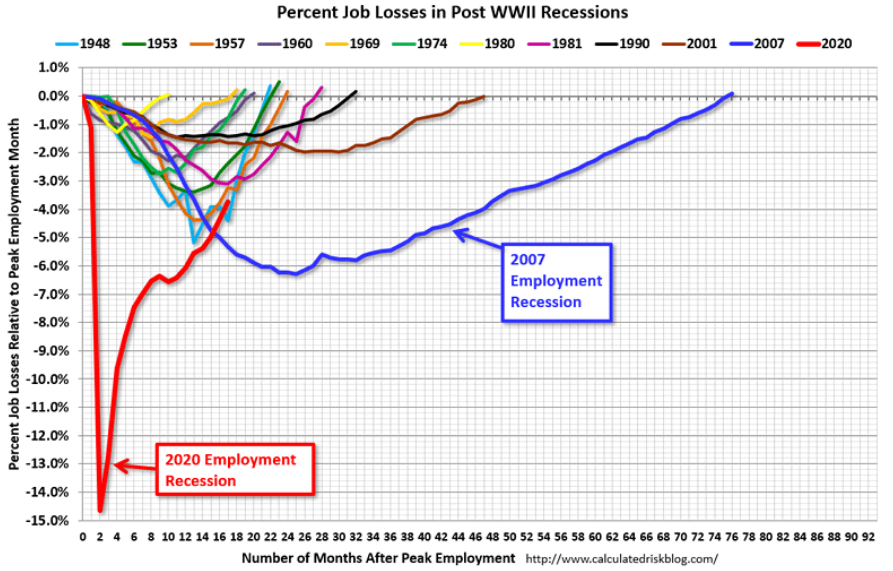
To explain, the various lines above track the number of months that it took the U.S. economy to recover its employment levels following historical recessions. If you analyze the blue (2007) and the brown (2001) lines above, you can see that it took roughly 47 months and 76 months to recover pre-recession employment levels following the dot-com bubble and the global financial crisis (GFC). However, if you focus your attention on the red (2020) line, you can see that the slope of the recovery is tracking well ahead of its predecessors. As a result, the FED’s loose monetary policy remains out of whack with the strength of the U.S. economy.
As further evidence, U.S. retail sales have completely decoupled from U.S. nonfarm payrolls. And with U.S. citizens accelerating their discretionary spending over the last several months, it supports the thesis that enhanced unemployment benefits are responsible for holding back the U.S. labor market.
Please see below:
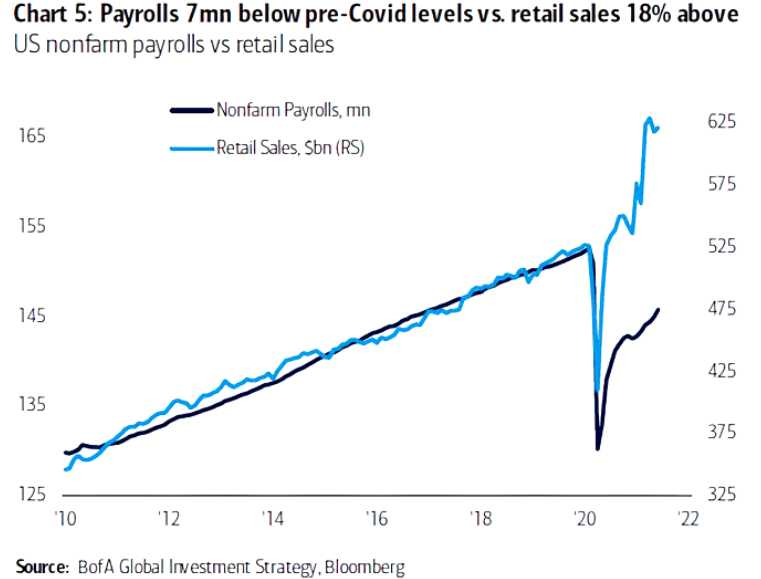
To explain, the dark blue line above tracks U.S. nonfarm payrolls, while the light blue line above tracks U.S. retail sales. If you analyze the right side of the chart, it’s easy to spot the epic divergence. Moreover, if U.S. citizens were so concerned about their financial health and their employment prospects, would they so eagerly spend money on discretionary items? Of course not. They would adopt prudent spending habits and budget accordingly.
The bottom line? With enhanced unemployment benefits scheduled to end in September, an even larger hiring surge is likely to materialize in the fall. And with inflation already abundant, an acceleration of the FED’s taper timeline has put upward pressure on short-and-long-term interest rates. Moreover, not only are the PMs highly allergic to rising U.S. yields, but hawkish bets have also lit a fire under the USD index. As a result, the double-edged sword is striking right at the heart of the PMs.
In conclusion, the PMs plunged precipitously on Aug. 9, as rattled investors struggle to comprehend the shifting landscape. And with FED officials serving up a buffet of hawkish rhetoric, the PMs became the main course amid the bearish feeding frenzy. Moreover, with fundamental tailwinds uplifting the U.S. 10-Year Treasury yield and the USD Index, the PMs remain starved for attention. As a result, while their long-term outlooks remain extremely bright, the end of easy money implies that caution is warranted over the medium term.
Overview of the Upcoming Part of the Decline
- The corrective upswing in gold is over, and the big decline seems to be already underway.
- After miners slide in a meaningful and volatile way, but silver doesn’t (and it just declines moderately), I plan to switch from short positions in miners to short positions in silver. At this time, it’s too early to say at what price levels this would take place – perhaps with gold close to $1,600. I plan to exit those short positions when gold shows substantial strength relative to the USD Index, while the latter is still rallying. This might take place with gold close to $1,350 - $1,500 and the entire decline (from above $1,900 to about $1,475) would be likely to take place within 6-20 weeks, and I would expect silver to fall the hardest in the final part of the move. This moment (when gold performs very strongly against the rallying USD and miners are strong relative to gold – after gold has already declined substantially) is likely to be the best entry point for long-term investments, in my view. This might also happen with gold close to $1,475, but it’s too early to say with certainty at this time.
- As a confirmation for the above, I will use the (upcoming or perhaps we have already seen it?) top in the general stock market as the starting point for the three-month countdown. The reason is that after the 1929 top, gold miners declined for about three months after the general stock market started to slide. We also saw some confirmations of this theory based on the analogy to 2008. All in all, the precious metals sector would be likely to bottom about three months after the general stock market tops.
- The above is based on the information available today, and it might change in the following days/weeks.
Please note that the above timing details are relatively broad and “for general overview only” – so that you know more or less what I think and how volatile I think the moves are likely to be – on an approximate basis. These time targets are not binding or clear enough for me to think that they should be used for purchasing options, warrants or similar instruments.
Gold / Silver Trade Info
In the previous weeks, I’ve been featuring a specific section in the description of my thoughts about one’s trading capital. It stated:
For-your-information targets (our opinion; we continue to think that mining stocks are the preferred way of taking advantage of the upcoming price move, but if for whatever reason one wants / has to use silver or gold for this trade, we are providing the details anyway.):
Silver futures upside profit-take exit price: unclear at this time - initially, it might be a good idea to exit when gold moves to $1,683
Gold futures upside profit-take exit price: $1,683
Now, since gold touched this level yesterday, if one’s profits on the short positions in gold and/or silver were realized (congratulations!), I think that re-entering those positions is justified from the risk to reward point of view right now, with the same profit-take price. Naturally, I prefer to be shorting junior gold miners than gold or silver at this time, but if the reason due to which one couldn’t enter a short position in the junior miners is still intact, re-entering the short position in gold and/or silver would be justified from the risk to reward point of view (at least in my view).
Letters to the Editor
Q: You provide one of the best analyses of the market. I would like to know if you can send me a long-term chart of EUR/USD, just like the USD index chart from the 1980s for analysis. Also, please let me know where I can obtain such a chart if possible. Moreover, I would like to know your view on the long-term inflation outlook. If current inflation has base effects, don't you think that next year we could see the deflationary risk if the economy slows down due to fading effects of fiscal policy and monetary policy (if yields rise)?
A: Thank you for the kind words, I’m very happy to hear that you enjoy my analyses so much! You won’t find the EUR/USD chart from the 1980s because the euro didn’t exist at that time. It was adopted in 1995 and was officially introduced as an accounting currency in 1999. You can find more about its history over here.
I think that stagflation is the most likely long-term outlook. It’s a mix of inflation (after all, the amounts of money that were printed were gargantuan) and low economic growth (stagnation) – something similar to what we saw in the 1970s.
Q: I hope you are doing well, nice development with gold following your instructions and predictions. I want to hear your thoughts about gold ramping back up to the 1800s before sliding massively again. Is this a possibility?
A: Possibility – yes. Likelihood – no. Based on the self-similarity to 2011-2013 (which has been remarkable recently), gold has already completed its consolidation stage after the first big decline and is now likely to move lower without any additional significant move higher. I mean, I wouldn’t be surprised to see a move higher by $10-$30, but a bigger rally to the $1,800s seems quite unlikely, in my view.
Summary
To summarize, the corrective upswing in gold is over, and it seems that the big downswing in gold, silver, and mining stocks is already underway. While the next few days may (!) bring some back-and-forth action instead of the decline’s continuation, it’s unlikely that this will take place for long. Based on the self-similar pattern in gold (similarity is mostly to the 2011-2013 period), gold is likely to decline to its previous 2021 lows relatively soon, even if it doesn’t happen right away. Based on the analogies to the recent past, it seems quite likely that gold will move lower in the following days and bottom in the second half of August.
It seems that our profits on the short position in the junior mining stocks are going to grow substantially in the following weeks.
After the sell-off (that takes gold to about $1,350 - $1,500), I expect the precious metals to rally significantly. The final part of the decline might take as little as 1-5 weeks, so it's important to stay alert to any changes.
Most importantly, please stay healthy and safe. We made a lot of money last March and this March, and it seems that we’re about to make much more on the upcoming decline, but you have to be healthy to enjoy the results.
As always, we'll keep you - our subscribers - informed.
To summarize:
Trading capital (supplementary part of the portfolio; our opinion): Full speculative short positions (300% of the full position) in mining stocks are justified from the risk to reward point of view with the following binding exit profit-take price levels:
Mining stocks (price levels for the GDXJ ETF): binding profit-take exit price: $37.12; stop-loss: none (the volatility is too big to justify a stop-loss order in case of this particular trade)
Alternatively, if one seeks leverage, we’re providing the binding profit-take levels for the JDST (2x leveraged) and GDXD (3x leveraged – which is not suggested for most traders/investors due to the significant leverage). The binding profit-take level for the JDST: $15.96; stop-loss for the JDST: none (the volatility is too big to justify a SL order in case of this particular trade); binding profit-take level for the GDXD: $37.02; stop-loss for the GDXD: none (the volatility is too big to justify a SL order in case of this particular trade).
For-your-information targets (our opinion; we continue to think that mining stocks are the preferred way of taking advantage of the upcoming price move, but if for whatever reason one wants / has to use silver or gold for this trade, we are providing the details anyway.):
Silver futures upside profit-take exit price: unclear at this time - initially, it might be a good idea to exit, when gold moves to $1,683
Gold futures upside profit-take exit price: $1,683
HGD.TO – alternative (Canadian) inverse 2x leveraged gold stocks ETF – the upside profit-take exit price: $12.88
Long-term capital (core part of the portfolio; our opinion): No positions (in other words: cash
Insurance capital (core part of the portfolio; our opinion): Full position
Whether you already subscribed or not, we encourage you to find out how to make the most of our alerts and read our replies to the most common alert-and-gold-trading-related-questions.
Please note that we describe the situation for the day that the alert is posted in the trading section. In other words, if we are writing about a speculative position, it means that it is up-to-date on the day it was posted. We are also featuring the initial target prices to decide whether keeping a position on a given day is in tune with your approach (some moves are too small for medium-term traders, and some might appear too big for day-traders).
Additionally, you might want to read why our stop-loss orders are usually relatively far from the current price.
Please note that a full position doesn't mean using all of the capital for a given trade. You will find details on our thoughts on gold portfolio structuring in the Key Insights section on our website.
As a reminder - "initial target price" means exactly that - an "initial" one. It's not a price level at which we suggest closing positions. If this becomes the case (like it did in the previous trade), we will refer to these levels as levels of exit orders (exactly as we've done previously). Stop-loss levels, however, are naturally not "initial", but something that, in our opinion, might be entered as an order.
Since it is impossible to synchronize target prices and stop-loss levels for all the ETFs and ETNs with the main markets that we provide these levels for (gold, silver and mining stocks - the GDX ETF), the stop-loss levels and target prices for other ETNs and ETF (among other: UGL, GLL, AGQ, ZSL, NUGT, DUST, JNUG, JDST) are provided as supplementary, and not as "final". This means that if a stop-loss or a target level is reached for any of the "additional instruments" (GLL for instance), but not for the "main instrument" (gold in this case), we will view positions in both gold and GLL as still open and the stop-loss for GLL would have to be moved lower. On the other hand, if gold moves to a stop-loss level but GLL doesn't, then we will view both positions (in gold and GLL) as closed. In other words, since it's not possible to be 100% certain that each related instrument moves to a given level when the underlying instrument does, we can't provide levels that would be binding. The levels that we do provide are our best estimate of the levels that will correspond to the levels in the underlying assets, but it will be the underlying assets that one will need to focus on regarding the signs pointing to closing a given position or keeping it open. We might adjust the levels in the "additional instruments" without adjusting the levels in the "main instruments", which will simply mean that we have improved our estimation of these levels, not that we changed our outlook on the markets. We are already working on a tool that would update these levels daily for the most popular ETFs, ETNs and individual mining stocks.
Our preferred ways to invest in and to trade gold along with the reasoning can be found in the how to buy gold section. Furthermore, our preferred ETFs and ETNs can be found in our Gold & Silver ETF Ranking.
As a reminder, Gold & Silver Trading Alerts are posted before or on each trading day (we usually post them before the opening bell, but we don't promise doing that each day). If there's anything urgent, we will send you an additional small alert before posting the main one.
Thank you.
Przemyslaw Radomski, CFA
Founder, Editor-in-chief

