Briefly: in our opinion, full (300% of the regular position size) speculative short positions in mining stocks are justified from the risk/reward point of view at the moment of publishing this Alert.
Another day, another decline in junior miners – and another increase in profits from short positions in them. Shouldn’t we expect a rebound though?
Well, no. The rebound already happened in late July and early August, and what we see now is the trend being resumed. Consequently, even if it wasn’t for all the long-term analogies to the 2012-2013 declines in gold and gold stocks (HUI Index), one should expect the current short-term decline to be significantly bigger than the counter-trend upswing which ended earlier this month. At this time, the move lower is just somewhat bigger than the preceding rally. Thus, it’s not excessive and can easily continue.
However, let’s keep in mind that periods of very high volatility usually need to be followed by periods of relatively low volatility. That’s when investors verify if the “new reality” – the price levels after the decline – are justified or not. If the market votes “no”, we get huge rebounds and breakdowns’ invalidations. So far this week, the markets have been voting “yes”.
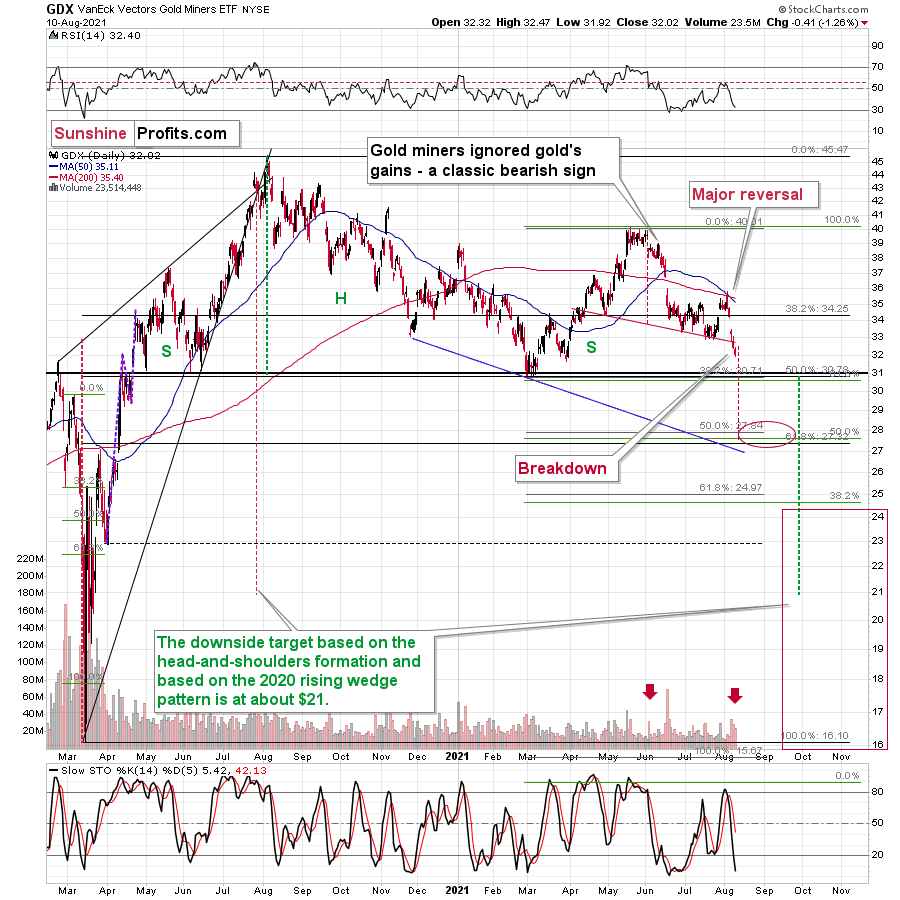
Consequently, the current back-and-forth trading is perfectly normal, and it’s in tune with what I wrote in the previous days – even in the case of the details. While the precious metals are taking a breather, the gold mining stocks continue to decline, but in a steadier manner. That’s what happened earlier this year (in February and in late-June / early-July 2021) and during the 2013 slide.
While a steady decline might not get as many heads turning as big daily slides, it also serves a very important purpose. You see, the mining stocks (GDX includes both: gold stocks and silver stocks) are now verifying the breakdown below the neck level of the head and shoulders pattern. Once this breakdown is verified (just one more daily close is needed), miners will be likely to fall much lower, as the target resulting from this formation is based on the size of its head. In this case, it implies a move to about $28.
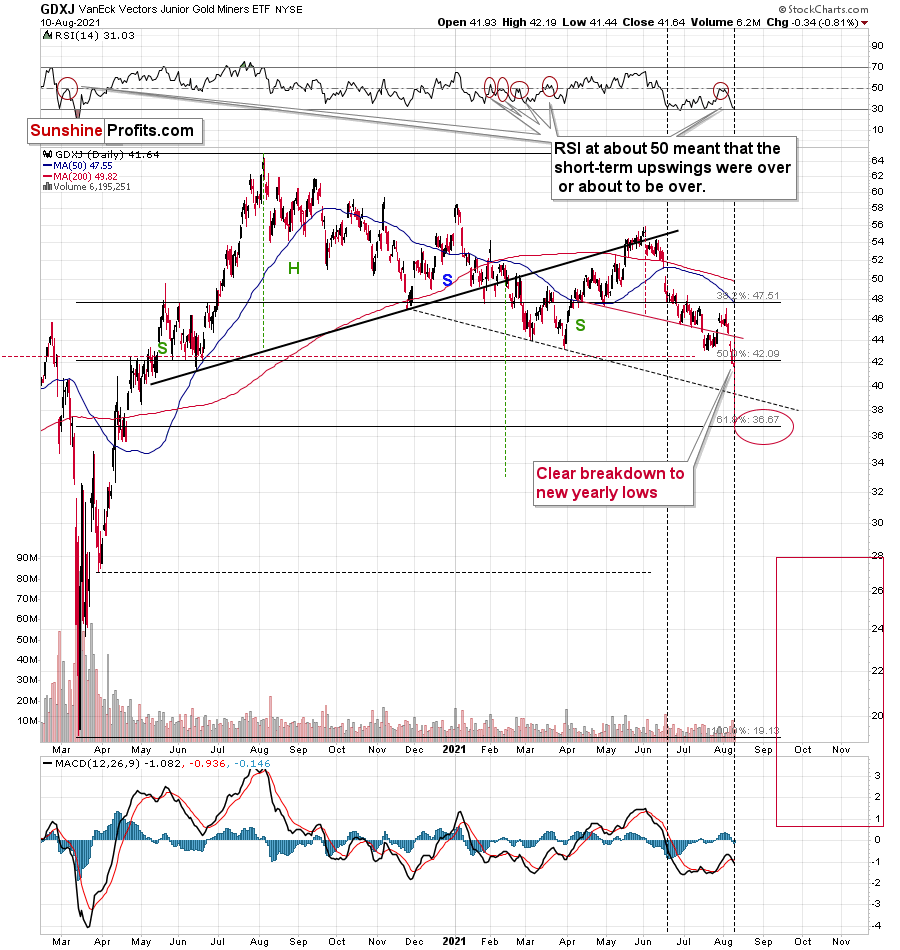
In the case of the junior gold miners, the situation is even more bearish, as they just moved below the previous yearly lows, and they are confirming the breakdown.
Please note how the junior miners lost their momentum right after declining on relatively big volume. In yesterday’s analysis (Aug. 10), I commented on junior miners’ breakdown in the following way:
This move was not yet confirmed, but with the significant volume on which it took place, it looks quite believable. Therefore, it wouldn’t be surprising to see a few days of consolidation before senior miners move much lower.
As I wrote earlier today, gold and silver were not doing much yesterday (and in today’s pre-market trading at the moment of writing these words), but it’s a perfectly normal phenomenon.
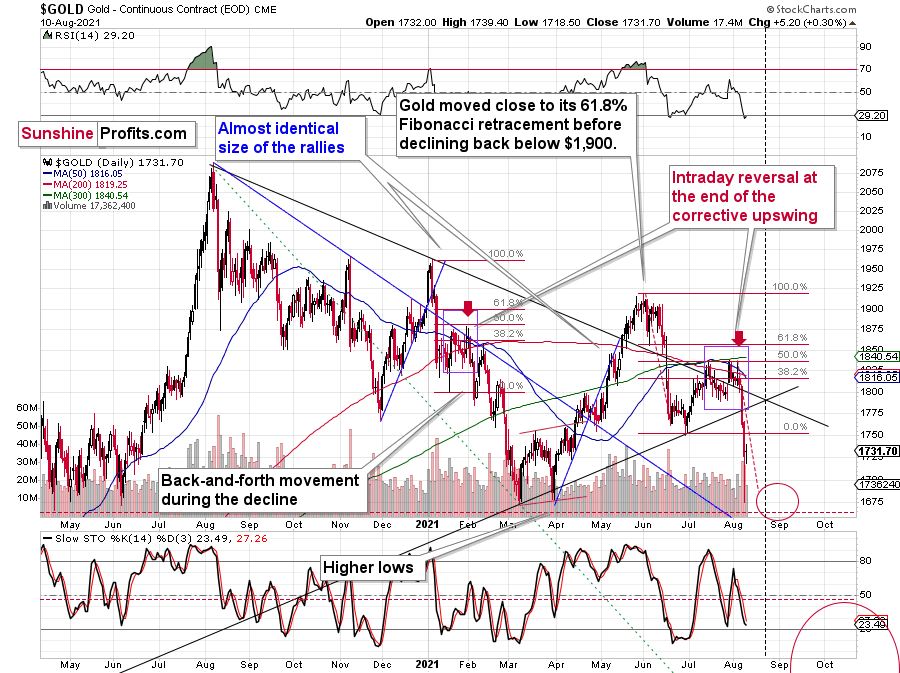
In fact, if gold moves back to the previously broken lows at about $1,750, it won’t invalidate the bearish narrative.
The Most Powerful Tool – Self-Similarity
Gold has a triangle-vertex-based reversal close to the end of the next week, which means that it could continue to consolidate or move a bit higher in the next several days, and then slide once again. Please note that this would make the current decline very similar in terms of its pace to the decline that we saw in June. While the moves don’t have to be identical, the gold price quite often moves in similar patterns – I’ve seen this many times in the past decade (and beyond). For example, please note how similar the short-term declines that we saw between August 2020 and December 2020 were.
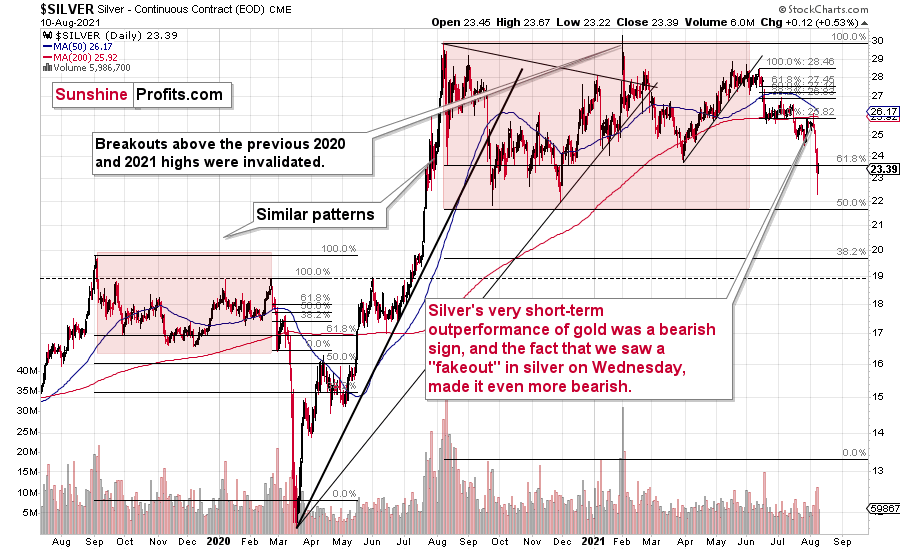
And while gold is consolidating after breaking below its June lows, the GDX is doing so after breaking below the neck level of the head-and-shoulders pattern and the GDXJ is trading sideways after breaking to new yearly lows, silver is also consolidating after a breakdown to new yearly lows.
Unless silver manages to soar back above the March lows shortly (and it seems unlikely that it does), it will be likely to fall profoundly once again soon.
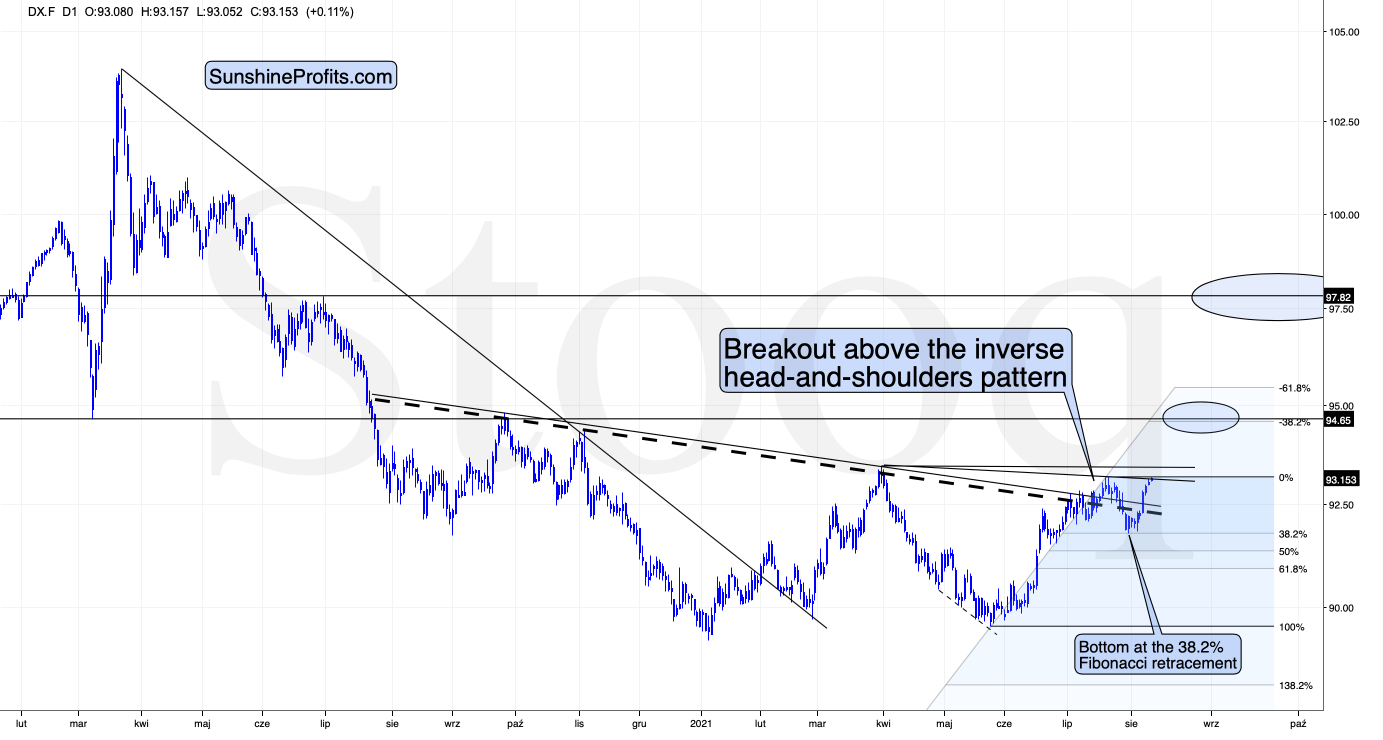
The inverse of the above is likely the USD Index, which is verifying its second attempt to break above its inverse head-and-shoulders pattern.
The August 2020 highs are the next short-term resistance for the USD Index, but I don’t expect it to decline significantly from there. Instead, it seems to me that the USDX will rally to almost 98 based on the inverse H&S pattern, and then it might consolidate.
So, while the USD Index and the precious metals market might consolidate for a few days (or even up to two weeks), they are likely to continue their most recent sizable moves shortly thereafter. Consequently, while I can’t make any promises with regard to the performance of any asset, it seems that the profits on the short positions in junior miners are going to increase substantially in the coming weeks.
Having said that, let’s take a look at the market from a more fundamental angle.
Rise Over Run
With the U.S. Consumer Price Index (CPI) scheduled for release today, the inflationary momentum remains on the up and up. And while inflation has taken a backseat to the impact of the U.S. nonfarm payrolls – as it relates to forecasting the U.S. Federal Reserve’s (FED) taper timeline – pricing pressures are likely to hang around much longer than investors expect.
To explain, I wrote previously:
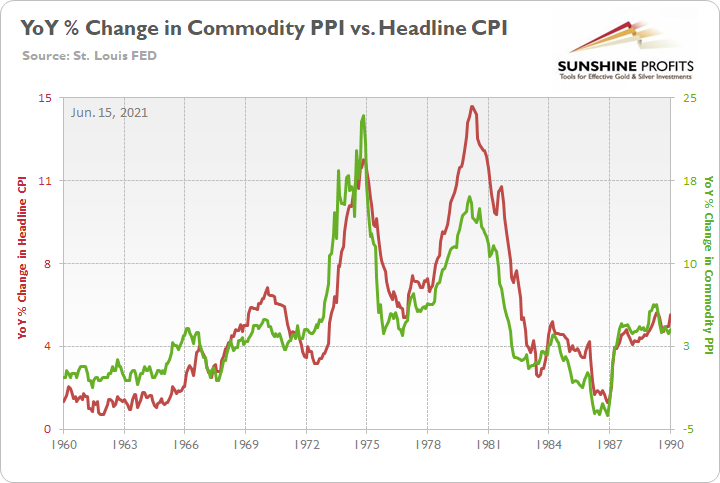
The commodity Producer Price Index (PPI) often leads the headline CPI and that’s why tracking its movement is so important. If we analyze the performance of the pair during the inflationary surges of the 1970s and the early 1980s, it’s clear that the relationship has stood the test of time.
Please see below:
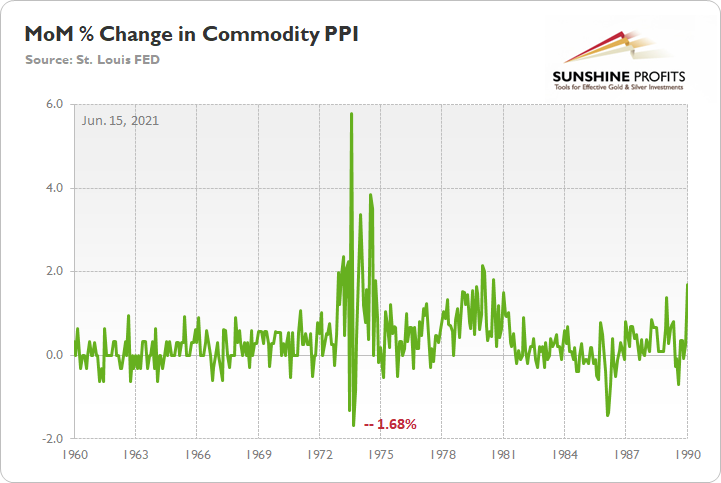
To explain, the green line above tracks the year-over-year (YoY) percentage change in the commodity PPI, while the red line above tracks the YoY percentage change in the headline CPI. If you analyze the relationship, you can see that the pair have a close connection. More importantly, though, during the historical inflationary downpour, the month-over-month (MoM) percentage change in the commodity PPI never declined by more than 1.68%.
Please see below:
To explain, the green line above tracks the MoM percentage change in the commodity PPI. And if you compare the two MoM spikes in the commodity PPI to the two YoY spikes in the first chart above (focus your attention on the highs between 1972-1975 and 1978-1981), you can see that MoM resiliency helped sustain the YoY surges. In addition, during the roughly nine-year bout of inflation, the commodity PPI dipped in-and-out of negative territory but never fell off of a cliff.
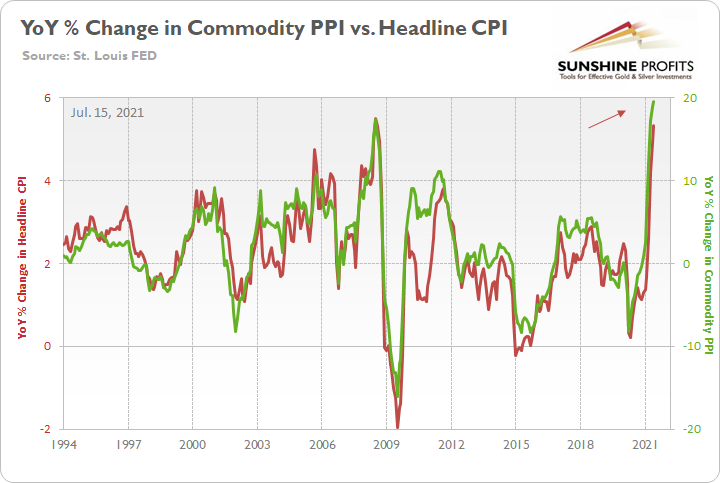
Now, if we circle back to the present, the YoY increase in the commodity PPI implies a headline CPI print of roughly 5.15% to 5.65% for July (when the data is released on Aug. 11).
Please see below:
Take My Money – I Want to Move In!
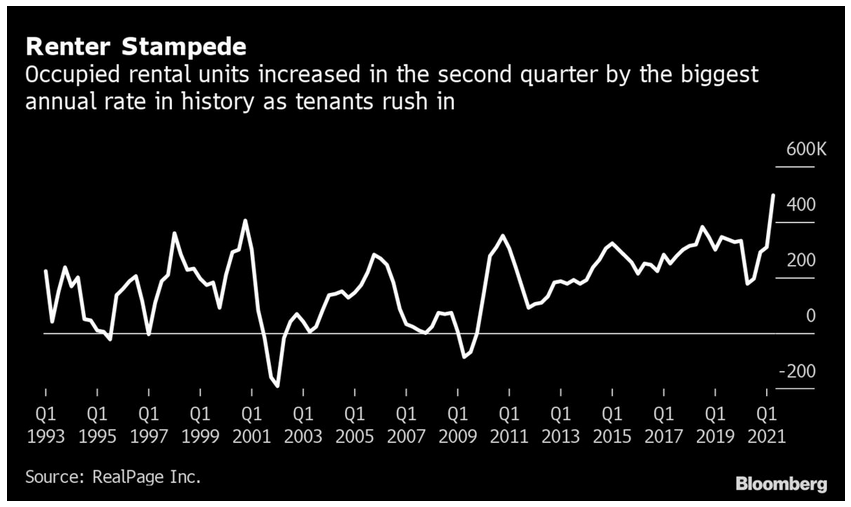
Thus, while economists have finally caught up to our estimates – with the consensus expecting a 5.3% YoY increase in the headline CPI today – the autumn months will likely generate even more upside surprises. Case in point: RealPage – a technology platform that serves over 19 million rental units worldwide – revealed that newly-signed leases surged a record 14.6% YoY in June and that occupancy rates hit 96.5% (matching the previous high set in 2000). For context, the Shelter CPI accounts for more than 30% of the movement of the headline CPI, and that’s why rent inflation is so important.
Please see below:
To that point, while the U.S. Centers for Disease Control and Prevention’s (CDC) extension of the eviction moratorium will likely delay rent inflation’s impact on the Shelter CPI, and therefore, the headline CPI, the rubber should still meet the road over the medium term. As evidence, Jay Parsons, deputy chief economist at RealPage, said the following:
“We’re seeing record-low vacancy. Wages are up, people have the money. And people are saying: take my money, I want to move in.”
As further evidence, Apartment List – an online marketplace for apartment listings – released its National Rent Report on Jul. 26. An excerpt read:
“The first half of 2021 has seen the fastest growth in rent prices since the start of our estimates in 2017. Our national rent index has increased by 11.4 percent since January. Prices are up by 10.3 percent compared to this time last year and up 9.4 percent compared to the pre-pandemic level from March 2020. The recent spike has now put actual rents well ahead of the trend they were on prior to the pandemic. The national median rent currently stands at $1,244, which is $44 greater than where we project it would be if rent growth over the past year and a half had been in line with the growth rates we saw in 2018 and 2019.”
Please see below:
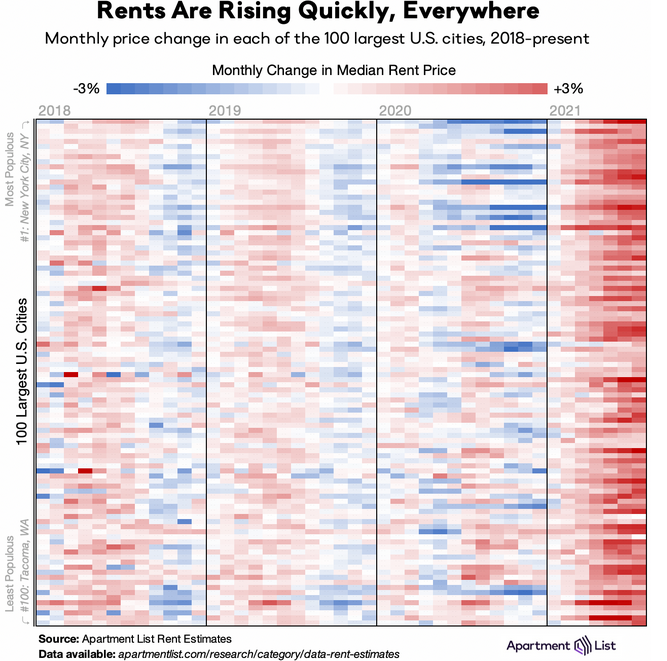
To explain, the heat map above tracks the MoM percentage change in rents across the 100 largest cities in the U.S. If you analyze the first three columns from the left (2018-2020), you can see that a mixture of red (hot) and blue (cold) was present, as some states experienced rent inflation, while others experienced rent deflation. Conversely, if you analyze the first column from the right (2021), you can see that the inflationary inferno has engulfed the majority of the U.S. Moreover, with many U.S. cities experiencing rent inflation in excess of 3% MoM, it’s important to remember that MoM readings eliminate “base effects” and that abnormally weak comparable periods are not responsible for the surge.
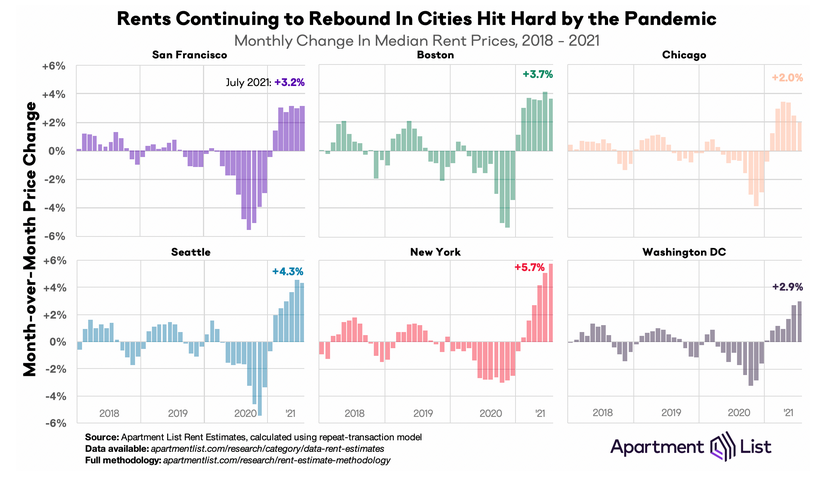
In addition, the report also revealed that “Monthly changes of +/- 2 percent are relatively rare under normal circumstances, but in 2020 and 2021 we have seen extended stretches where prices rise and fall at more than twice that rate.” And with the former grabbing the baton in 2021, U.S. cities that were hit the hardest by the pandemic are now experiencing rent inflation (MoM) that tracks well ahead of the Shelter CPI.
Please see below:
Small Businesses Struggle to Find Workers
If that wasn’t enough, the National Federation of Independent Business (NFIB) released its Small Business Optimism Index on Aug. 10. And while the headline index declined from 102.6 in June to 99.7 in July, small businesses’ inability to fill job openings (wage inflation) and supply chain disruptions (input inflation) are the main sources of the depressed sentiment. NFIB Chief Economist Bill Dunkelberg wrote:
“Small business owners are losing confidence in the strength of the economy and expect a slowdown in job creation. As owners look for qualified workers, they are also reporting that supply chain disruptions are having an impact on their businesses. Ultimately, owners could sell more if they could acquire more supplies and inventories from their supply chains.”
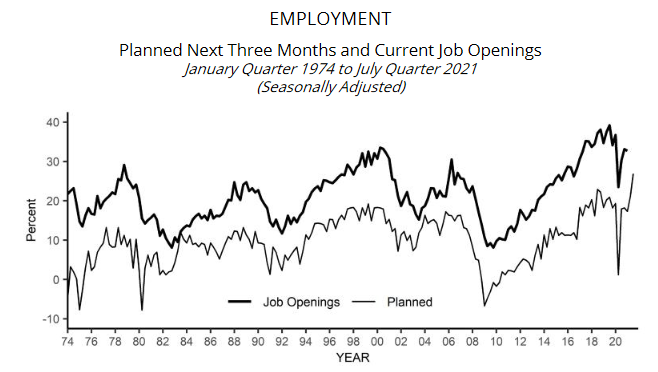
As for employment, “Unfilled job openings hit a 48-year record high” and finding qualified employees remains extremely problematic. Thus, while small businesses’ three-month planned employment hit another all-time high (the gray line below), increased competition for labor supports higher wage inflation over the medium term.
Please see below:
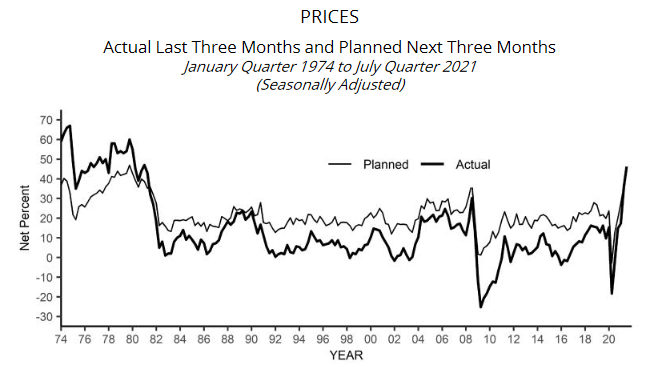
Likewise, with output inflation still at a ~40-year high, the NFIB’s indices for small businesses’ current prices and pricing plans remain at levels unseen since roughly 1980.
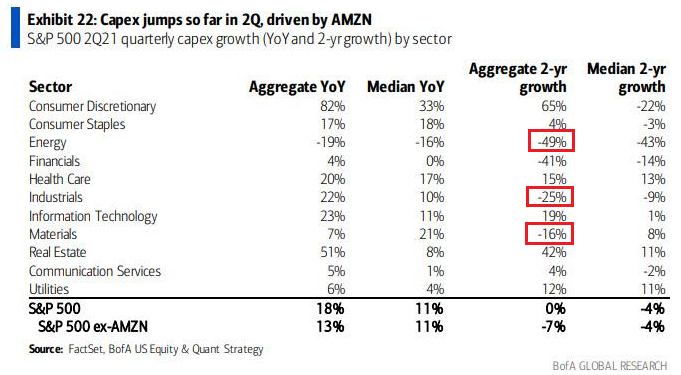
On top of that, with capital investments at all-time lows and producers still skittish over the wreckage that occurred during the global financial crisis (GFC), I warned on Jul. 22 that fresh commodities supply is not coming to the FED’s rescue. And with Bank of America revealing that capital expenditures in the energy (oil), industrials (equipment) and materials (mining) sectors have declined by 49%, 25% and 16% respectively on a two-year aggregate basis, S&P 500 companies’ capacity to increase production and reduce input inflation is simply not there.
Please see below:
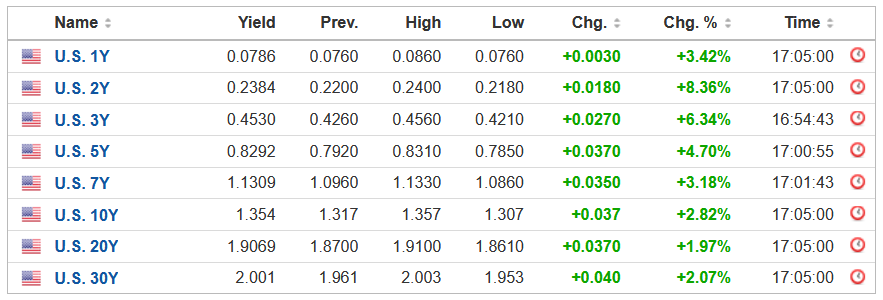
Finally, with U.S. Treasury yields surging once again on Aug. 10, the outperformance of U.S. nonfarm payrolls has uplifted the entire curve.
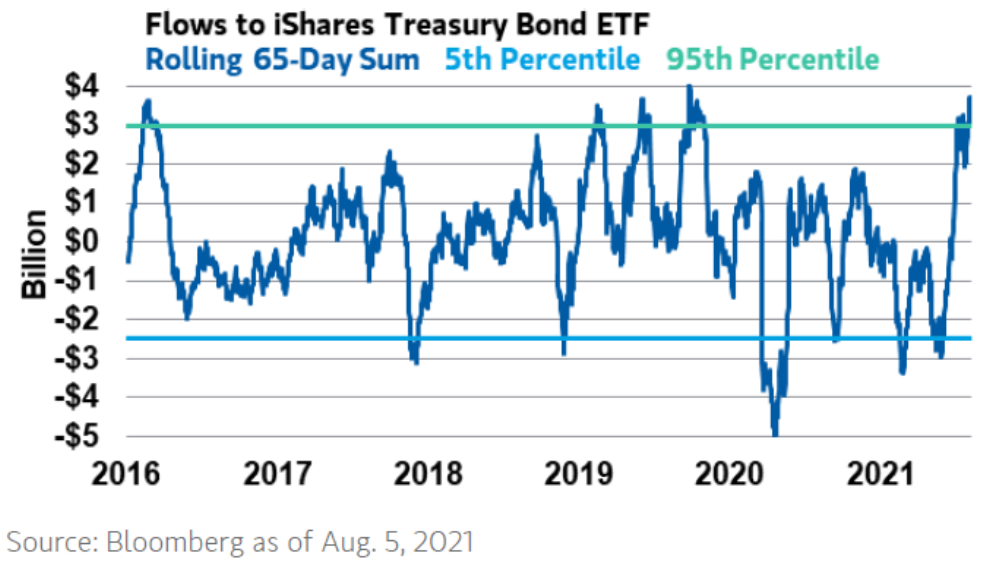
More importantly, though, investors’ positioning is still extremely stretched. For example, when the U.S. 10-Year Treasury yield hit 1.75%, an overabundance of shorts eventually led to a short-covering rally that sunk the yield back below 1.20% (remember, yields move inversely of prices). However, with the opposite dynamic in effect today, an overabundance of longs could lead to an unwinding that uplifts the U.S. 10-Year Treasury yield and drowns the PMs in the process.
Please see below:
To explain, the blue line above tracks the rolling 65-day fund flows into/out of the iShares U.S. Treasury Bond ETF (which benefits when interest rates decline). If you analyze the right side of the chart, you can see that positioning exceeded the 95th percentile (the horizontal green line at the top). Moreover, while the data was tallied on Aug. 5 and investors’ positioning has likely declined since the release of the U.S. nonfarm payrolls, the excessively high reading implies that an unwinding of long bond bets still has room to run.
In conclusion, gold mining stocks underperformed gold once again on Aug. 10 and the FED’s taper timeline has elicited severe trepidation. And with the USD Index recapturing 93 on Aug. 10 and the U.S. 10-Year Treasury yield up by 11% since the release of the U.S. nonfarm payrolls on Aug. 6, fundamental clouds are casting dark shadows over the PMs. As a result, while the outlook for the precious metals remains prosperous over the long term, sustainable optimism is unlikely to materialize over the next few months.
Overview of the Upcoming Part of the Decline
- The corrective upswing in gold is over, and the big decline seems to be already underway.
- After miners slide in a meaningful and volatile way, but silver doesn’t (and it just declines moderately), I plan to switch from short positions in miners to short positions in silver. At this time, it’s too early to say at what price levels this would take place – perhaps with gold close to $1,600. I plan to exit those short positions when gold shows substantial strength relative to the USD Index, while the latter is still rallying. This might take place with gold close to $1,350 - $1,500 and the entire decline (from above $1,900 to about $1,475) would be likely to take place within 6-20 weeks, and I would expect silver to fall the hardest in the final part of the move. This moment (when gold performs very strongly against the rallying USD and miners are strong relative to gold – after gold has already declined substantially) is likely to be the best entry point for long-term investments, in my view. This might also happen with gold close to $1,475, but it’s too early to say with certainty at this time.
- As a confirmation for the above, I will use the (upcoming or perhaps we have already seen it?) top in the general stock market as the starting point for the three-month countdown. The reason is that after the 1929 top, gold miners declined for about three months after the general stock market started to slide. We also saw some confirmations of this theory based on the analogy to 2008. All in all, the precious metals sector would be likely to bottom about three months after the general stock market tops.
- The above is based on the information available today, and it might change in the following days/weeks.
Please note that the above timing details are relatively broad and “for general overview only” – so that you know more or less what I think and how volatile I think the moves are likely to be – on an approximate basis. These time targets are not binding or clear enough for me to think that they should be used for purchasing options, warrants or similar instruments.
Gold / Silver Trade Info
In the previous weeks, I’ve been featuring a specific section in the description of my thoughts about one’s trading capital. It stated:
For-your-information targets (our opinion; we continue to think that mining stocks are the preferred way of taking advantage of the upcoming price move, but if for whatever reason one wants / has to use silver or gold for this trade, we are providing the details anyway.):
Silver futures upside profit-take exit price: unclear at this time - initially, it might be a good idea to exit when gold moves to $1,683
Gold futures upside profit-take exit price: $1,683
Now, since gold touched this level on Monday (Aug. 9), if one’s profits on the short positions in gold and/or silver were realized (congratulations!), I think that re-entering those positions is justified from the risk to reward point of view right now, with the same profit-take price. Naturally, I prefer to be shorting junior gold miners than gold or silver at this time, but if the reason due to which one couldn’t enter a short position in the junior miners is still intact, re-entering the short position in gold and/or silver would be justified from the risk to reward point of view (at least in my view).
Summary
To summarize, the corrective upswing in gold is over, and it seems that the big downswing in gold, silver, and mining stocks is already underway. While the next few days may (!) bring some back-and-forth action instead of the decline’s continuation, it’s unlikely that this will take place for long. Based on the self-similar pattern in gold (similarity is mostly to the 2011-2013 period), gold is likely to decline to its previous 2021 lows relatively soon, even if it doesn’t happen right away. Based on the analogies to the recent past, it seems quite likely that gold will move lower in the following days and bottom in the second half of August.
It seems that our profits on the short position in the junior mining stocks are going to grow substantially in the following weeks.
After the sell-off (that takes gold to about $1,350 - $1,500), I expect the precious metals to rally significantly. The final part of the decline might take as little as 1-5 weeks, so it's important to stay alert to any changes.
Most importantly, please stay healthy and safe. We made a lot of money last March and this March, and it seems that we’re about to make much more on the upcoming decline, but you have to be healthy to enjoy the results.
As always, we'll keep you - our subscribers - informed.
To summarize:
Trading capital (supplementary part of the portfolio; our opinion): Full speculative short positions (300% of the full position) in mining stocks are justified from the risk to reward point of view with the following binding exit profit-take price levels:
Mining stocks (price levels for the GDXJ ETF): binding profit-take exit price: $37.12; stop-loss: none (the volatility is too big to justify a stop-loss order in case of this particular trade)
Alternatively, if one seeks leverage, we’re providing the binding profit-take levels for the JDST (2x leveraged) and GDXD (3x leveraged – which is not suggested for most traders/investors due to the significant leverage). The binding profit-take level for the JDST: $15.96; stop-loss for the JDST: none (the volatility is too big to justify a SL order in case of this particular trade); binding profit-take level for the GDXD: $37.02; stop-loss for the GDXD: none (the volatility is too big to justify a SL order in case of this particular trade).
For-your-information targets (our opinion; we continue to think that mining stocks are the preferred way of taking advantage of the upcoming price move, but if for whatever reason one wants / has to use silver or gold for this trade, we are providing the details anyway.):
Silver futures upside profit-take exit price: unclear at this time - initially, it might be a good idea to exit, when gold moves to $1,683
Gold futures upside profit-take exit price: $1,683
HGD.TO – alternative (Canadian) inverse 2x leveraged gold stocks ETF – the upside profit-take exit price: $12.88
Long-term capital (core part of the portfolio; our opinion): No positions (in other words: cash
Insurance capital (core part of the portfolio; our opinion): Full position
Whether you already subscribed or not, we encourage you to find out how to make the most of our alerts and read our replies to the most common alert-and-gold-trading-related-questions.
Please note that we describe the situation for the day that the alert is posted in the trading section. In other words, if we are writing about a speculative position, it means that it is up-to-date on the day it was posted. We are also featuring the initial target prices to decide whether keeping a position on a given day is in tune with your approach (some moves are too small for medium-term traders, and some might appear too big for day-traders).
Additionally, you might want to read why our stop-loss orders are usually relatively far from the current price.
Please note that a full position doesn't mean using all of the capital for a given trade. You will find details on our thoughts on gold portfolio structuring in the Key Insights section on our website.
As a reminder - "initial target price" means exactly that - an "initial" one. It's not a price level at which we suggest closing positions. If this becomes the case (like it did in the previous trade), we will refer to these levels as levels of exit orders (exactly as we've done previously). Stop-loss levels, however, are naturally not "initial", but something that, in our opinion, might be entered as an order.
Since it is impossible to synchronize target prices and stop-loss levels for all the ETFs and ETNs with the main markets that we provide these levels for (gold, silver and mining stocks - the GDX ETF), the stop-loss levels and target prices for other ETNs and ETF (among other: UGL, GLL, AGQ, ZSL, NUGT, DUST, JNUG, JDST) are provided as supplementary, and not as "final". This means that if a stop-loss or a target level is reached for any of the "additional instruments" (GLL for instance), but not for the "main instrument" (gold in this case), we will view positions in both gold and GLL as still open and the stop-loss for GLL would have to be moved lower. On the other hand, if gold moves to a stop-loss level but GLL doesn't, then we will view both positions (in gold and GLL) as closed. In other words, since it's not possible to be 100% certain that each related instrument moves to a given level when the underlying instrument does, we can't provide levels that would be binding. The levels that we do provide are our best estimate of the levels that will correspond to the levels in the underlying assets, but it will be the underlying assets that one will need to focus on regarding the signs pointing to closing a given position or keeping it open. We might adjust the levels in the "additional instruments" without adjusting the levels in the "main instruments", which will simply mean that we have improved our estimation of these levels, not that we changed our outlook on the markets. We are already working on a tool that would update these levels daily for the most popular ETFs, ETNs and individual mining stocks.
Our preferred ways to invest in and to trade gold along with the reasoning can be found in the how to buy gold section. Furthermore, our preferred ETFs and ETNs can be found in our Gold & Silver ETF Ranking.
As a reminder, Gold & Silver Trading Alerts are posted before or on each trading day (we usually post them before the opening bell, but we don't promise doing that each day). If there's anything urgent, we will send you an additional small alert before posting the main one.
Thank you.
Przemyslaw Radomski, CFA
Founder, Editor-in-chief


