

Briefly: in our opinion, full (300% of the regular position size) speculative short positions in junior mining stocks are justified from the risk/reward point of view at the moment of publishing this Alert.
“Everything that has a beginning has an end.”
– The Oracle in Matrix Revolutions, 2003
The counter-trend rally has probably just ended, and the final big downswing has probably just started. This “beginning” of the final downswing is, in my opinion, the beginning of the final part of the prolonged sideways trend in gold that started in 2011. In the case of silver and mining stocks, that’s likely the final part of the decline that started back then.
These are strong words – I know. Let’s see if I can back them up.
First of all, I’ve been writing about the analogy between 2013 and now for many weeks now, and you can read about these analogies in this week’s flagship analysis. This key link remains intact. The charts given below confirm that from the short-term point of view.
In yesterday’s analysis, I commented on them in the following way:
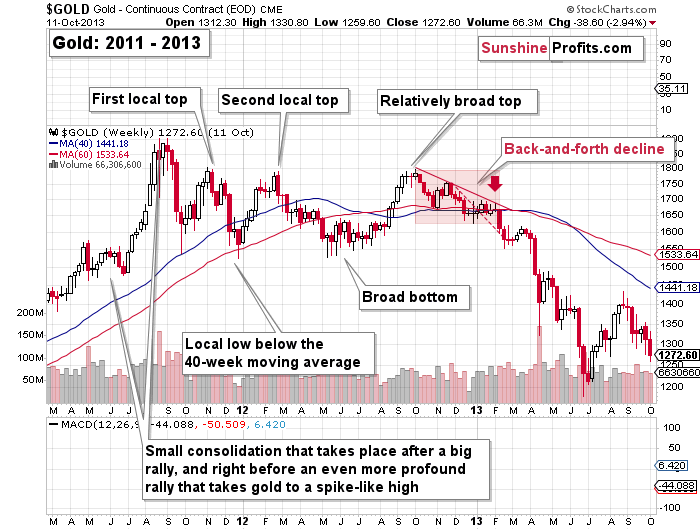
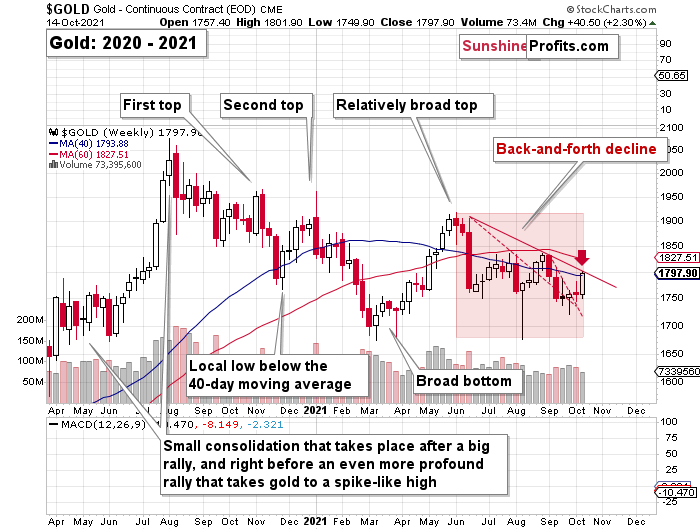
Gold jumped to its 40-week moving average and to the declining red line based on the previous short-term highs. Let’s check the context – what happened in 2013?
Right before moving to its previous medium-term lows, gold moved to its declining red resistance line that was also very close to its 40-week moving average. I marked this situation with a red arrow on both charts.
As you can see, nothing changed. The link between 2013 and now remains completely intact and its implications remain very bearish.
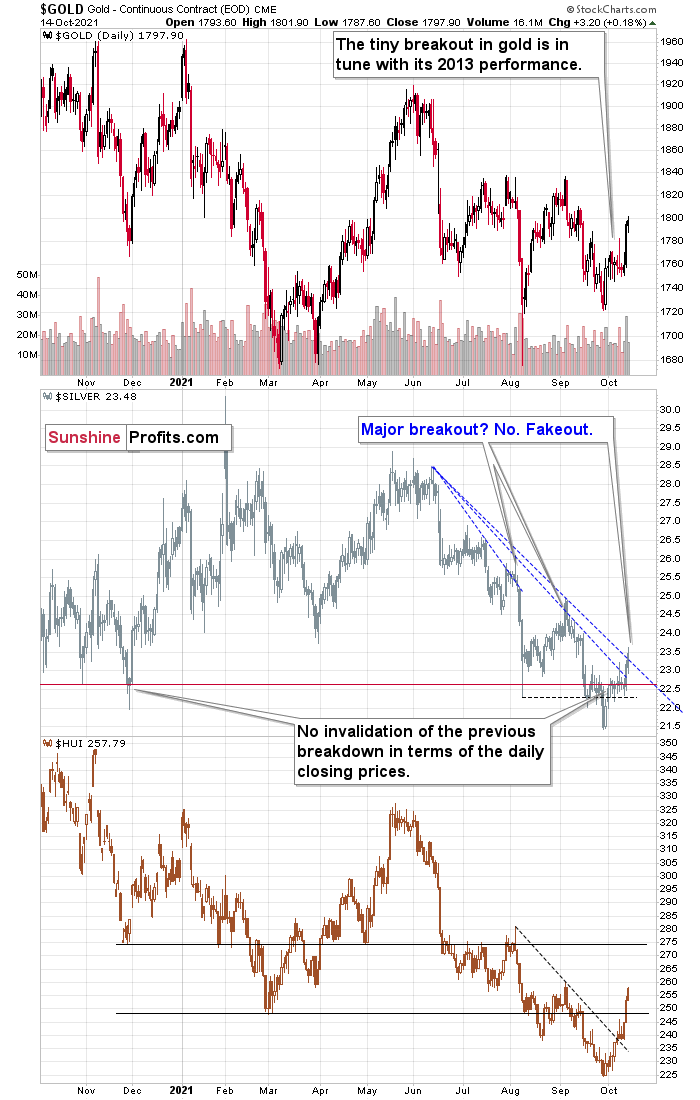
On a very short-term basis (yesterday’s session), silver outperformed gold and moved above its declining resistance line.
While gold moved higher by 0.18%, silver moved higher by 1.32%. I wrote this numerous times, and I’m going to write about this again today – silver’s very short-term outperformance of gold is not a bullish sign but a bearish one, and being aware of that is one of the more useful gold trading tips.
As far as silver’s “breakout” is concerned, it’s nothing bullish either. When you look at the August top, you’ll see that it also happened after a small, short-term breakout. The same with the early-September high. We’re seeing the same thing once again, and the implications are, once again, bearish.
On the bottom part of the above chart, you can see the HUI Index – a proxy for gold stocks. It moved notably higher recently, and it even moved above its March low, but it’s still far from its November 2020 low. So, taking a broader point of view, gold stocks are still the weakest part of the precious metals sector right now.
Moreover, please note that gold failed to hold its tiny move back above $1,800 – it was quickly invalidated. At the moment of writing these words, gold is trading at about $1,785.
Also, speaking of mining stocks, let’s take a look at what the juniors did.
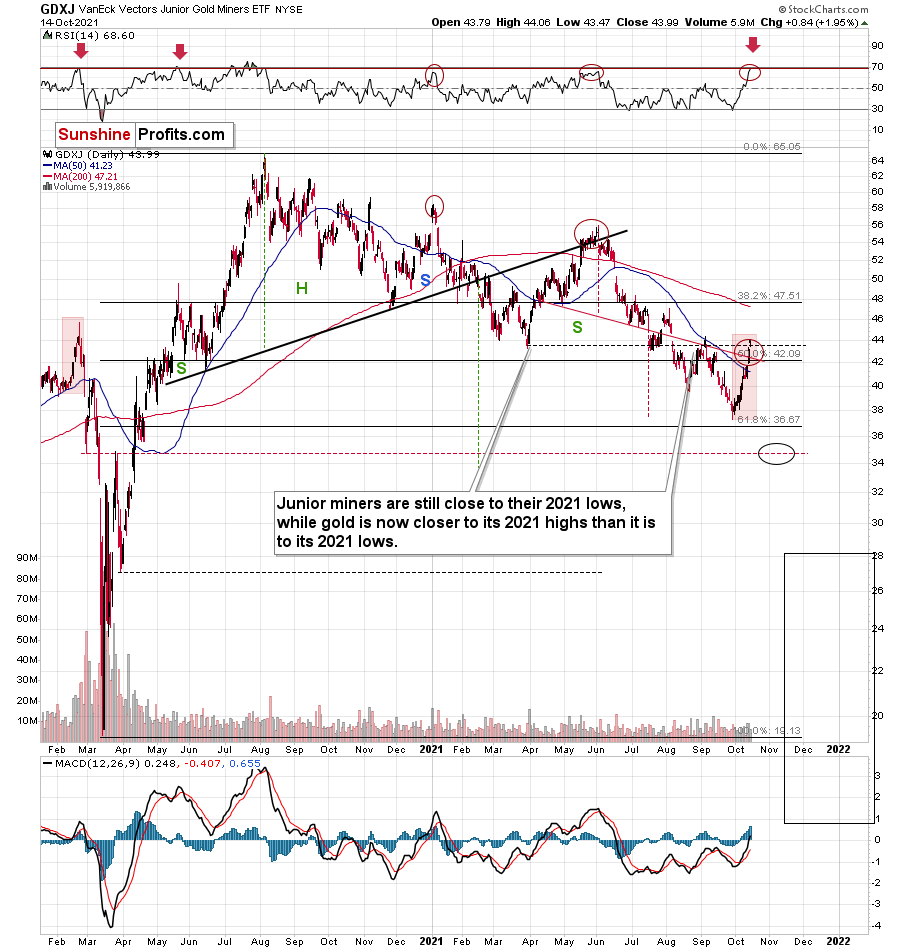
They rallied profoundly, which by itself might not be the most exciting thing you read today, especially given our short positions in them (let’s keep in mind that we took profits from the previous short position in the junior miners on Sep. 28, just one day before the bottom), but it is quite interesting when you consider how high the RSI is right now, and when in the past both the RSI and the GDXJ itself were trading at today’s levels.
That was in late February 2020. Back then, juniors were after a short-term rally from below $40, and they topped above $44. The RSI approached 70 — just like what we see today. And then the GDXJ declined below $20 in less than a month. I think the decline will take place longer this time, but the outlook is still extremely bearish.
By the way, the last time when the RSI was as high as it is right now was… right at the 2020 top. That’s yet another indication for gold that signals that the top is in or at hand.
But why shouldn’t gold, silver, and mining stocks rally even higher before turning south? Not only are they overbought on their own, but they actually have a good reason to reverse, which is coming from the USD Index.
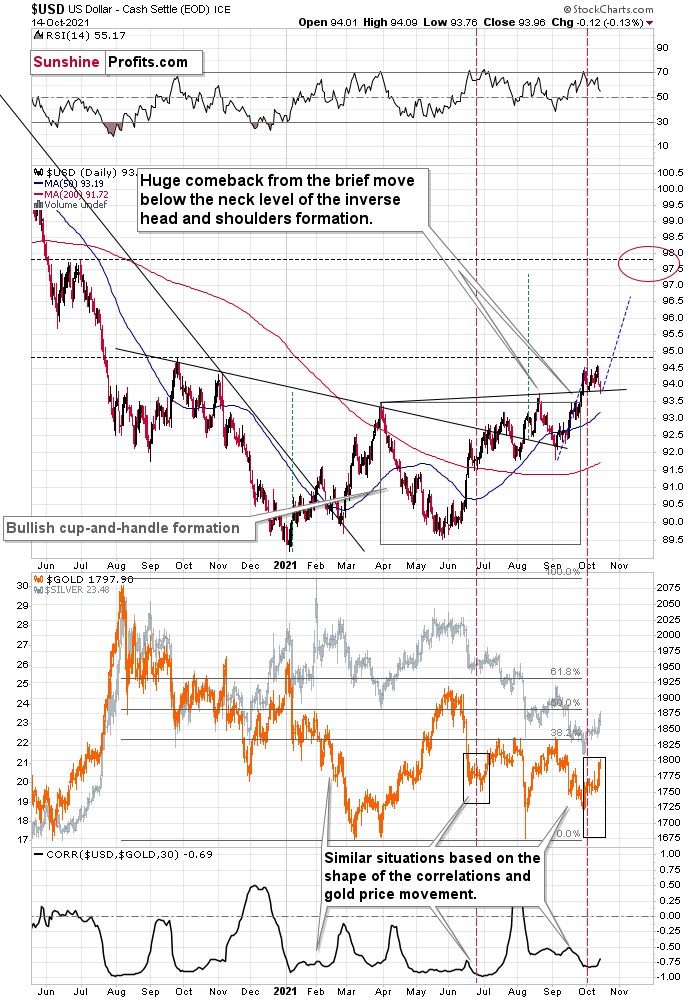
The USD Index moved back to its previous 2021 lows and its rising support line, and then it moved back up. It’s also been moving higher in today’s pre-market trading.
This tells us that the corrective flag pattern might already be over and – since the support held – the next move higher is quite likely just about to start, or it’s already underway.
Even though the USD’s move higher is so far very tiny, gold and silver are down by about 0.5% today. Is the top in the PMs in? This seems quite likely to me. What we see right now – especially in light of the analogy to Feb. 2020 in the GDXJ – does indeed look like the beginning of the end.
Having said that, let’s move to the more fundamental side of things.
Fade the Fed
With the USD Index under pressure in recent days, risk-on sentiment has returned to the financial markets. And with the Fed’s taper timeline now the worst-kept secret, the new narrative is that ‘inflation is not “transitory,” though, it will dissipate on its own.’
To explain, with a November taper announcement seemingly a done deal, investors have rejoiced over the idea that the Fed won’t raise interest rates anytime soon. And with Oxford Economics supporting the thesis – by projecting that the headline Consumer Price Index (CPI) will decelerate sharply in the coming months – all’s well that ends well.
Please see below:
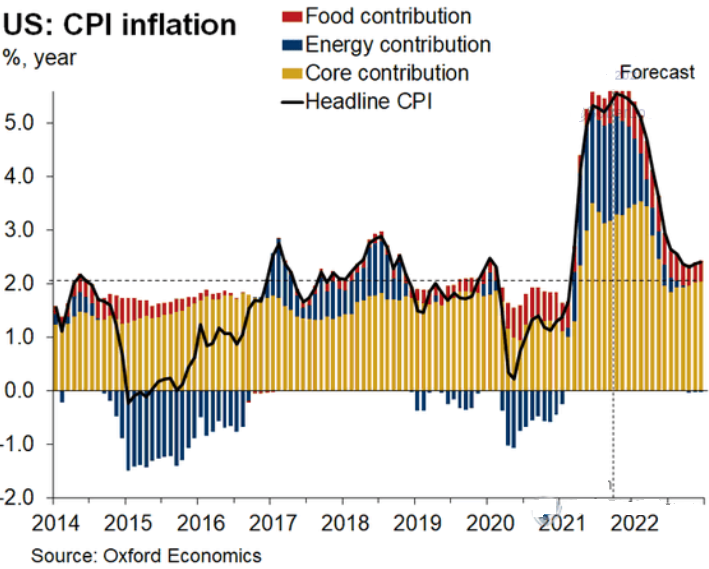
To explain, the black line above tracks the headline CPI, while the gold, blue and red bars above track the headline CPI’s various components. If you analyze the right side of the chart, you can see that Oxford Economics expects annual inflation to fall below 5% by February 2022 and suffer a rapid decline thereafter.
However, while everyone searches far and wide for the peak, inflation is unlikely to slow down anytime soon. For example, the U.S. Bureau of Labor Statistics (BLS) released the Commodity Producer Price Index (PPI) on Oct. 14. And after the index increased by 20.41% year-over-year (YoY) – a new 2021 high – the data implies another headline CPI print of roughly 5.25% to 5.75% when the data is released on Nov. 10.
Please see below:
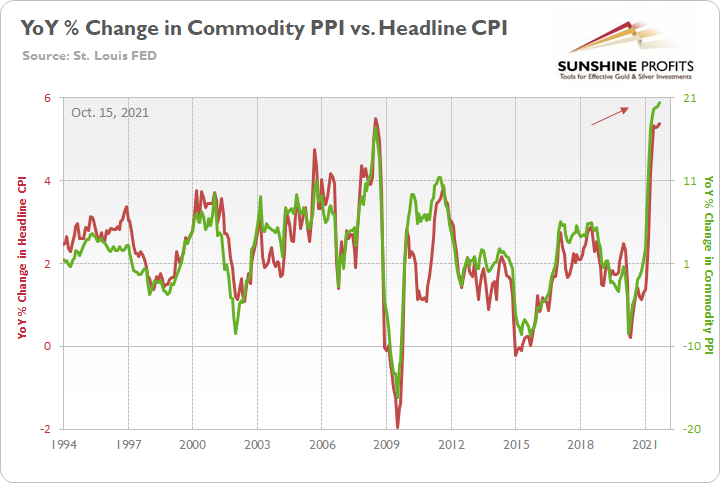
To explain, the green line above tracks the YoY percentage change in the commodity PPI, while the red line above tracks the YoY percentage change in the headline CPI. If you analyze the relationship, you can see that the pair have a close connection.
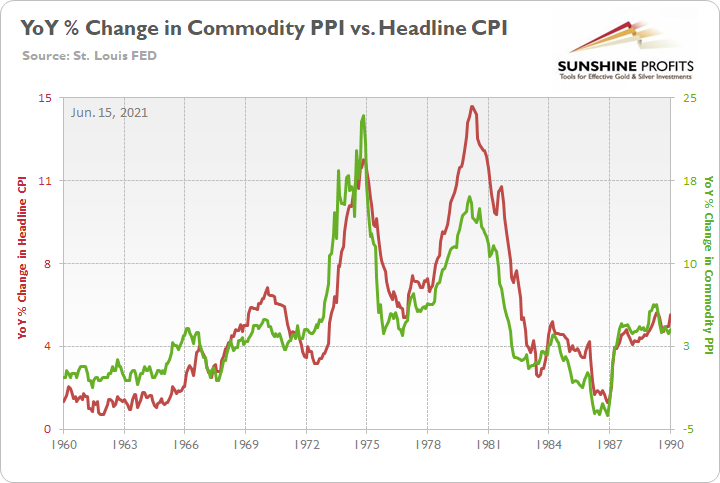
Even more relevant, the commodity PPI increased by 1.07% month-over-month (MoM). And with the 2021 data following the script from the 1970s, prophecies of inflation’s death are extremely premature. To explain, I wrote on Jun. 15:
The commodity PPI often leads the headline CPI and that’s why tracking its movement is so important. If we analyze the performance of the pair during the inflationary surges of the 1970s and the early 1980s, it’s clear that the relationship has stood the test of time.
Please see below:
More importantly, though, during the historical inflationary downpour, the MoM percentage change in the commodity PPI never declined by more than 1.68%.
Please see below:
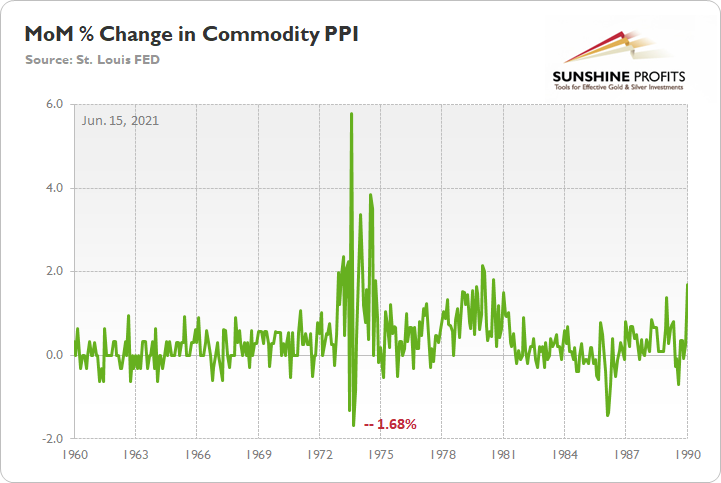
To explain, the green line above tracks the MoM percentage change in the commodity PPI. And if you compare the two MoM spikes in the commodity PPI to the two YoY spikes in the first chart above (focus your attention on the highs between 1972-1975 and 1978-1981), you can see that MoM resiliency helped sustain the YoY surges. In addition, during the roughly nine-year bout of inflation, the commodity PPI dipped in-and-out of negative territory but never fell off of a cliff.
To that point, with the commodity PPI still rising MoM, the inflationary fire is still spreading. Moreover, with the S&P Goldman Sachs Commodity Index (S&P GSCI) closing at another 2021 high on Oct. 14, the index is now up by more than 5% so far in October. And with the ascent likely to influence the commodity PPI when October’s data is released in November, a risk-on sentiment only exacerbates the Fed’s inflationary problem.
For context, the S&P GSCI contains 24 commodities from all sectors: six energy products, five industrial metals, eight agricultural products, three livestock products and two precious metals. However, energy accounts for roughly 54% of the index’s movement.
What Do Others Say About Inflation?
And referencing reality, Domino’s Pizza – the largest pizza chain in the U.S. – released its third-quarter earnings on Oct. 14. Domino’s CEO Ritch Allison said that “we expect inflationary headwinds to continue impacting Domino's and the broader restaurant industry over the coming quarters….
“As we look forward into 2022, there are cost pressures across the business as you highlight both on the labor side but also inflationary pressures as it relates to commodities as well. So we're taking all of those things into account as we think about what our pricing looks like in 2022.”
Singing a similar tune, BlackRock released its third-quarter earnings on Oct. 13. CEO Larry Fink – who heads the world’s largest asset manager – said that “inflationary trends are appearing more than transitory, reflecting structural changes, including a shift from consumerism to job creation, rising wage growth and the energy transition.”
Continuing the theme, during the company’s third-quarter earnings call on Oct. 13, JPMorgan CEO Jamie Dimon – who heads the largest bank in the U.S. – said that “first of all, you have [core] inflation. It's 4%. It's been 4% now for the better part of a couple of quarters.
“And, in my view, unlikely to be lower than that next quarter or the quarter after that…. And of course, we prepare for probabilities and eventualities. And one of those probabilities is that it might go higher than people think, that [the Fed will] have to tamp down.” However, he added that “I doubt that will happen before late 2022.”
Also sounding the inflationary alarm, Goldman Sachs President John Waldron – the top deputy to CEO David Solomon – said on Oct. 13 that “most CEOs I talk to today are very concerned about [the] supply chain, very concerned about import costs, whether they’re materials, commodities and increasingly labor.”
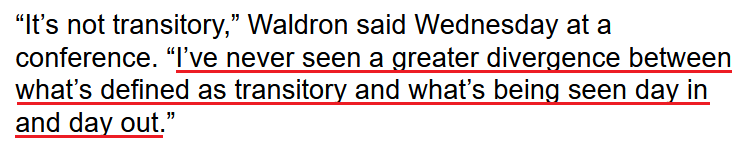 Source: Bloomberg
Turning it up a notch, Morgan Stanley CEO James Gorman said on Oct. 14 that “I think the market has digested that the Fed will have to move, not just on tapering, but rate increases. And by the way, we are 10 rate increases away from what would be considered normal.”
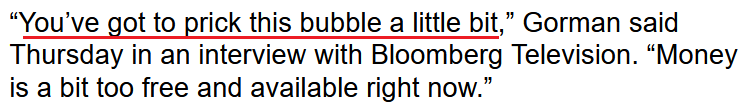 Source: Bloomberg
And why does all of this impact the performance of the PMs?
Not Nearly Hawkish Enough
Well, with the Fed still materially behind the inflation curve, the central bank’s hawkish shift isn’t nearly hawkish enough. For example, when the Fed cited “base effects” and defined inflation as “transitory,” the group expected QE to remain on autopilot for the majority of 2022. However, similar to how surging inflation led to two upward revisions (in six months) of the Fed’s headline PCE Index projection, the central bank still expects 2.2% annual inflation in 2022. However, with the estimate likely wishful thinking, the Fed will likely have to accelerate its liquidity drain and/or raise interest rates for inflation to fall anywhere near its 2022 target.
As evidence, I’ve mentioned on several occasions that the Fed needs to strengthen the U.S. dollar to help calm inflation (it won’t completely solve the problem, but it will help). And amid the USD Index’s recent pullback, copper prices have surged by nearly 8% this week (four days) as of the Oct. 14 close. Moreover, WTI is up by nearly 3% so far this week and is on track for its eighth-straight week of weekly gains. Thus, more of the same will only add upward pressure to the commodity PPI and the headline CPI. And with that, the cost-push inflationary spiral will likely accelerate.
However, while the PMs have benefited from this week’s commodities free-for-all, November 2/3 should begin the next chapter in the Fed’s seismic shift. To explain, Richmond Fed President Tom Barkin said on Oct. 14 that “we still have a lot to learn about whether recent inflation levels will be sustained and how much room we have to run in the labor market until we get to maximum employment.” But citing the hawkish FOMC minutes released on Oct. 13, he admitted that the death knell has rung for QE:
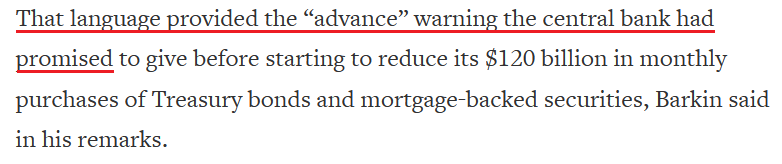 Source: Reuters
What’s more, while the Fed’s hawkish rhetoric has accelerated in recent months, the shifting language likely has more room to run.
Please see below:
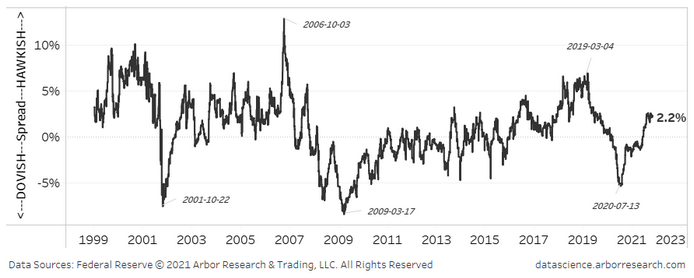
To explain, the black line above tracks the Fed’s hawkish-dovish language spread. For context, when the black line is rising, it means that hawkish language is dominating, and when the black line is falling, it means that dovish language is dominating. If you analyze the right side of the chart, you can see that hawk talk has taken the lead. However, with the current reading still well below the highs set in 2006 and from 2017-2019 – even though inflation is at or above the levels realized during those periods – the Fed should set off more hawkish fireworks in the coming months.
The bottom line? While the PMs have benefited from the shifting mood music, the fundamentals remain unchanged: inflation is hot and the Fed’s anxiety is growing. And with sticky inflation poised to remain buoyant longer than the Fed expects, the central bank’s dovish stance on raising interest rates may prove “transitory” as well.
In conclusion, the PMs rallied on Oct. 14, as animal spirits returned to the financial markets. However, with investors misreading the tea leaves, the Fed’s accelerated (likely) taper timeline may prove more problematic than many expect. Moreover, the liquidity divergence between the Fed and the ECB is profoundly bearish for the EUR/USD. As a result, while sentiment has ruled the week, fundamentals will likely rule the coming months.
Overview of the Upcoming Part of the Decline
- It seems to me that the current corrective upswing in gold is over, and the next short-term move lower is about to begin. Since it seems to be another short-term move more than it seems to be a continuation of the bigger decline, I think that junior miners would be likely to (at least initially) decline more than silver.
- It seems that the first stop for gold will be close to its previous 2021 lows, slightly below $1,700. Then it will likely correct a bit, but it’s unclear if I want to exit or reverse the current short position based on that – it depends on the number and the nature of the bullish indications that we get at that time. Before the next big slide, I will likely prefer to get back to the short position in the junior mining stocks.
- After the above-mentioned correction, we’re likely to see a powerful slide, perhaps close to the 2020 low ($1,450 - $1,500).
- If we see a situation where miners slide in a meaningful and volatile way while silver doesn’t (it just declines moderately), I plan to – once again – switch from short positions in miners to short positions in silver. At this time, it’s too early to say at what price levels this could take place, and if we get this kind of opportunity at all – perhaps with gold close to $1,600.
- I plan to exit all remaining short positions when gold shows substantial strength relative to the USD Index while the latter is still rallying. This might take place with gold close to $1,350 - $1,400. I expect silver to fall the hardest in the final part of the move. This moment (when gold performs very strongly against the rallying USD and miners are strong relative to gold after its substantial decline) is likely to be the best entry point for long-term investments, in my view. This might also happen with gold close to $1,375, but it’s too early to say with certainty at this time. I expect the final bottom to take place near the end of the year, perhaps in mid-December.
- As a confirmation for the above, I will use the (upcoming or perhaps we have already seen it?) top in the general stock market as the starting point for the three-month countdown. The reason is that after the 1929 top, gold miners declined for about three months after the general stock market started to slide. We also saw some confirmations of this theory based on the analogy to 2008. All in all, the precious metals sector is likely to bottom about three months after the general stock market tops.
- The above is based on the information available today, and it might change in the following days/weeks.
You will find my general overview of the outlook for gold on the chart below:
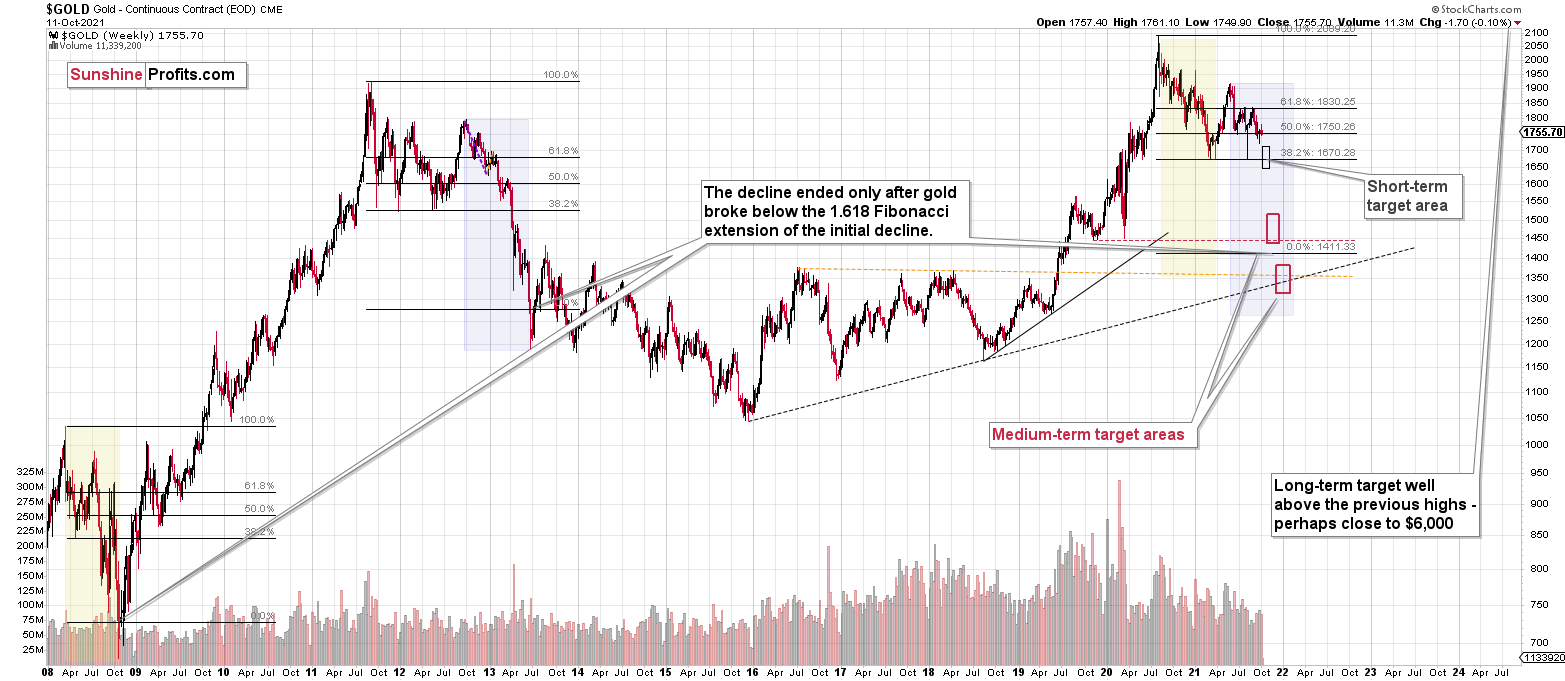
Please note that the above timing details are relatively broad and “for general overview only” – so that you know more or less what I think and how volatile I think the moves are likely to be – on an approximate basis. These time targets are not binding or clear enough for me to think that they should be used for purchasing options, warrants or similar instruments.
Summary
To summarize, the outlook for the precious metals sector remains extremely bearish for the next few months. Since it seems that the PMs are starting another short-term move lower more than it seems that they are continuing their bigger decline, I think that junior miners would be likely to (at least initially) decline more than silver.
Since juniors have rallied more than silver recently, the recent switch helped us get an extra percent on this trade. Of course, exiting the short position at the short-term bottom and re-entering it now would have been better in dollar terms, but given the enormous strength of the downtrend, exiting the short position completely would have been too risky, in my view. So, it seems that we actually made the most of this corrective upswing from the risk to reward point of view, as we never risked missing out on the big downswing if it had happened, and we saved some capital anyway. And now we can move back to the asset that rallied more and is likely to decline more in the short term.
From the medium-term point of view, the key two long-term factors remain the analogy to 2013 in gold and the broad head and shoulders pattern in the HUI Index. They both suggest much lower prices ahead.
It seems that our profits from the short positions are going to become truly epic in the following months.
After the sell-off (that takes gold to about $1,350 - $1,500), I expect the precious metals to rally significantly. The final part of the decline might take as little as 1-5 weeks, so it's important to stay alert to any changes.
Most importantly, please stay healthy and safe. We made a lot of money last March and this March, and it seems that we’re about to make much more on the upcoming decline, but you have to be healthy to enjoy the results.
As always, we'll keep you - our subscribers - informed.
By the way, we’re currently providing you with the possibility to extend your subscription by a year, two years or even three years with a special 20% discount. This discount can be applied right away, without the need to wait for your next renewal – if you choose to secure your premium access and complete the payment upfront. The boring time in the PMs is definitely over, and the time to pay close attention to the market is here. Naturally, it’s your capital, and the choice is up to you, but it seems that it might be a good idea to secure more premium access now while saving 20% at the same time. Our support team will be happy to assist you in the above-described upgrade at preferential terms – if you’d like to proceed, please contact us.
To summarize:
Trading capital (supplementary part of the portfolio; our opinion): Full speculative short positions (300% of the full position) in junior mining stocks are justified from the risk to reward point of view with the following binding exit profit-take price levels:
Mining stocks (price levels for the GDXJ ETF): binding profit-take exit price: $35.73; stop-loss: none (the volatility is too big to justify a stop-loss order in case of this particular trade)
Alternatively, if one seeks leverage, we’re providing the binding profit-take levels for the JDST (2x leveraged) and GDXD (3x leveraged – which is not suggested for most traders/investors due to the significant leverage). The binding profit-take level for the JDST: $16.18; stop-loss for the JDST: none (the volatility is too big to justify a SL order in case of this particular trade); binding profit-take level for the GDXD: $32.08; stop-loss for the GDXD: none (the volatility is too big to justify a SL order in case of this particular trade).
For-your-information targets (our opinion; we continue to think that mining stocks are the preferred way of taking advantage of the upcoming price move, but if for whatever reason one wants / has to use silver or gold for this trade, we are providing the details anyway.):
Silver futures downside profit-take exit price: $19.12
SLV profit-take exit price: $17.72
ZSL profit-take exit price: $41.38
Gold futures downside profit-take exit price: $1,683
HGD.TO – alternative (Canadian) inverse 2x leveraged gold stocks ETF – the upside profit-take exit price: $12.48
Long-term capital (core part of the portfolio; our opinion): No positions (in other words: cash
Insurance capital (core part of the portfolio; our opinion): Full position
Whether you already subscribed or not, we encourage you to find out how to make the most of our alerts and read our replies to the most common alert-and-gold-trading-related-questions.
Please note that we describe the situation for the day that the alert is posted in the trading section. In other words, if we are writing about a speculative position, it means that it is up-to-date on the day it was posted. We are also featuring the initial target prices to decide whether keeping a position on a given day is in tune with your approach (some moves are too small for medium-term traders, and some might appear too big for day-traders).
Additionally, you might want to read why our stop-loss orders are usually relatively far from the current price.
Please note that a full position doesn't mean using all of the capital for a given trade. You will find details on our thoughts on gold portfolio structuring in the Key Insights section on our website.
As a reminder - "initial target price" means exactly that - an "initial" one. It's not a price level at which we suggest closing positions. If this becomes the case (like it did in the previous trade), we will refer to these levels as levels of exit orders (exactly as we've done previously). Stop-loss levels, however, are naturally not "initial", but something that, in our opinion, might be entered as an order.
Since it is impossible to synchronize target prices and stop-loss levels for all the ETFs and ETNs with the main markets that we provide these levels for (gold, silver and mining stocks - the GDX ETF), the stop-loss levels and target prices for other ETNs and ETF (among other: UGL, GLL, AGQ, ZSL, NUGT, DUST, JNUG, JDST) are provided as supplementary, and not as "final". This means that if a stop-loss or a target level is reached for any of the "additional instruments" (GLL for instance), but not for the "main instrument" (gold in this case), we will view positions in both gold and GLL as still open and the stop-loss for GLL would have to be moved lower. On the other hand, if gold moves to a stop-loss level but GLL doesn't, then we will view both positions (in gold and GLL) as closed. In other words, since it's not possible to be 100% certain that each related instrument moves to a given level when the underlying instrument does, we can't provide levels that would be binding. The levels that we do provide are our best estimate of the levels that will correspond to the levels in the underlying assets, but it will be the underlying assets that one will need to focus on regarding the signs pointing to closing a given position or keeping it open. We might adjust the levels in the "additional instruments" without adjusting the levels in the "main instruments", which will simply mean that we have improved our estimation of these levels, not that we changed our outlook on the markets. We are already working on a tool that would update these levels daily for the most popular ETFs, ETNs and individual mining stocks.
Our preferred ways to invest in and to trade gold along with the reasoning can be found in the how to buy gold section. Furthermore, our preferred ETFs and ETNs can be found in our Gold & Silver ETF Ranking.
As a reminder, Gold & Silver Trading Alerts are posted before or on each trading day (we usually post them before the opening bell, but we don't promise doing that each day). If there's anything urgent, we will send you an additional small alert before posting the main one.
Thank you.
Przemyslaw Radomski, CFA
Founder, Editor-in-chief

