

Briefly: in our opinion, full (300% of the regular position size) speculative short positions in junior mining stocks are justified from the risk/reward point of view at the moment of publishing this Alert.
Gold rallied, silver rallied, and mining stocks rallied yesterday. These are the facts, and there’s no point debating them. However, what is worth debating is whether a rally here is a bullish phenomenon and whether it changes the outlook in any way. Based on the reply to those questions, there might or might not be some actionable implication for our trading positions in the precious metals sector (in junior mining stocks).
Some of you might ask whether it makes any sense to debate whether a rally is bullish or not, as it might seem “obvious” that a rally is bullish. And to this, I would like to reply with an emphasis on the fact that “bullish” or “bearish” is something that relates to the future, and not to the past. A rally is something that already happened, while what happens next is… well, not known.
More interestingly, a top can only happen after a rally, while a bottom can only form after a decline. A top can’t take place after a decline, and a bottom can’t form after a rally.
So, is a rally inherently bullish? Of course not. But is it inherently bearish? It’s not inherently bearish either – not by itself.
What matters – always – is the context.
The context is provided by the preceding price moves, formations, indicators, analogies to the past, the situation on other markets, the strength of reaction to news compared to what would be viewed as normal, and other factors.
Of course, the markets are bombarded with all sorts of news practically all the time. Some news is more important than others, and the daily volatility increases on days when it’s released, especially if something unexpected happens. However, in general, the markets tend to either magnify or dampen the regular reaction based on the technical (emotional) principles. In other cases, if the market “wants” to move in a certain way, it will react strongly to the news that should make it move in a particular way, but it will not react strongly (or it will completely ignore) the news that should make it move in the opposite direction. That’s in general – and, to be more precise, the markets will perform according to their cycles and technical principles, and then deviate from them based on the news that emerged.
So, the questions like the one that I just received, whether any “China concerns” are an important factor for the current price moves, can be replied by saying that yes, they are important, but there are always “concerns” about various countries and their relationships with other countries, and they should be viewed primarily through the sizes of moves that they are able to generate, which should then be compared to what would seem to be a rational response. If the move is lower than what “should” happen, this is a bearish sign. Gold remains below $1,800 and well below its 2011 highs despite various tensions, despite the pandemic & lockdowns of all sorts, and despite ridiculous amounts of money that were created out of thin air. Is this a bullish sign? No.
Remember when Russia literally took over a part of Ukraine? Not “concerns”, not “tensions” – it really happened in Q1 2014. At that time, I received many emails telling me that the world was almost ending as WW3 was “imminent”, and that gold, silver, and mining stocks were about to soar. And what actually happened next? The GDX ETF topped in Q1 2014 at almost $27 and then proceeded to decline and bottom almost two years later at about $12 – erasing more than half of its price at that news-based top.
Charts of Truth
So, what really changed? Let’s jump into the charts for answers.
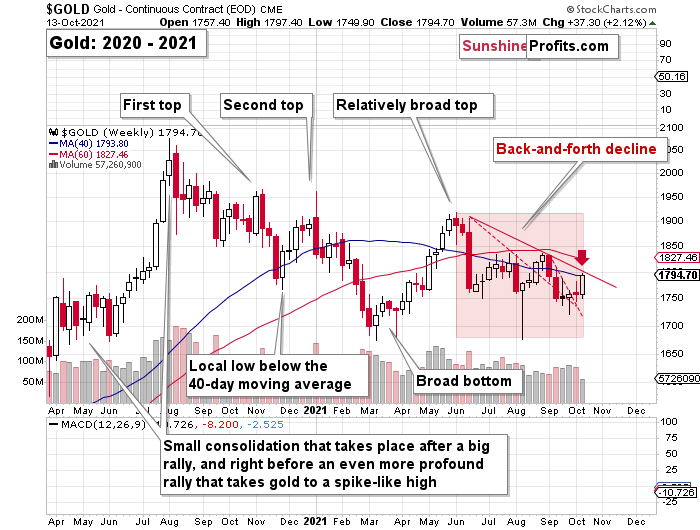
Gold jumped to its 40-week moving average and to the declining red line based on the previous short-term highs. Let’s check the context – what happened in 2013?
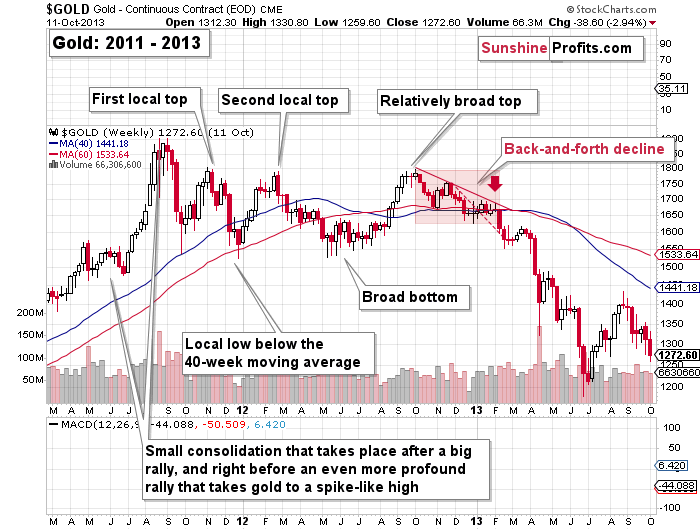
Right before moving to its previous medium-term lows, gold moved to its declining red resistance line that was also very close to its 40-week moving average. I marked this situation with a red arrow on both charts.
As you can see, nothing changed. The link between 2013 and now remains completely intact and its implications remain very bearish.
What about silver – did anything change in the case of the white metal’s outlook?

Absolutely not.
Silver once again moved to its declining red resistance line and its 50-day moving average (approximately). It also happened on relatively big volume.
That’s exactly what happened in early September, and we also see a similarity to what happened in early August. In the previous cases, that’s when silver topped and started a powerful short-term downswing. So, the current implications are bearish, not bullish.
Ok, but what about mining stocks’ breakout?
Closer Look at Gold Miners
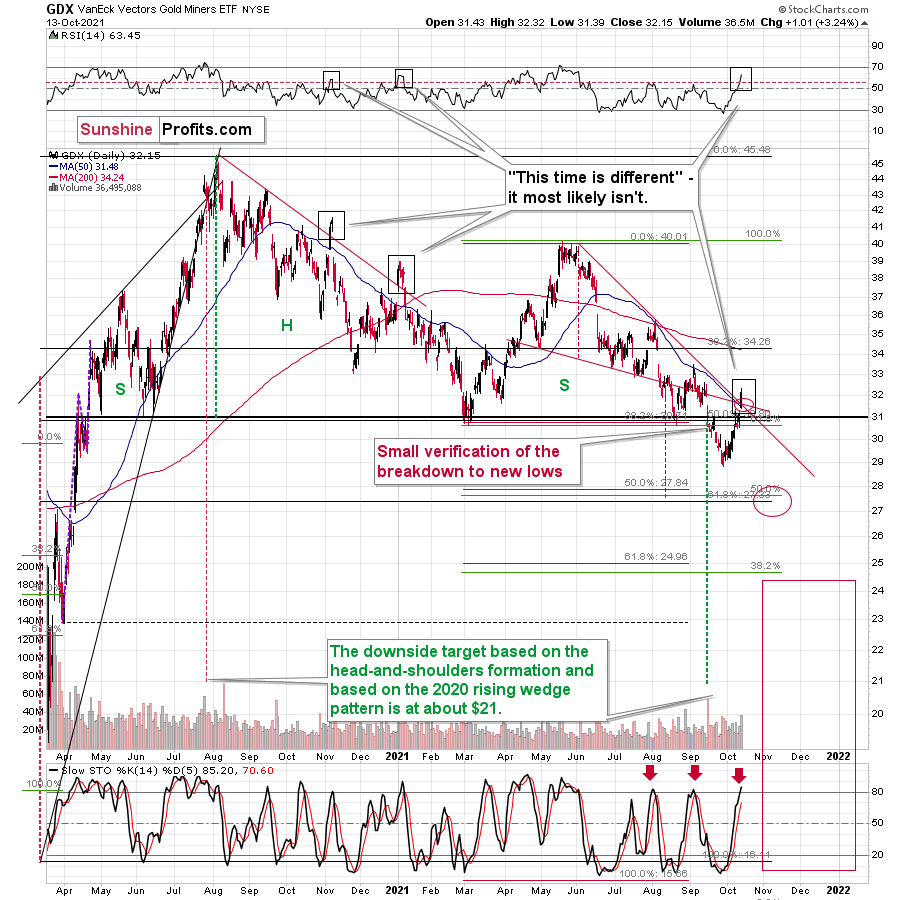
At first sight it’s bullish, but only at first sight. Taking a closer look reveals that when the GDX ETF moved above its previous declining red resistance line in November 2020 and January 2021, AND when the RSI moved above its dashed line (marked with black rectangles), it meant major local tops and preceded very volatile declines.
Moreover, the stochastic indicator is in the position where it topped in early August and early September — please note that silver is showing similarity to those times as well.
So, is yesterday’s move above the declining red resistance lines likely to be sustained? No, that’s not likely.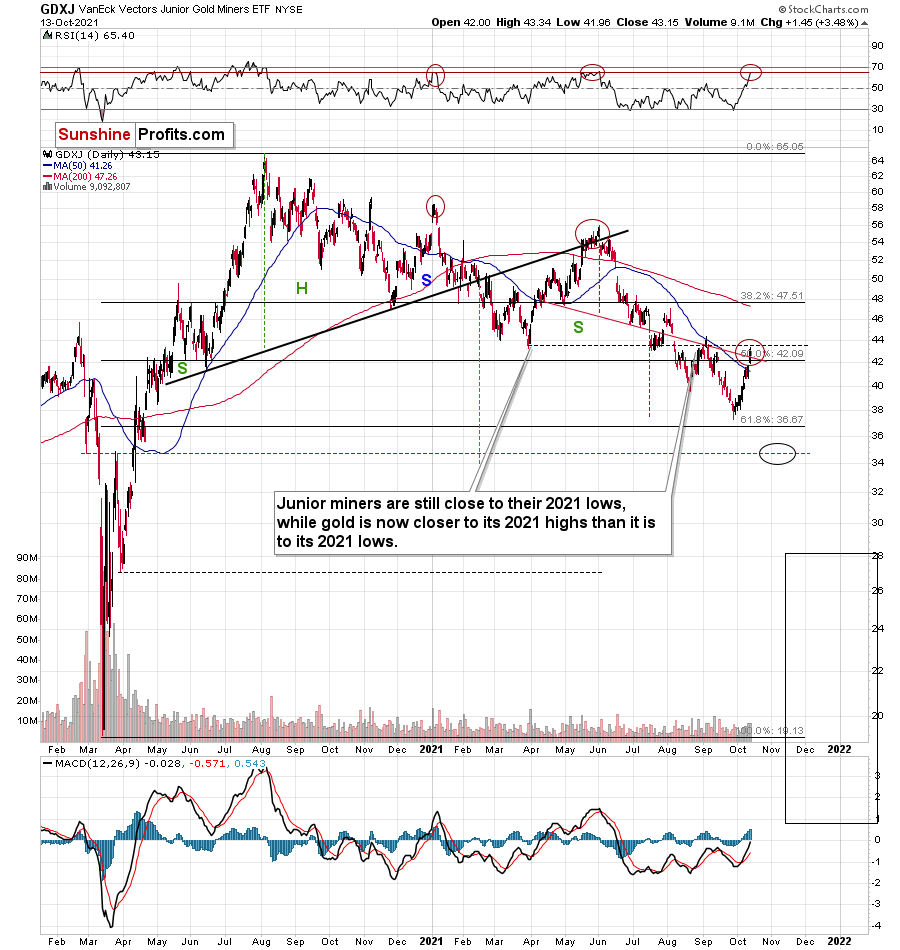
In the case of the GDXJ ETF, we see something similar, as the RSI indicator moved right to the level that previously triggered major reversals – the January and May tops.
Moreover, please note that the GDXJ ETF moved to its previous 2021 lows (not the August ones, but the March and July lows). That’s what could – and based on other charts and GDXJ’s RSI is – likely to trigger another short-term decline.
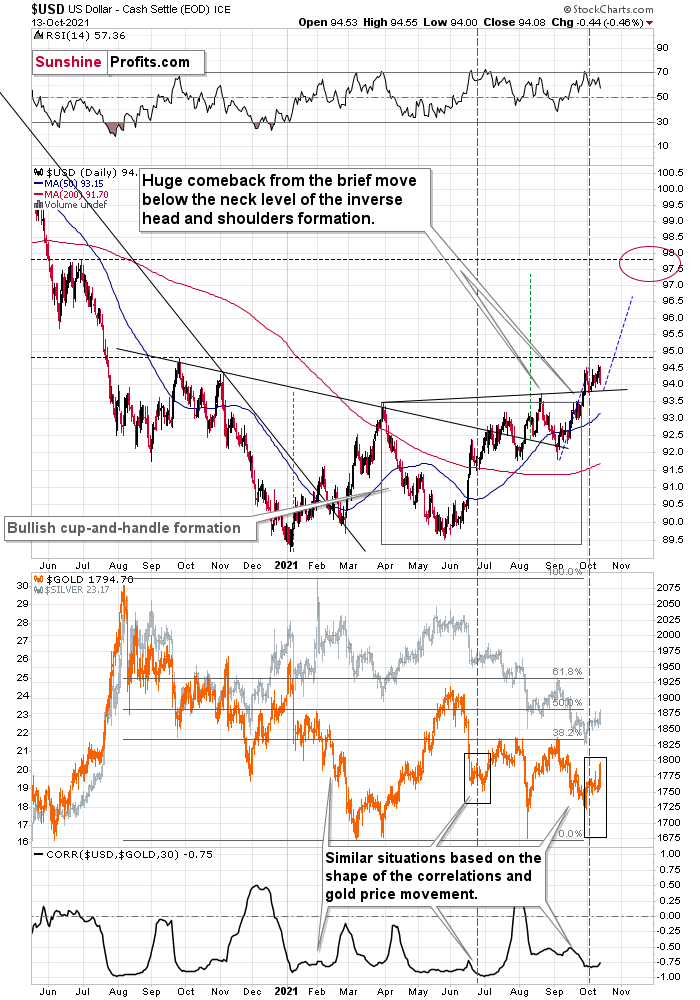
Meanwhile, the USD Index simply consolidates above its previous 2021 highs and above its slightly rising support line. This consolidation is a normal and bullish development. It’s a breather that allows the bulls to get more strength and be ready for another rally.
And as the USD Index continues to rally, the precious metals sector is likely to decline.
Having said that, let’s move to the more fundamental side of things.
Done Deal
With inflation running hot and another month on the books, I wrote on Sep. 15 that another headline Consumer Price Index (CPI) print of roughly 5.25% to 5.75% should hit the wire when the data is released on Oct. 13. And with the headline CPI increasing by 5.4% year-over-year (YoY) in September, inflation is still running 2.7x the Fed’s annual target.
Please see below:
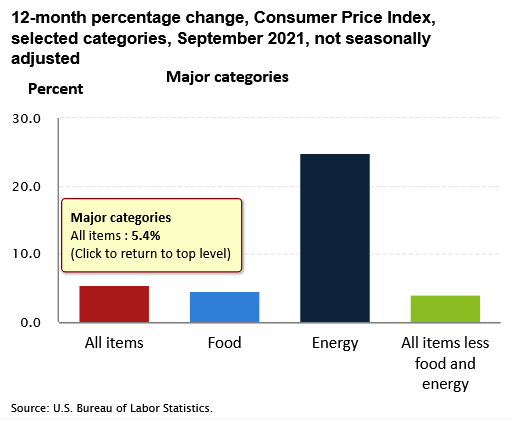
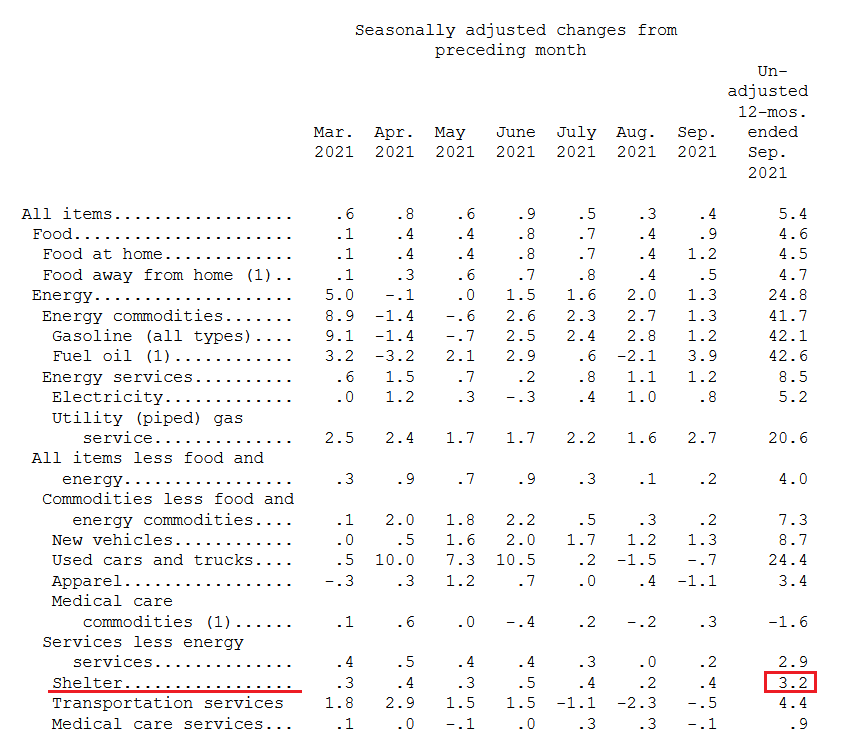
In addition, while I’ve been warning for months that rent inflation should make its presence felt during the autumn months, the Shelter CPI increased by 3.2% YoY in September – the highest YoY percentage increase so far in 2021.
Please see below:
 Source: U.S. Bureau of Labor Statistics (BLS)
More importantly, though, the FOMC released the minutes from its September 21/22 policy meeting on Oct. 13. And while the group essentially admitted its 2021 error, officials reiterated their expectations that “this year’s rise in inflation would prove to be transitory.”
However, highlighting the FOMC’s (stag) inflationary anxiety, the report revealed:
“The staff continued to judge that the risks to the baseline projection for economic activity were skewed to the downside. In particular, the future course of the pandemic was seen as an important source of downside risk. The staff also continued to judge that the risks around the inflation projection were tilted to the upside, with the possibility of more severe and persistent supply issues viewed as especially salient. In addition, the staff pointed to a risk that longer-run inflation expectations would move appreciably higher and lead to persistently elevated inflation.”
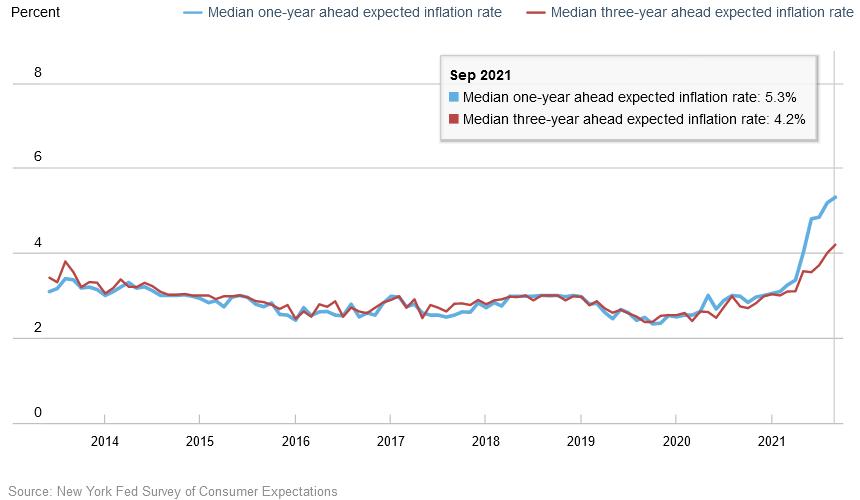
Speaking of “inflation expectations,” the New York Fed released its Survey of Consumer Expectations on Oct. 12. And while imploring that five-year inflation expectations remain “well-anchored,” the report revealed:
“Median short-term (one-year-ahead) inflation expectations increased by 0.1 percentage point in September to 5.3%, the eleventh consecutive monthly increase and a new series high since the inception of the survey in 2013. Median medium-term (three-year-ahead) inflation expectations also increased, to 4.2% from 4.0%, representing the third consecutive monthly increase and a new series high.”
Please see below:
November to Remember?
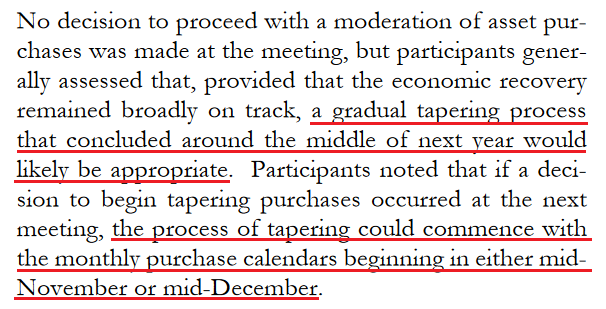
Furthermore, with inflation (as well as consumers’ inflation expectations) surging and the Fed’s largesse only exacerbating the problem, the central bank seems to have finally accepted reality. To explain, the FOMC minutes revealed that a November taper announcement is likely a done deal. And with that, a “gradual” taper that formally begins in “either mid-November or mid-December” is profoundly bullish for the U.S. dollar.
Please see below:
 Source: U.S. Fed
For context, a taper that ends “around the middle of next year” is not “gradual.” The pace is faster than currently expected and also exceeds the precedent set in 2013. To that point, while the performances of the EUR/USD and the USD Index on Oct. 13 didn’t reflect this reality, neither move has fundamental foundations.
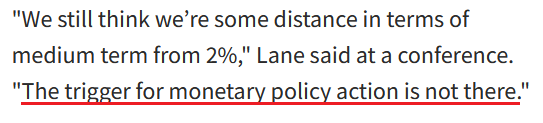
To explain, with the Fed essentially announcing the death of QE on Oct. 13, a profound monetary divergence will likely unfold over the medium term with significant implications for gold and silver. For example, with the Fed closing in on a taper announcement, ECB Chief Economist Philip Lane said on Oct. 11 that “we need to be much less trigger happy, we need to wait for data.” As a result:
 Source: Reuters
Thus, with the Fed’s policy shift poised to usher the Fed/ECB ratio back to (or near) its 2019 lows, the EUR/USD – which accounts for nearly 58% of the movement of the USD Index – has to defy fundamental and historical precedent to move higher.
For example, the Fed/ECB ratio – which measures the relative money printing of the two central banks – stands at roughly 1.02. And since 2015, if we exclude the EUR/USD’s outlier strength in 2017-2018, when the Fed/ECB ratio sunk below 1, the EUR/USD spent most of its time in the 1.100 to 1.150 range. Moreover, when the Fed/ECB ratio sunk to an all-time low of 0.81 in September 2019, the EUR/USD closed the week trading at 1.1029.
What’s Going On, Germany?
Also supporting a dovish ECB, German economic confidence sunk to a five-month low on Oct. 12 and Germany is Europe’s largest economy. To explain, I wrote on Jun. 9 and updated monthly:
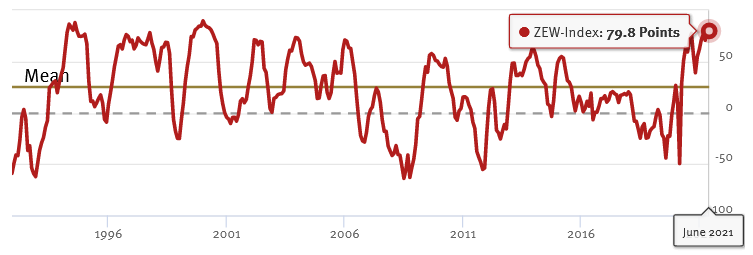
While investors continue to buy hope and sell reality, rather than rising to 86.0 (the consensus estimate), the German ZEW Economic Sentiment Index (released on Jun. 8) fell from 84.4 in May to 79.8 in June.
Please see below:
 Source: ZEW
To explain, the red line above tracks the German ZEW Economic Sentiment Index. If you analyze the behavior, you can see that 79.8 is still well above its historical average. More importantly, tough, notice how abnormally high readings are often followed by swift reversions? And with the prior high (84.4) only superseded by 2000, there is an awful lot of optimism already priced into the EUR/USD.
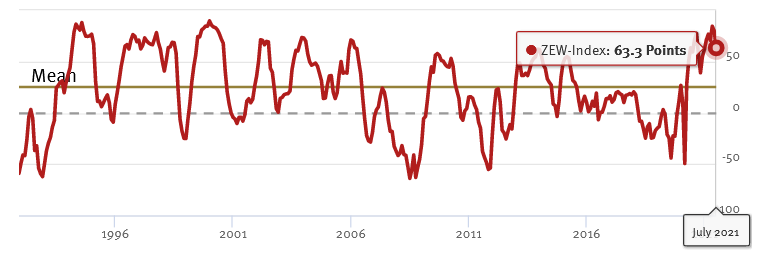
To that point, if we fast forward to Jul. 6, the German ZEW Economic Sentiment Index sunk to 63.3. And following right along, the EUR/USD ended the Jul. 6 session at its lowest level since Mar. 24.
Please see below:
 Source: ZEW
Now, with August’s reading falling off a cliff, the German ZEW Economic Sentiment Index (released on Aug. 10) fell to 40.4 – its lowest level since November 2020.
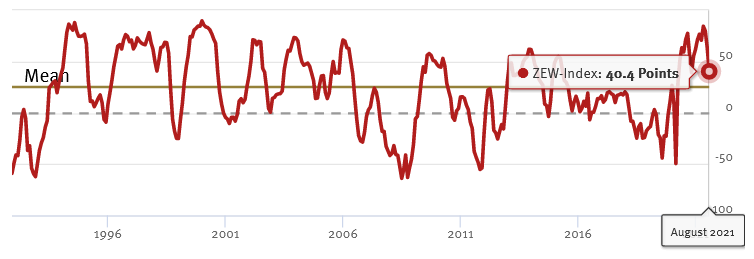 Source: ZEW
And with another month on the books and another new low, the German ZEW Economic Sentiment Index (released on Sep. 7) fell to 26.5 – its lowest level since coronavirus-induced lockdowns plagued the region in March 2020.
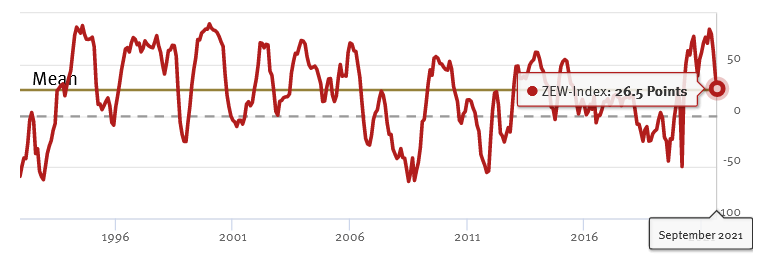 Source: ZEW
And sounding like a broken record, the German ZEW Economic Sentiment Index (released on Oct. 12) made another 2021 low (at 22.3).
Please see below:
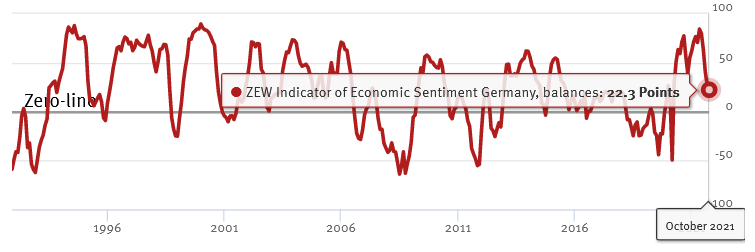 Source: ZEW
ZEW President Professor Achim Wambach provided the following context:
“The economic outlook for the German economy has dimmed noticeably. The further decline of the ZEW Indicator of Economic Sentiment is mainly due to the persisting supply bottlenecks for raw materials and intermediate products. The financial market experts expect profits to go down, especially in export-oriented sectors such as vehicle manufacturing and chemicals/pharmaceuticals.”
The Eurozone Still Behind the US
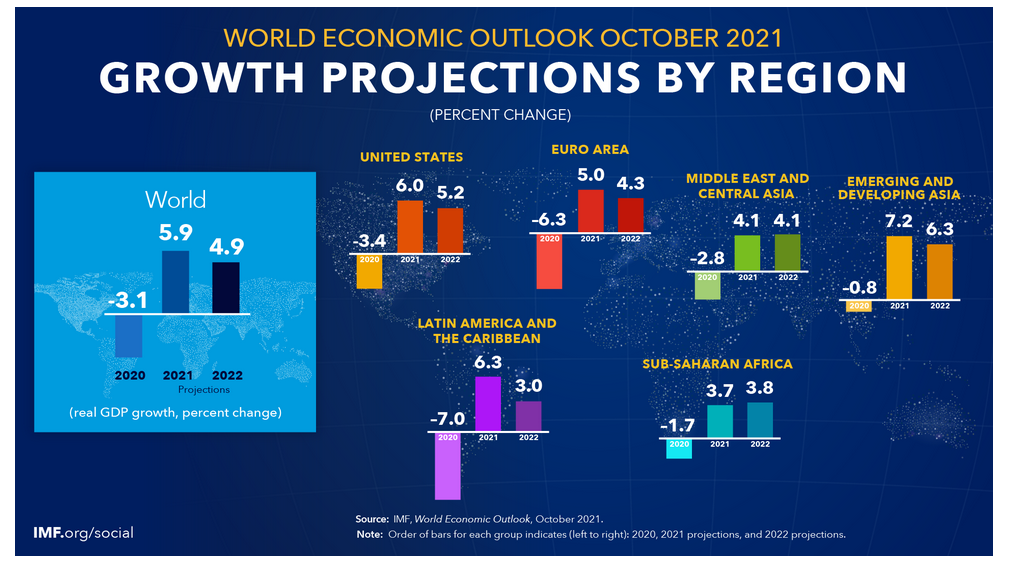
If that wasn’t enough, the International Monetary Fund (IMF) released its latest World Economic Outlook report on Oct. 12. And while changes from the group’s July projections left the Eurozone as a net-gainer over the U.S., the latter’s real GDP growth is still expected to outperform the former in 2021 and 2022.
Please see below:
Even more relevant, market participants expect the Fed to normalize its policy well in advance of the ECB.
Please see below:
 Source: IMF
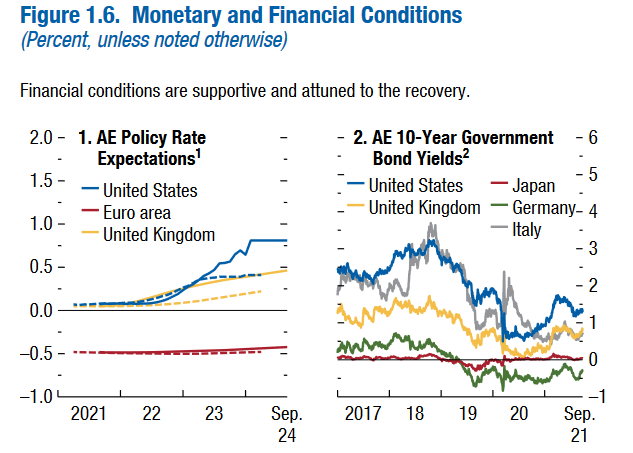
To explain, the chart on the left is where you should focus your attention. The blue line above (U.S.) tracks the expected path of the federal funds rate per the futures market, while the red line above (Eurozone) tracks the expected path of the euro interbank offered forward rate. If you analyze the profound divergence, you can see that the Eurozone overnight lending rate is expected to remain negative well into 2024 and beyond. Conversely, U.S. liftoff is expected near the end of 2022, with further rate hikes commencing thereafter.
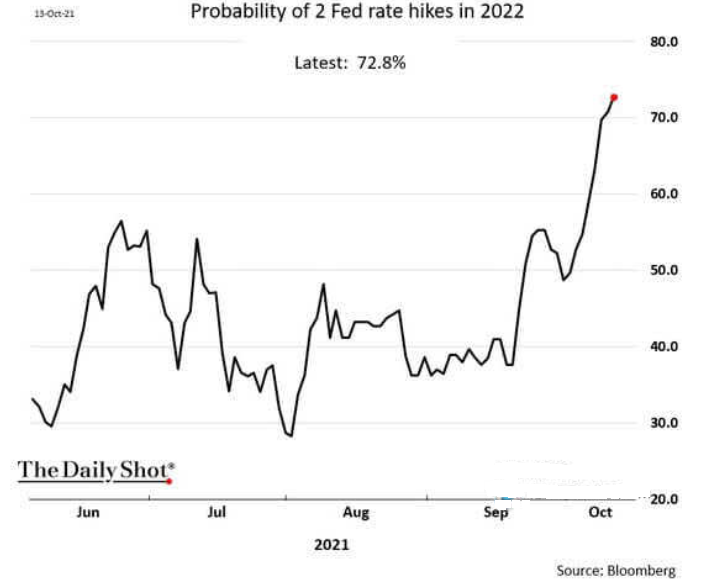
As further evidence, the probability of the Fed announcing two rate hikes in 2022 has recently spiked and is now approaching 73%.
Please see below:
The bottom line? The EUR/USD is materially overvalued relative to Eurozone-U.S. growth, liquidity and interest rate expectations. And with the currency pair responsible for the bulk of the USD Index’s fundamental movement, a material re-rating should uplift the dollar basket over the medium term. And with gold, silver and mining stocks often moving inversely to the U.S. dollar, a stronger greenback will likely weigh on the PMs during the autumn months.
In conclusion, the PMs rallied on Oct. 13, with a weaker USD Index and mixed U.S. Treasury yields helping to underwrite the daily optimism. However, with the latter poised to move higher over the medium term, the strength of the PMs’ upswings on Oct. 13 are cautionary tales of how violent the reversals could be once sentiment shifts. As a result, the PMs’ countertrend rallies will likely fizzle out and their medium-term downtrends should continue over the next few months.
Letters to the Editor
Q: Do you view today’s higher prices as a good opportunity to open new short positions in silver or other PM?
A: Yes - if I didn’t have short positions in the junior mining stocks right now, I would open them. And “no” – since I already have short positions of my desired size, I’m not entering additional ones. Naturally, that’s just my opinion and not individual investment advice.
Q: This time I didn’t jump into the switch from SIL to GDXJ… "boots n’ all". I phased the switch… which has worked out even better. I picked up THREE separate 2% + rallies in the GDXJ. As I am writing, the GDJX is + 3.62% on the day. The DXY has fallen .34% and let the dogs out. The yield on the 10 year has fallen, and that is largely due to the anxiety of the USA not paying its bills waning. All of that got me thinking… Thus far, the rally is 15.5% (in GDXJ). Assuming the USD finds its brake pedal, and this is reversed, could we expect another rally at $35? Or could this be the one at $35 brought forward perhaps?
Your thoughts…
A: That’s a very good question. Since we see a visible corrective upswing now, we might not see it once again when the GDXJ declines to $35. But... if gold reverses at its previous 2021 lows (below $1,700), then the GDXJ would be likely to correct and rally anyway. So, what am I planning to do in this case?
I’m planning to watch the GDXJ, gold and the general stock market and the interactions between them. If the general stock market plunges soon, then the GDXJ might decline much more heavily than gold, and I wouldn’t rule out a situation in which the GDXJ moves below $35 while gold moves “just” to its previous 2021 lows.
If, however, the general stock market doesn’t slide, and the GDXJ is relatively close to $35 while gold is relatively close to $1,700, I’d expect the junior miners to correct from ~$35.
So, as I’m often emphasizing, I’ll be monitoring the situation, and I’ll report to you accordingly.
Overview of the Upcoming Part of the Decline
- It seems to me that the current corrective upswing in gold is over, and the next short-term move lower is about to begin. Since it seems to be another short-term move more than it seems to be a continuation of the bigger decline, I think that junior miners would be likely to (at least initially) decline more than silver.
- It seems that the first stop for gold will be close to its previous 2021 lows, slightly below $1,700. Then it will likely correct a bit, but it’s unclear if I want to exit or reverse the current short position based on that – it depends on the number and the nature of the bullish indications that we get at that time. Before the next big slide, I will likely prefer to get back to the short position in the junior mining stocks.
- After the above-mentioned correction, we’re likely to see a powerful slide, perhaps close to the 2020 low ($1,450 - $1,500).
- If we see a situation where miners slide in a meaningful and volatile way while silver doesn’t (it just declines moderately), I plan to – once again – switch from short positions in miners to short positions in silver. At this time, it’s too early to say at what price levels this could take place, and if we get this kind of opportunity at all – perhaps with gold close to $1,600.
- I plan to exit all remaining short positions when gold shows substantial strength relative to the USD Index while the latter is still rallying. This might take place with gold close to $1,350 - $1,400. I expect silver to fall the hardest in the final part of the move. This moment (when gold performs very strongly against the rallying USD and miners are strong relative to gold after its substantial decline) is likely to be the best entry point for long-term investments, in my view. This might also happen with gold close to $1,375, but it’s too early to say with certainty at this time. I expect the final bottom to take place near the end of the year, perhaps in mid-December.
- As a confirmation for the above, I will use the (upcoming or perhaps we have already seen it?) top in the general stock market as the starting point for the three-month countdown. The reason is that after the 1929 top, gold miners declined for about three months after the general stock market started to slide. We also saw some confirmations of this theory based on the analogy to 2008. All in all, the precious metals sector is likely to bottom about three months after the general stock market tops.
- The above is based on the information available today, and it might change in the following days/weeks.
You will find my general overview of the outlook for gold on the chart below:
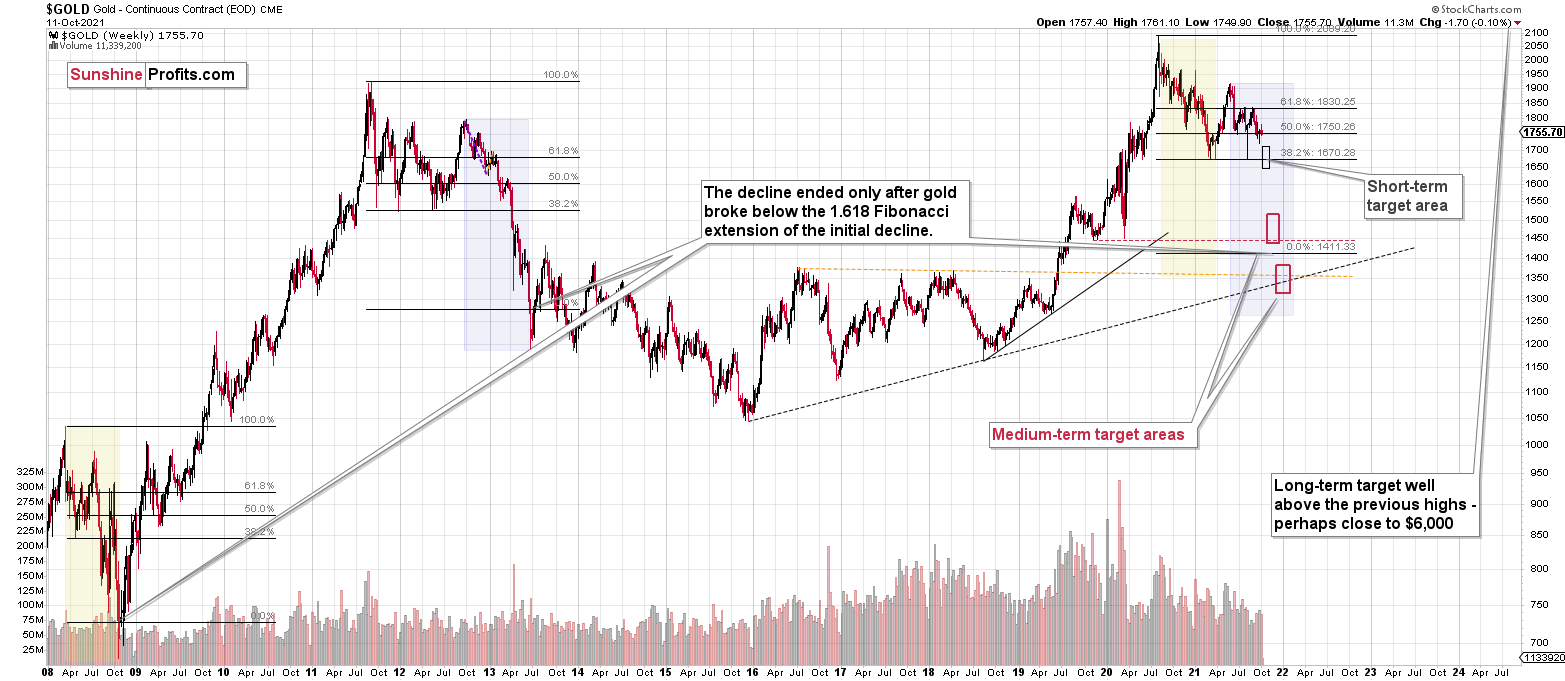
Please note that the above timing details are relatively broad and “for general overview only” – so that you know more or less what I think and how volatile I think the moves are likely to be – on an approximate basis. These time targets are not binding or clear enough for me to think that they should be used for purchasing options, warrants or similar instruments.
Summary
To summarize, the outlook for the precious metals sector remains extremely bearish for the next few months. Since it seems that the PMs are starting another short-term move lower more than it seems that they are continuing their bigger decline, I think that junior miners would be likely to (at least initially) decline more than silver.
Since juniors have rallied more than silver recently, the recent switch helped us get an extra percent on this trade. Of course, exiting the short position at the short-term bottom and re-entering it now would have been better in dollar terms, but given the enormous strength of the downtrend, exiting the short position completely would have been too risky, in my view. So, it seems that we actually made the most of this corrective upswing from the risk to reward point of view, as we never risked missing out on the big downswing if it had happened, and we saved some capital anyway. And now we can move back to the asset that rallied more and is likely to decline more in the short term.
From the medium-term point of view, the key two long-term factors remain the analogy to 2013 in gold and the broad head and shoulders pattern in the HUI Index. They both suggest much lower prices ahead.
It seems that our profits from the short positions are going to become truly epic in the following months.
After the sell-off (that takes gold to about $1,350 - $1,500), I expect the precious metals to rally significantly. The final part of the decline might take as little as 1-5 weeks, so it's important to stay alert to any changes.
Most importantly, please stay healthy and safe. We made a lot of money last March and this March, and it seems that we’re about to make much more on the upcoming decline, but you have to be healthy to enjoy the results.
As always, we'll keep you - our subscribers - informed.
By the way, we’re currently providing you with the possibility to extend your subscription by a year, two years or even three years with a special 20% discount. This discount can be applied right away, without the need to wait for your next renewal – if you choose to secure your premium access and complete the payment upfront. The boring time in the PMs is definitely over, and the time to pay close attention to the market is here. Naturally, it’s your capital, and the choice is up to you, but it seems that it might be a good idea to secure more premium access now while saving 20% at the same time. Our support team will be happy to assist you in the above-described upgrade at preferential terms – if you’d like to proceed, please contact us.
To summarize:
Trading capital (supplementary part of the portfolio; our opinion): Full speculative short positions (300% of the full position) in junior mining stocks are justified from the risk to reward point of view with the following binding exit profit-take price levels:
Mining stocks (price levels for the GDXJ ETF): binding profit-take exit price: $35.73; stop-loss: none (the volatility is too big to justify a stop-loss order in case of this particular trade)
Alternatively, if one seeks leverage, we’re providing the binding profit-take levels for the JDST (2x leveraged) and GDXD (3x leveraged – which is not suggested for most traders/investors due to the significant leverage). The binding profit-take level for the JDST: $16.18; stop-loss for the JDST: none (the volatility is too big to justify a SL order in case of this particular trade); binding profit-take level for the GDXD: $32.08; stop-loss for the GDXD: none (the volatility is too big to justify a SL order in case of this particular trade).
For-your-information targets (our opinion; we continue to think that mining stocks are the preferred way of taking advantage of the upcoming price move, but if for whatever reason one wants / has to use silver or gold for this trade, we are providing the details anyway.):
Silver futures downside profit-take exit price: $19.12
SLV profit-take exit price: $17.72
ZSL profit-take exit price: $41.38
Gold futures downside profit-take exit price: $1,683
HGD.TO – alternative (Canadian) inverse 2x leveraged gold stocks ETF – the upside profit-take exit price: $12.48
Long-term capital (core part of the portfolio; our opinion): No positions (in other words: cash
Insurance capital (core part of the portfolio; our opinion): Full position
Whether you already subscribed or not, we encourage you to find out how to make the most of our alerts and read our replies to the most common alert-and-gold-trading-related-questions.
Please note that we describe the situation for the day that the alert is posted in the trading section. In other words, if we are writing about a speculative position, it means that it is up-to-date on the day it was posted. We are also featuring the initial target prices to decide whether keeping a position on a given day is in tune with your approach (some moves are too small for medium-term traders, and some might appear too big for day-traders).
Additionally, you might want to read why our stop-loss orders are usually relatively far from the current price.
Please note that a full position doesn't mean using all of the capital for a given trade. You will find details on our thoughts on gold portfolio structuring in the Key Insights section on our website.
As a reminder - "initial target price" means exactly that - an "initial" one. It's not a price level at which we suggest closing positions. If this becomes the case (like it did in the previous trade), we will refer to these levels as levels of exit orders (exactly as we've done previously). Stop-loss levels, however, are naturally not "initial", but something that, in our opinion, might be entered as an order.
Since it is impossible to synchronize target prices and stop-loss levels for all the ETFs and ETNs with the main markets that we provide these levels for (gold, silver and mining stocks - the GDX ETF), the stop-loss levels and target prices for other ETNs and ETF (among other: UGL, GLL, AGQ, ZSL, NUGT, DUST, JNUG, JDST) are provided as supplementary, and not as "final". This means that if a stop-loss or a target level is reached for any of the "additional instruments" (GLL for instance), but not for the "main instrument" (gold in this case), we will view positions in both gold and GLL as still open and the stop-loss for GLL would have to be moved lower. On the other hand, if gold moves to a stop-loss level but GLL doesn't, then we will view both positions (in gold and GLL) as closed. In other words, since it's not possible to be 100% certain that each related instrument moves to a given level when the underlying instrument does, we can't provide levels that would be binding. The levels that we do provide are our best estimate of the levels that will correspond to the levels in the underlying assets, but it will be the underlying assets that one will need to focus on regarding the signs pointing to closing a given position or keeping it open. We might adjust the levels in the "additional instruments" without adjusting the levels in the "main instruments", which will simply mean that we have improved our estimation of these levels, not that we changed our outlook on the markets. We are already working on a tool that would update these levels daily for the most popular ETFs, ETNs and individual mining stocks.
Our preferred ways to invest in and to trade gold along with the reasoning can be found in the how to buy gold section. Furthermore, our preferred ETFs and ETNs can be found in our Gold & Silver ETF Ranking.
As a reminder, Gold & Silver Trading Alerts are posted before or on each trading day (we usually post them before the opening bell, but we don't promise doing that each day). If there's anything urgent, we will send you an additional small alert before posting the main one.
Thank you.
Przemyslaw Radomski, CFA
Founder, Editor-in-chief

