tools spotlight

-
Early (Video) Heads-up before Monday’s Session
October 2, 2021, 9:12 AMYou will find today’s "early heads-up" video below.
https://www.youtube.com/watch?v=QA97_iarp9o
In today's early heads-up video, I'm describing a gold chart with one of the key developments that are currently critical for gold, silver, and mining stock investors – the breakdown in the HUI to gold ratio.
Bonus insight: how to tell if gold price just formed a major bottom, or if it's just a fake / short-term rally that's starting.
-
Stock Market Correction: One More Spark to Light the Fire?
October 1, 2021, 9:27 AMWith earnings season beginning in October, a profound correction of the S&P 500 could add fuel to the fire of the already well-supported U.S. dollar.
While the USD Index was largely flat on Sep. 30, the EUR/USD closed at a new 2021 low. And because the currency pair accounts for nearly 58% of the movement of the USD Index, its performance is material. Moreover, while I’ve been warning for months that the Fed and the ECB are worlds apart, the EUR/USD still hasn’t priced in the magnitude of the divergence.
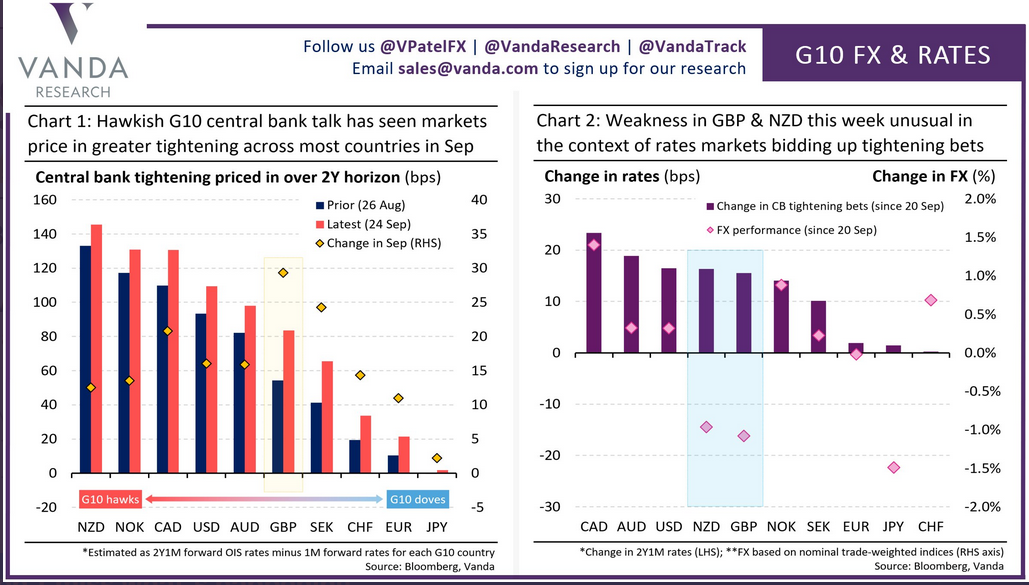
Please see below:
To explain, the chart on the right is where you should focus your attention: the purple bars above depict the change in investors’ hawkish central bank bets since Sep. 20, while the pink diamonds above depict the performance of various currencies during that same timeframe. If you analyze the column labeled “USD,” you can see that the Fed’s hawkish rhetoric has ramped up bets on further tightening. However, if you analyze the pink diamond near the bottom of the purple bar, you can see that the U.S. dollar’s performance hasn’t matched the fervor. Conversely, if you analyze the column labeled “EUR,” you can see that investors’ expectations of lower-for-longer Eurozone interest rates haven’t budged, and the euro has held up quite well. For context, the GBP (11.9% of the USD Index’s movement) and the CAD (9.1% of the USD Index’s movement) have largely offset one another. With the former not pricing in any of investors’ hawkish bets and the latter pricing in nearly all of investors’ hawkish bets, the divergence is largely a wash. However, with the U.S. dollar still underpriced and few upside catalysts available for the euro, more EUR/USD downside should commence over the medium term.
Supporting that argument, Jeremy Stretch, Head of G10 FX Strategy at CIBC Capital Markets, told clients that “the ECB is intent upon maintaining favorable financing conditions to perpetuate the recovery narrative. As a consequence, we expect the central bank to consider PEPP transitioning into the Asset Purchase Programme [APP].” And with that, “slower growth into 2023 will help limit medium-term price gains. Although headline HICP risks testing 13-year highs, the ECB’s adjusted inflation remit will allow the bank to look through short-term price spikes, especially as core prices are expected to remain relatively well-contained. Alongside fiscal policy developments, that will promote a lower-for-longer trajectory for interest rates, and as a result, a weaker EUR in 2022.”
And advocating for just that, ECB Governing Council Member Mario Centeno told CNBC on Sep. 27 that “we were fooled by some news on inflation in the past, which prompted us to act in the wrong way, so we don’t want, definitely, to commit the same sort of errors this time.... We need to guarantee favorable financing conditions to all sectors in our economy as we go out of [the] crisis, and we are not yet there, we are not yet out of the woods.”
And how does all of this impact Centeno’s taper timeline?
In addition, while the ECB’s PEPP program should conclude at the end of March 2022, its APP program isn’t going anywhere. And when the central bank announced its PEPP “recalibration” on Sep. 9, I warned that the ECB’s liquidity spigot should remain on full blast much longer than the Fed’s.
I wrote:
While the deceleration may seem like a monumental shift, the move is much more semblance than substance: net APP purchases will still be reinvested “for an extended period of time past the date when [the ECB] starts raising the key ECB interest rates, and in any case for as long as necessary to maintain favorable liquidity conditions and an ample degree of monetary accommodation.”
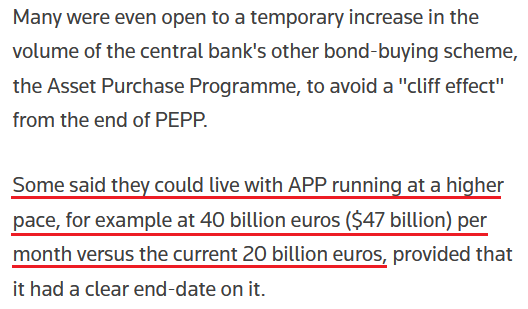
Likewise, with many ECB officials aiming to avoid a “cliff effect” when the PEPP program unwinds, Reuters reported that the central bank could expand its APP program to offset the damage. The bottom line? Tapering in Europe is nothing like tapering in the U.S.
Please see below:
Reverse Repos Strike Again
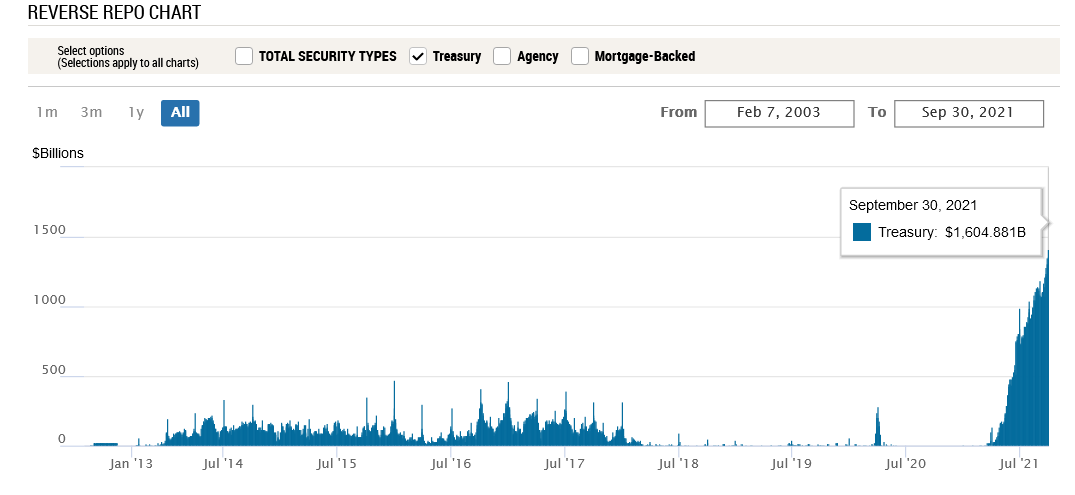
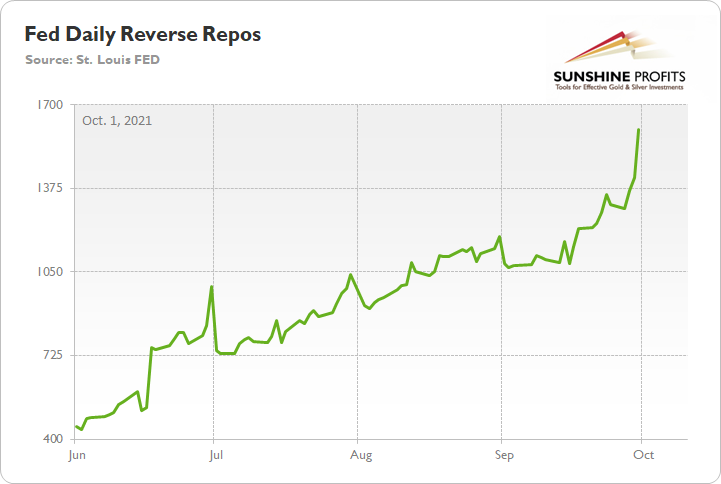
Also supporting a stronger U.S. dollar, the Fed’s waterfall of QE is running out of reservoirs. And after 92 counterparties drained nearly $1.605 trillion out of the U.S. financial system on Sep. 30, the Fed’s daily reverse repurchase agreements hit another all-time high.
Please see below:
To explain, a reverse repurchase agreement (repo) occurs when an institution offloads cash to the Fed in exchange for a Treasury security (on an overnight or short-term basis). And with U.S. financial institutions currently flooded with excess liquidity, they’re shipping cash to the Fed at an alarming rate. And while I’ve been warning for months that the activity is the fundamental equivalent of a taper – due to the lower supply of U.S. dollars (which is bullish for the USD Index) – as we await a formal announcement from the Fed, the U.S. dollar’s fundamental foundation remains robust.
Furthermore, with the Fed’s daily reverse repos averaging $642 billion in June, $848 billion in July, $1.053 trillion in August, and $1.211 trillion in September, the accelerated liquidity drain further supports a stronger U.S. dollar.
Stock Market On Its Last Legs?
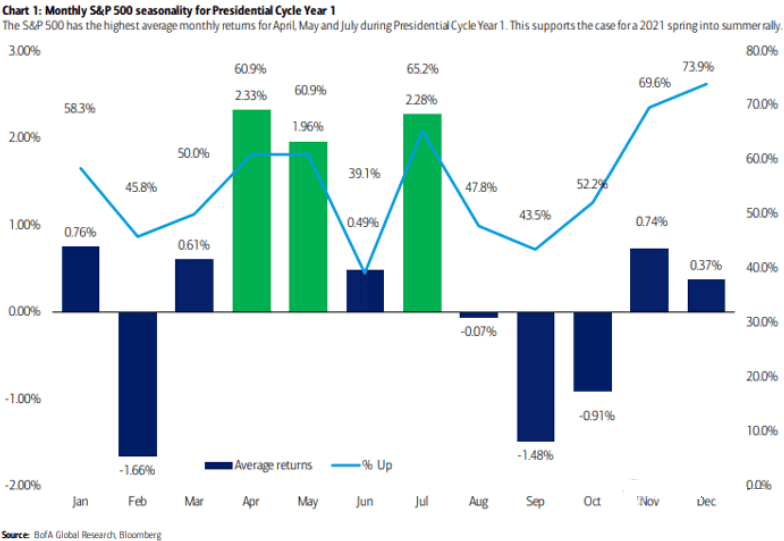
What’s more, with the safe-haven bid also an important piece of the USD Index’s puzzle, the stock market’s recent struggles still haven’t manifested into a full-blown correction. However, with seasonal factors signaling more weakness ahead, a profound drawdown of the S&P 500 could accelerate the pace of the USD Index’s uprising.
Please see below:
To explain, the blue and green bars above track the average monthly performance of the S&P 500 after a new U.S. President takes office. If you analyze the columns labeled “Sep” and “Oct,” you can see that the end of summer often elicits the worst monthly performances. And while the S&P 500 capped off September with a 1.19% decline, the weakness should continue in October.
As evidence, Bed Bath & Beyond’s stock plunged by more than 22% on Sep. 30. And with supply chain disruptions and weak demand clashing with U.S. policy uncertainty, optimism is on shaky ground. For example, the retailer’s second-quarter adjusted EPS came in at $0.04 vs. $0.52 expected, while revenue came in at $1.99 billion vs. $2.06 billion expected. Moreover, the company slashed its third-quarter adjusted EPS guidance to between flat and $0.05, with revenue ranging from $1.96 billion to $2 billion. Analysts were expecting figures of $0.28 and $2.02 billion respectively.
And while I’ve highlighted the issue on several occasions, CFO Gustavo Arnal lamented the fervor of surging freight costs. He said during the company’s Q2 earnings call:
“What we're seeing now in the second quarter is, look, significant freight cost increases well above what we had anticipated. We had anticipated 240 basis points. We got 360 basis points. We're still projecting some sequential increase in freight costs as we go from Q2 to Q3.”
Furthermore, CEO Mark Tritton said that the Delta variant has also “created a challenging and volatile environment:”
“In August, the final and largest sales month of Q2, traffic unexpectedly slowed, and, therefore, sales did not materialize as we had anticipated. External disruptive forces such as the resurgence of COVID-19 cases and growing Delta fears created a challenging and volatile environment. This is particularly evident in large southern states, such as Florida and Texas, as well as California, which, in aggregate, represent approximately 30% of our total sales. From July to August, traffic trends evolved in this state and worsened by double-digit percentages.”
As a result:
“As the quarter progressed, particularly in August, conditions worsened relative to our thoughtful preparations. The speed of industry inflation and lead time pressures outpaced our plans to offset these headwinds, and as a result, we did not pivot fast enough, especially on price and margin recovery.”
The bottom line? With the U.S. dollar already supported by a strong technical and fundamental foundation, a profound correction of the S&P 500 could be the next spark that lights the bullish fire. And with earnings season beginning in early/mid-October, more disappointments like what we witnessed with Bed Bath & Beyond could encourage the next correction. More importantly, though, given the PMs’ strong negative correlations with the U.S. dollar, a sharp move higher in the greenback could coincide with a sharp move lower in the PMs.
In conclusion, the PMs rallied on Sep. 30, but the bearish thesis remains unchanged: the USD Index is poised for an upward re-rating and U.S. Treasury yields still have the medium-term wind at their backs. Moreover, with the general stock market showing signs of stress, a real bout of panic could also uplift the USD Index and upend the PMs. As a result, lower precious metals prices should materialize over the next few months.
Thank you for reading our free analysis today. Please note that the above is just a small fraction of the full analyses that our subscribers enjoy on a regular basis. They include multiple premium details such as the interim targets for gold and silver that could be reached in the next few weeks. We invite you to subscribe now and read today’s issue right away.
Sincerely,
Przemyslaw Radomski, CFA
Founder, Editor-in-chief -
Powell: Inflation Might Not Be Transitory, After All
September 30, 2021, 9:29 AMAt a panel discussion, Fed Chair finally admitted that inflation could be more (!) long-lasting than expected. What does it mean? Hawks. Lots of them.
Capitulation
With Fed Chairman Jerome Powell finally having his ‘come-to-Jesus’ moment on Sep. 29, the central bank chief’s skittish words helped light a fire under the USD Index. For context, I’ve been warning for months that Powell remains materially behind the inflation curve. And with his indecisive speech upending the Fed’s confidence game, the gambit is showing signs of unraveling.
Speaking at an ECB panel discussion on Sep. 29, he said:
“The current inflation spike is really a consequence of supply constraints meeting very strong demand. And that is all associated with the reopening of the economy, which is a process that will have a beginning, middle and an end. It’s very difficult to say how big the effects will be in the meantime or how long they last.”
For context, first it was “base effects,” then it was “transitory” and now “it’s very difficult to say.”
He continued:
“It’s also frustrating to see the bottlenecks and supply chain problems not getting better – in fact, at the margins apparently getting a little bit worse. We see that continuing into next year probably, and holding up inflation longer than we had thought.”
What’s more, Powell actually admitted that the Fed is facing a conundrum that it hasn’t dealt with “for a very long time.”
“Managing through that process over the next couple of years is… going to be very challenging because we have this hypothesis that inflation is going to be transitory. We think that’s right. But we are concerned about underlying inflation expectations remaining stable, as they have so far.”
Wow. If that’s not capitulation, I don’t know what is.
For context, I wrote on Sep. 24:
I’ve warned on several occasions that the only way for the Fed to control inflation is to increase the value of the U.S. dollar and decrease the value of commodities. However, with commodities’ fervor accelerating on Sep. 23 – a day when the USD Index declined – the price action should concern Chairman Jerome Powell. As a result, FOMC participants’ 2022 inflation forecast is likely wishful thinking and they may find that a faster liquidity drain (which is bullish for the U.S. dollar) is their only option to control the pricing pressures.
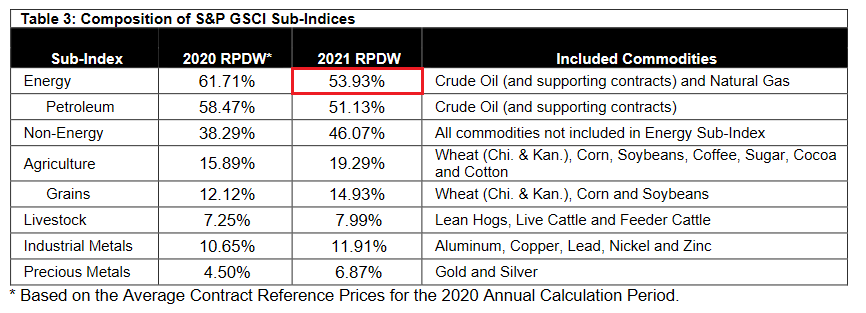
Speaking of which, the S&P Goldman Sachs Commodity Index (S&P GSCI) has rallied by ~5% for the month of September. For context, the S&P GSCI contains 24 commodities from all sectors: six energy products, five industrial metals, eight agricultural products, three livestock products and two precious metals. However, energy accounts for roughly 54% of the index’s movement.
Please see below:
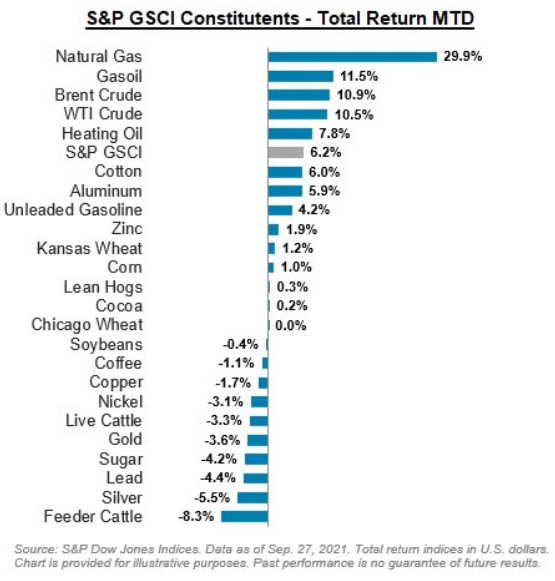
As well, if you analyze the graphic below, you can see the impact that rising energy prices had on the S&P GSCI’s performance in September (MTD returns as of Sep. 27).
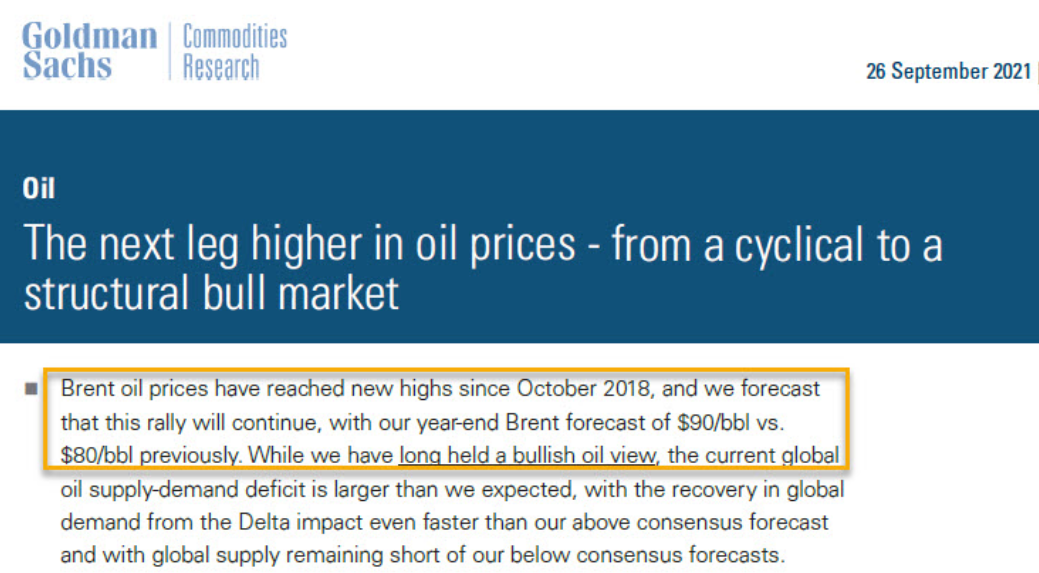
To that point, with Brent and WTI surging recently and the latter on track for six straight weeks of weekly gains, Goldman Sachs has upped its year-end Brent target to $90 a barrel. Calling it the “revenge” of the old economy, Jeff Currie, Goldman Sachs global head of commodities research, said that “poor returns saw capital redirected away from the old economy to the new economy. It’s not unique to Europe, it’s not unique to energy, it’s a broad-based old-economy problem.”
Thus, in his view, commodity prices need to be “much higher to get returns sufficient to start attracting capital. People wanted a quick return, and now you’re paying the price for it.”
Please see below:
Supporting the thesis, Bank of America commodities strategist Francisco Blanch told Bloomberg on Sep. 28 that Brent could hit $100 a barrel in 2022 and that a “cold winter” could actually pull forward the forecast.
He said:
“First, there is plenty of pent up mobility demand after an 18 month lockdown. Second, mass transit will lag, boosting private car usage for a prolonged period of time. Third, pre-pandemic studies show more remote work could result in more miles driven, as work-from-home turns into work-from-car. On the supply side, we expect government policy pressure in the U.S. and around the world to curb cap-ex over coming quarters to meet Paris goals. Secondly, investors have become more vocal against energy sector spending for both financial and ESG reasons. Third, judicial pressures are rising to limit carbon dioxide emissions. In short, demand is poised to bounce back and supply may not fully keep up, placing OPEC in control of the oil market in 2022.”
Now, the important point isn’t whether or not Currie and Blanch are correct. The important point is that higher oil prices are mutually exclusive to Powell’s 2% inflation goal. For example, the Commodity Producer Price Index (PPI) – which is a reliable indicator of the next month’s Consumer Price Index (CPI) – recorded its highest monthly year-over-year (YoY) percentage increase in August since 1974. What’s more, the sky-high reading occurred with the S&P GSCI declining by ~2% in August (that’s why monitoring surging container rates is so important). However, as mentioned, the S&P GSCI has already risen by ~5% in September and container rates have also made new highs. As a result, Powell’s hawkish shift isn’t nearly hawkish enough to solve his inflationary dilemma.
Inflation Isn’t Going Anywhere
As further evidence, the Richmond Fed released its Fifth District Survey of Manufacturing Activity on Sep. 28. And while the headline index turned negative as output slumped, pricing pressures remained materially elevated.
Please see below:
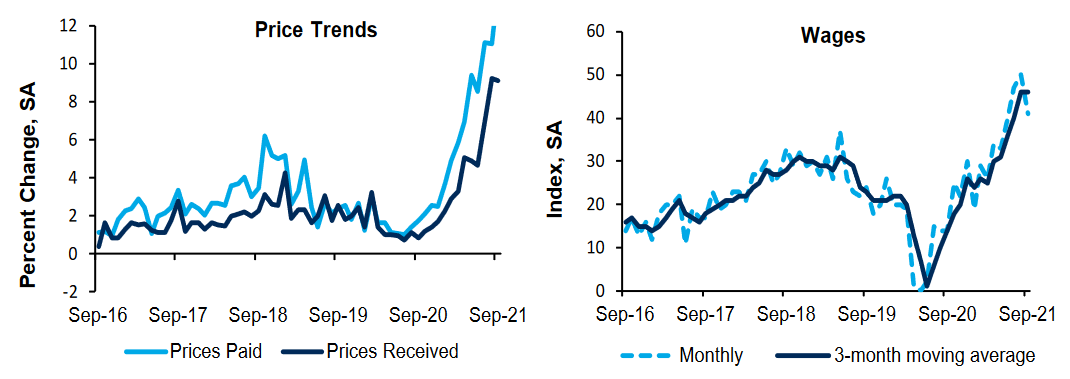
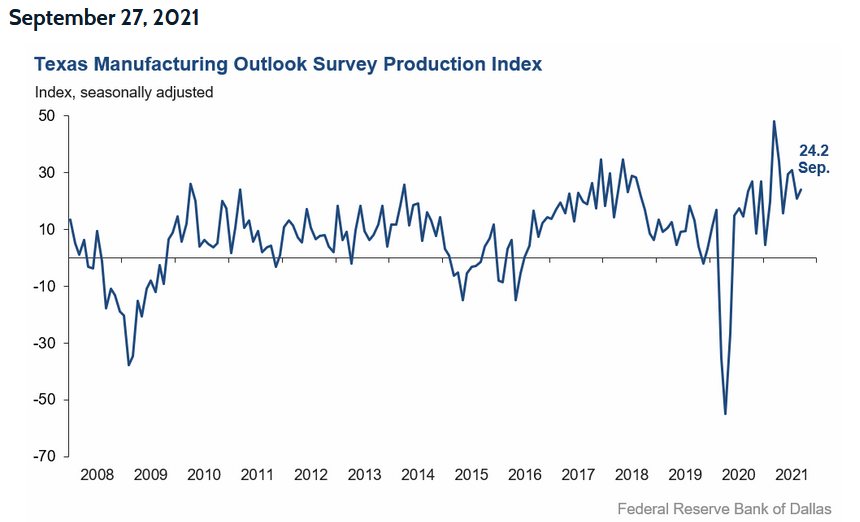
Likewise, the Dallas Fed released its Texas Manufacturing Outlook Survey on Sep. 27. The report revealed:
“Prices and wages continued to increase strongly in September. The price indexes climbed further, with the raw materials prices index at 80.4 and the finished goods prices index at 44.0, an all-time high. The wages and benefits index held steady at a highly elevated reading of 42.7.”
For a visual of the overall index, please see below:
Furthermore, the Dallas Fed also released its Texas Service Sector Outlook Survey and its Texas Retail Outlook Survey on Sep. 28. And though the U.S. service sector has suffered the brunt of the Delta variant’s wrath, pricing pressures remained. The report revealed:
“Wage pressures eased in September, though remained at historically high levels, while price pressures remained highly elevated. The wages and benefits index declined from 32.6 to 26.9. The selling prices index was largely unchanged at 20.2, with nearly a quarter of firms reporting increased prices compared with August, while the input prices index inched up one point to 42.9.”
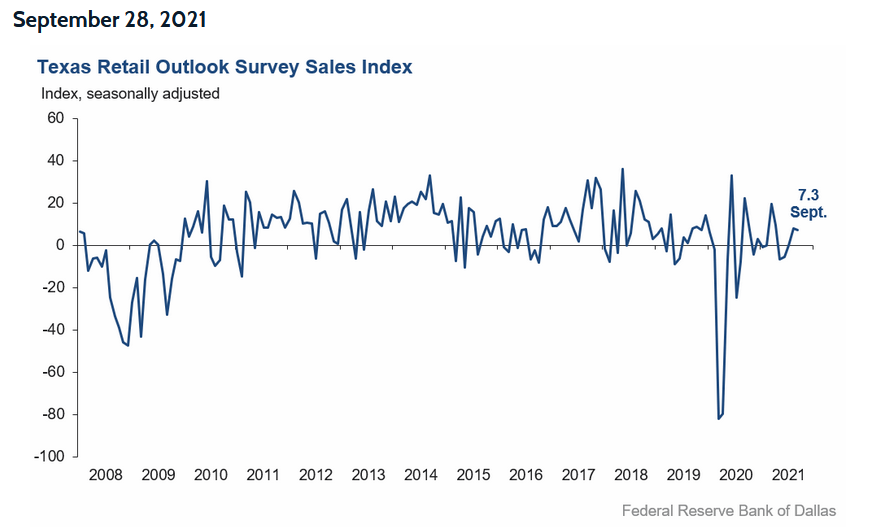
More importantly, though, the Texas Retail Outlook Survey revealed:
“Retail price pressures surged once again in September after some signs of moderation in August, while wage pressures held steady. The selling prices index surged nearly 11 points to 50.4 – with 58 percent of retailers increasing prices compared with August – while the input prices index increased from 41.3 to 50.1. The wages and benefits index was flat at 24.6.”
For a visual of the overall index, please see below:
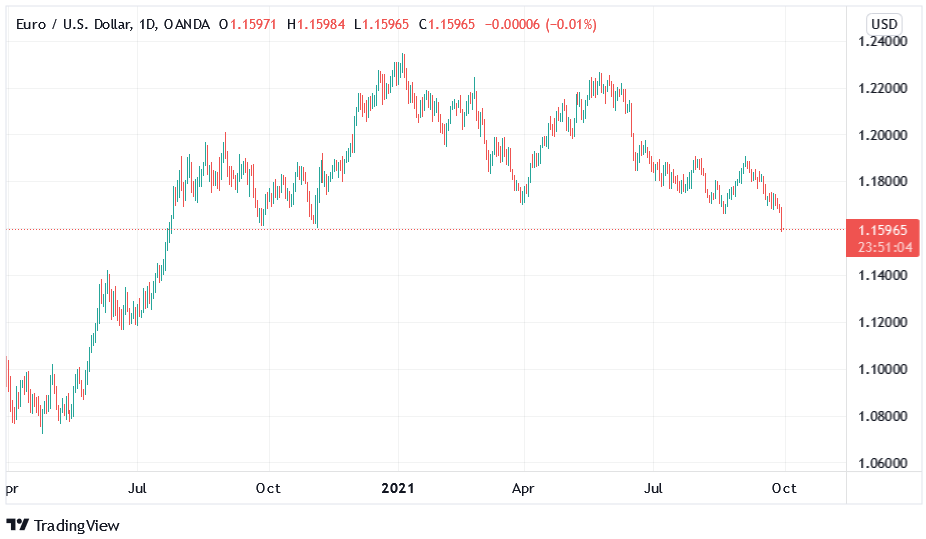
 And as the drama unfolds and Powell’s inflationary conundrum intensifies, his hawkish rhetoric on Sep. 29 helped sink the EUR/USD. For context, the EUR/USD accounts for nearly 58% of the movement of the USD Index. And with the currency pair collapsing below 1.1600 on Sep. 29 and closing below key 2020 support, the European dam could be about to break.
Please see below:
Reverse Repos Hit Another All-Time High!
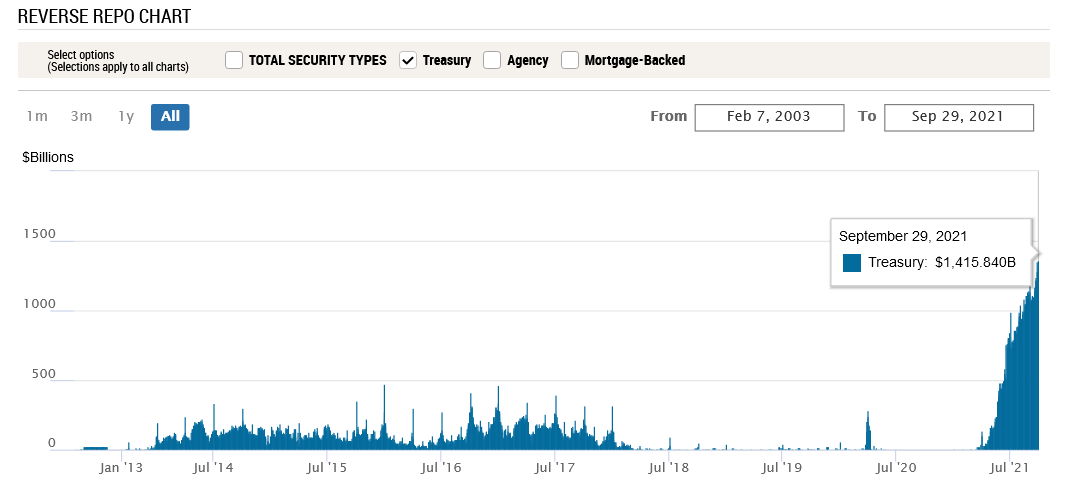
Also bullish for the U.S. dollar, with Powell’s liquidity circus still on full display, there is too much money floating around with too little use. And upping the ante on what I’ve been highlighting for months, after 80 counterparties drained nearly $1.416 trillion out of the U.S. financial system on Sep. 29, the Fed’s daily reverse repurchase agreements hit another all-time high.
Please see below:
To explain, a reverse repurchase agreement (repo) occurs when an institution offloads cash to the Fed in exchange for a Treasury security (on an overnight or short-term basis). And with U.S. financial institutions currently flooded with excess liquidity, they’re shipping cash to the Fed at an alarming rate. I’ve been warning for months that the activity is the fundamental equivalent of a taper due to the lower supply of U.S. dollars (which is bullish for the USD Index). Thus, while we await a formal announcement from the Fed, the U.S. dollar’s fundamental foundation remains robust.
The bottom line? Powell’s only hope to curb inflation is to strengthen the U.S. dollar and weaken commodity (including gold and silver) prices. For context, major futures contracts are priced in U.S. dollars. And when the dollar rallies, it’s more expensive for foreign buyers (in their currency) to purchase the underlying commodities. As a result, a stronger U.S. dollar often stifles demand. And with the current supply/demand dynamics favoring higher commodity prices, Powell will have to work his magic — strengthen the dollar and reduce demand — if he wants his inflation problem to subside.
In conclusion, gold, silver (ouch) and mining stocks sunk like stones on Sep. 29. And with the USD Index cutting through 94 like a knife through butter, new 2021 lows in the EUR/USD were accompanied by new 2021 highs in the USD Index. Moreover, with the momentum poised to continue, the PMs’ medium-term outlooks remain quite somber. As a result, further weakness will likely materialize before brighter days emerge (probably) near the end of the year.
Thank you for reading our free analysis today. Please note that the above is just a small fraction of the full analyses that our subscribers enjoy on a regular basis. They include multiple premium details such as the interim targets for gold and silver that could be reached in the next few weeks. We invite you to subscribe now and read today’s issue right away.
Sincerely,
Przemyslaw Radomski, CFA
Founder, Editor-in-chief -
Dovish to Hawkish Fed: Sounds Bearish for Gold
September 29, 2021, 9:56 AMWith a more hawkish Fed disposition, non-commercial traders remaining dollar-strong, and the EUR/USD sinking, it doesn’t bode well for the metals.
With U.S. Treasury yields continuing their ascent on Sep. 28, the mini taper tantrum pushed the NASDAQ 100 over a cliff. And with the USD Index loving the surge in volatility, the greenback further cemented its breakout above the neckline of its inverse (bullish) head & shoulders pattern. And looking ahead, the momentum should continue. Case in point: Fed Chairman Jerome Powell testified before the U.S. Senate Banking Committee on Sep. 28. In his prepared remarks, he said:
“Inflation is elevated and will likely remain so in coming months before moderating. As the economy continues to reopen and spending rebounds, we are seeing upward pressure on prices, particularly due to supply bottlenecks in some sectors. These effects have been larger and longer lasting than anticipated, but they will abate, and as they do, inflation is expected to drop back toward our longer-run 2 percent goal.”
Furthermore, while I’ve been warning for months that Powell remains materially behind the inflation curve, his prepared remarks didn’t have a single mention of “base effects” or “transitory.” Instead, the Fed chief’s new favorite buzz word is “moderating.”
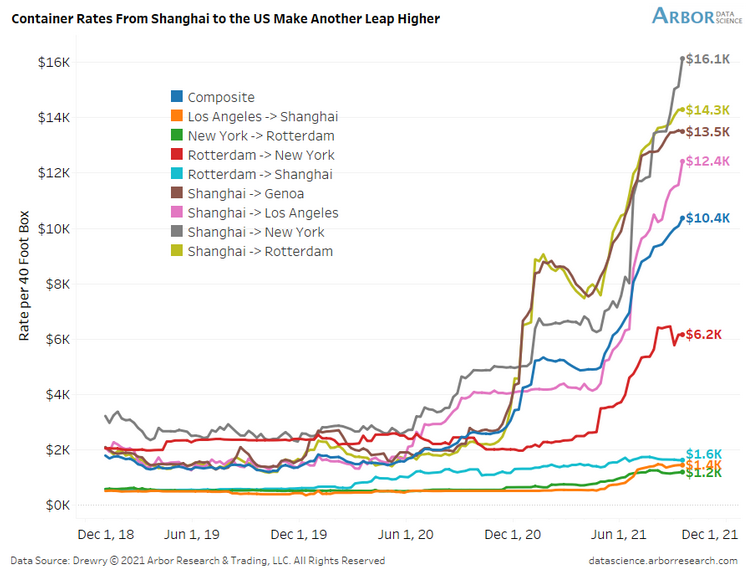
In any event, while I warned on several occasions that the composite container rate has gone from $6.5K to $8.1K to $8.4K to 9.4K, Powell finally admitted that the supply chain disruptions have “gotten worse:”
“Look at the car companies, look at the ships with the anchors down outside of Los Angeles,” he said. “This is really a mismatch between demand and supply, we need those supply blockages to alleviate, to abate, before inflation can come down.”
For context, the composite container rate is now at $10.4K (the blue line below):
To that point, with inflation surging and the Fed materially behind the eight ball, even the doves have turned hawkish since Powell unveiled his accelerated taper timeline on Sep. 22.
New York Fed President John Williams told the Economic Club of New York on Sep. 27:
“I think it’s clear that we have made substantial further progress on achieving our inflation goal. There has also been very good progress toward maximum employment. Assuming the economy continues to improve as I anticipate, a moderation in the pace of asset purchases may soon be warranted.”
Likewise, Fed Governor Lael Brainard added that labor-market conditions may “soon” warrant a reduction in the Fed’s bond-buying program:
“The forward guidance on maximum employment and average inflation sets a much higher bar for the liftoff of the policy rate than for slowing the pace of asset purchases,” Brainard told the National Association for Business Economics on Sep. 27. “I would emphasize that no signal about the timing of liftoff should be taken from any decision to announce a slowing of asset purchases.”
For context, she tried to calm investors’ nerves by separating rate hikes from tapering. However, with “a much higher bar” for “liftoff” implying a much lower bar for tapering, QE is likely on its deathbed.
Rounding out the hawkish rhetoric, Chicago Fed President Charles Evans also told the National Association for Business Economics on Sep. 27 that “I see the economy as being close to meeting the 'substantial further progress' standard we laid out last December. If the flow of employment improvements continues, it seems likely that those conditions will be met soon and tapering can commence.”
And why are these three voices so important?
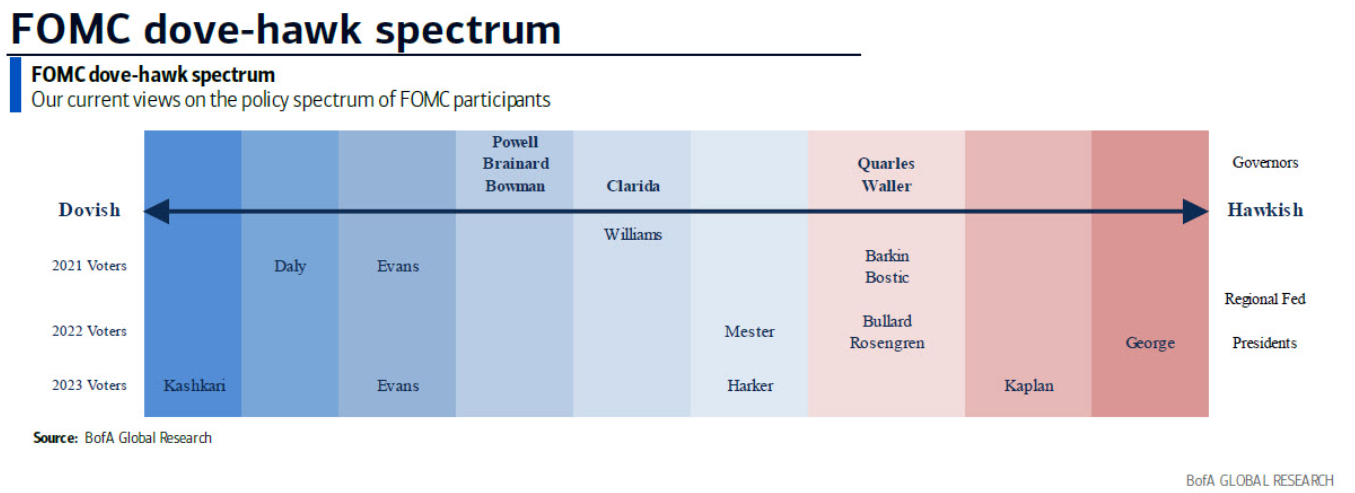
Well, with Powell ramping up the hawkish rhetoric on Sep. 22 and his dovish minions following suit, their messaging is much different than the hawk talk that we normally hear from Bullard, Kaplan and Rosengren. For context, the latter two actually resigned for ethical reasons after their questionable day trading activity became public.
Please see below:
To explain, the graphic above depicts Bank of America’s FOMC dove-hawk spectrum. From left to right, the blue areas categorize the doves, while the red areas categorize the hawks. If you analyze the third, fourth and fifth columns from the left, you can see that Evans, Powell, Brainard and Williams are known for their dovish dispositions. However, with all four materially shifting their stances in the last week, the hawkish realignments are bullish for U.S. Treasury yields, bullish for the USD Index and bearish for the PMs.
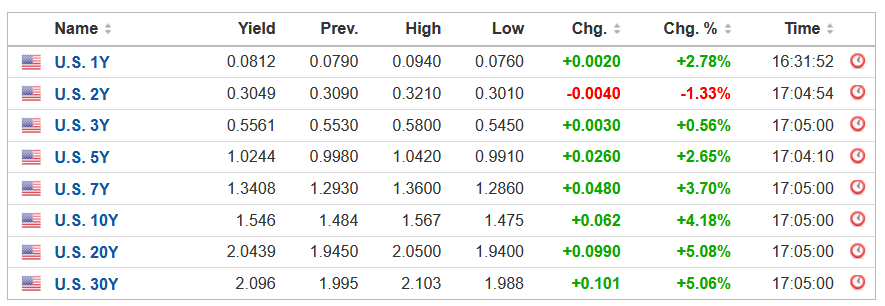
For example, the U.S. 10-Year Treasury yield has risen by 19% over the last five trading days. What’s more, the U.S. 5-Year Treasury yield has risen by 24% over the last seven trading days and ended the Sep. 28 session at a new 2021 high. For context, the last time the U.S. 5-Year Treasury yield closed above 1% was Feb. 27, 2020.
Please see below:
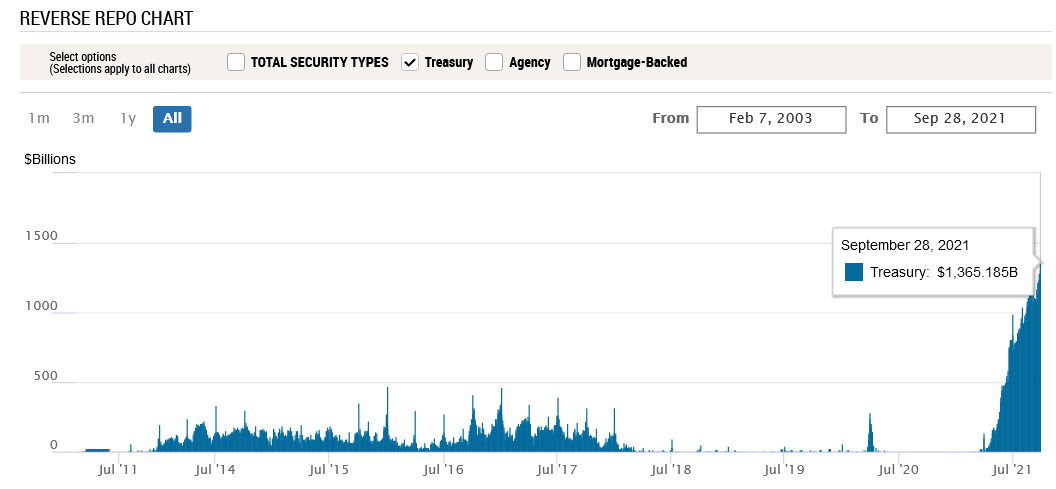
On the opposite end of the double-edged sword slashing the gold price, the USD index is also reasserting its dominance. And with the greenback’s fundamentals also uplifted by higher U.S. Treasury yields, the current (and future) liquidity drains support a stronger U.S. dollar. For one, after 83 counterparties drained more than $1.365 trillion out of the U.S. financial system on Sep. 28, the Fed’s daily reverse repurchase agreements hit another all-time high.
Please see below:
To explain, a reverse repurchase agreement (repo) occurs when an institution offloads cash to the Fed in exchange for a Treasury security (on an overnight or short-term basis). And with U.S. financial institutions currently flooded with excess liquidity, they’re shipping cash to the Fed at an alarming rate. And while I’ve been warning for months that the activity is the fundamental equivalent of a taper – due to the lower supply of U.S. dollars (which is bullish for the USD Index) – as we await a formal announcement from the Fed, the U.S. dollar’s fundamental foundation remains robust.
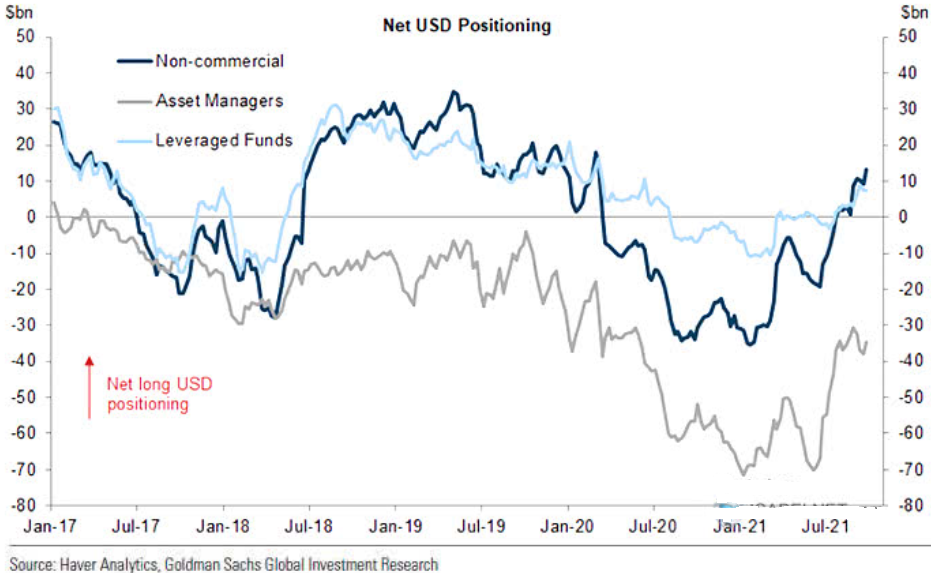
Second, non-commercial (speculative) futures traders, asset managers and leveraged funds’ allocations to the U.S. dollar remain strong.
Please see below:
To explain, the dark blue, gray, and light blue lines above represent net-long positions of non-commercial (speculative) futures traders, asset managers and leveraged funds. When the lines are falling, it means that the trio have reduced their net-long positions and are expecting a weaker U.S. dollar. Conversely, when the lines are rising, it means that the trio have increased their net-long positions and are expecting a stronger U.S. dollar. And while asset managers and leveraged funds’ allocations (the gray and light blue lines) remain slightly below their 2021 highs, non-commercial (speculative) futures traders’ allocation to the U.S. dollar has now hit a new 2021 high. As a result, a continuation of the theme should uplift the U.S. dollar and negatively impact the performance of the gold and silver prices.
Finally, with the EUR/USD accounting for nearly 58% of the movement of the USD Index, the currency pair has sunk below 1.1700 once again. And with the Fed’s inflationary conundrum dwarfing Europe’s predicament, I warned on Jul. 20 that the dichotomy is bullish for the U.S. dollar.
I wrote:
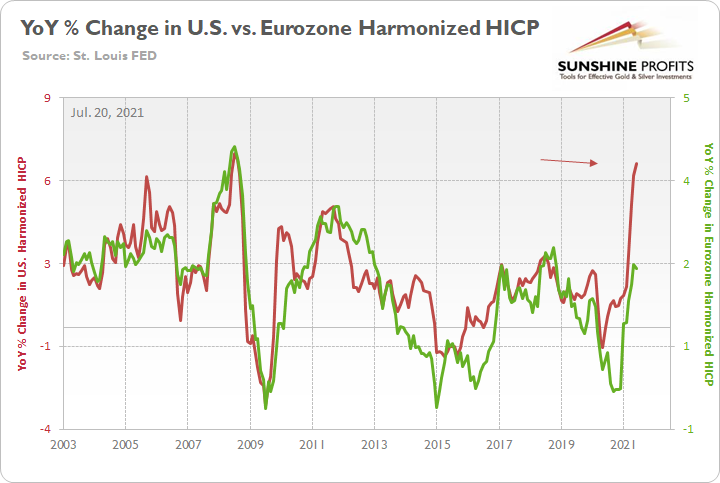
Not only is the U.S. economy outperforming the Eurozone, but the Fed and the ECB are worlds apart.
Please see below:
To explain, the green line above tracks the year-over-year (YoY) percentage change in the Eurozone Harmonized Index of Consumer Prices (HICP), while the red line above tracks the YoY percentage change in the U.S. HICP. If you analyze the right side of the chart, it’s not even close. And with the U.S. HICP rising by 6.41% YoY in June and the Eurozone HICP rising by 1.90%, the Fed is likely to taper well in advance of the ECB.
To that point, with the rhetoric above guiding the Fed down a hawkish path, the ECB is heading in the opposite direction. For example, ECB President Christine Lagarde said on Sep. 28 that there are “no signs that this increase in [Eurozone] inflation is becoming broad-based. The key challenge is to ensure that we do not overreact to transitory supply shocks that have no bearing on the medium term…. Monetary policy should normally ‘look through’ temporary supply-driven inflation, so long as inflation expectations remain anchored.”
As a result:
The bottom line? With U.S. Treasury yields and the USD Index firing on all cylinders, the PMs remain caught in the crossfire. And with both variables still having the fundamental wind at their backs, the Fed’s hawkish shift should help underwrite further gains over the medium term.
In conclusion, the PMs declined on Sep. 28 and the gold miners continued their underperformance. And with the Fed’s inflationary anxiety sparking a mini taper tantrum, the PMs remain stuck in no man’s land. Furthermore, with the general stock market also feeling the heat, a sharp correction could accelerate the ferocity of the PMs’ current downtrend. As a result, their medium-term outlooks remain quite bearish.
Thank you for reading our free analysis today. Please note that the above is just a small fraction of the full analyses that our subscribers enjoy on a regular basis. They include multiple premium details such as the interim targets for gold and silver that could be reached in the next few weeks. We invite you to subscribe now and read today’s issue right away.
Sincerely,
Przemyslaw Radomski, CFA
Founder, Editor-in-chief
Gold Investment News
Delivered To Your Inbox
Free Of Charge
Bonus: A week of free access to Gold & Silver StockPickers.
Gold Alerts
More-
Status
New 2024 Lows in Miners, New Highs in The USD Index
January 17, 2024, 12:19 PM -
Status
Soaring USD is SO Unsurprising – And SO Full of Implications
January 16, 2024, 8:40 AM -
Status
Rare Opportunity in Rare Earth Minerals?
January 15, 2024, 2:06 PM

