

Briefly: in our opinion, full (300% of the regular position size) speculative short positions in junior mining stocks are justified from the risk/reward point of view at the moment of publishing this Alert.
In yesterday’s analysis, I focused on the specific situation on the currency market and how it impacts gold. Today, I would like to focus on the link between gold and gold stocks.
In Tuesday’s analysis, I wrote the following:
In yesterday’s “Letters to the Editor” section, I wrote that, in my view, the chance of gold moving to $1,900 this week was less than 40%. I think it’s now – based on silver’s lack of outperformance and the PMs’ strength relative to the USD Index – closer to 50/50.
Still, please note that even if gold rallies here, it doesn’t mean that mining stocks must follow it to a major extent. If it’s the final part of the upswing, gold stocks are likely to underperform (while silver might outperform).
Silver didn’t outperform yesterday, but mining stocks already underperformed. Is this the beginning of the end of the relatively broad topping pattern? This could be the case. In fact, we saw something very similar in the GDX ETF earlier this year – in May.
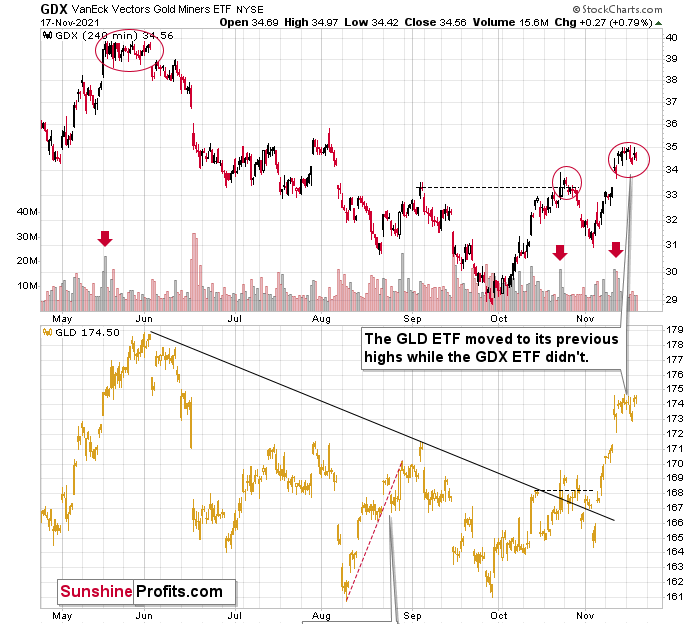
The May rally almost ended, when the GDX rallied on huge volume, but that was not the final top. The final top formed just a little higher several days later. However, during this flat top in the GDX ETF, the GLD ETF continued to move to new daily highs. In other words, mining stocks were weak relative to gold.
We just saw the same thing yesterday – gold miners didn’t move to its recent highs, even though gold did. This increases the odds that history is repeating itself and that the next big move will be to the downside, even though the short-term top might or might not be in at this time.
It seems quite likely (it’s not certain, though) that the final top in the miners is already behind us, but it might take a few days before the decline really picks up – just like what we saw in May and June.
Moreover, my previous comments on the analogies to previous huge-volume sessions in the GDX ETF remain up-to-date:
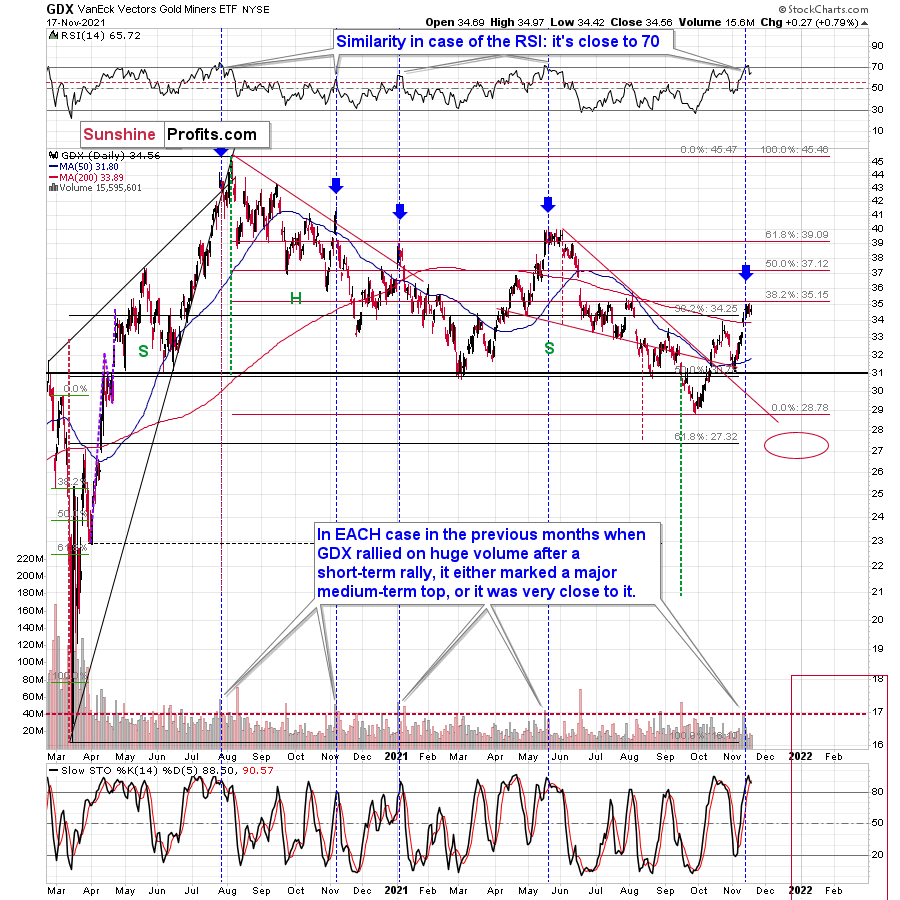
To explain, the GDX ETF rallied on huge volume on Nov. 11 and there were only 4 cases in the recent past when we saw something like that after a visible short-term rally.
In EACH of those 4 cases, the GDX was after a sharp daily rally.
In EACH of those 4 cases, the GDX-based RSI indicator (upper part of the chart above) was trading close to 70.
The rallies that immediately preceded these 4 cases:
- The July 27, 2020 session was immediately preceded by a 29-trading-day rally that took the GDX about 42% higher. It was 7 trading days before the final top (about 24% of the time).
- The November 5, 2020 session was immediately preceded by a 5-trading-day rally that took the GDX about 14%-15% higher (the high-volume day / the top). It was 1 trading day before the final top (20% of the time).
- The January 4, 2021 session was immediately preceded by a 26-trading-day rally that took the GDX about 17%-18% higher (the high-volume day / the top). It was 1 trading day before the final top (about 4% of the time).
- The May 17, 2021 session was immediately preceded by a 52-trading-day rally that took the GDX about 30% higher. It was 7 trading days before the final top (about 13% of the time).
So, as you can see these sessions have even more in common than it seemed at the first sight. The sessions formed soon before the final tops (4% - 24% of the time of the preceding rally before the final top), but the prices didn’t move much higher compared to how much they had already rallied before the high-volume sessions.
Consequently, since history tends to rhyme, we can expect the GDX ETF to move a bit higher here (but not significantly so) and we can expect this extra move higher to take between additional 0 to 7 trading days (based on the Nov. 12 session, so as of Nov. 18, it’s between 0 and 3 trading days). That is, if the final top didn’t form on Nov. 16.
Why 0 – 3 trading days (as of today – Nov. 18)? Because with the 4% timeline now in the rearview, the latter represents the updated 24% timeframe based on the preceding rally (that took 30 trading days).
Since it’s unlikely to take the mining stocks much higher, and the reversal could take place as soon as today, I don’t think that making adjustments to the current short positions in the mining stocks is justified from the risk to reward point of view.
Is there a meaningful resistance level that would be likely to trigger a decline in mining stocks? Yes! The GDX ETF is just below its 38.2% Fibonacci retracement level based on the August 2020 – September 2021 decline. The resistance is slightly above $35, so that’s when the final top could form.
As a result, those historical readings provided us with great shorting opportunities. And while I’m not increasing my short position, if I didn’t already have one in place, I would consider the current setup as offering a great risk-reward proposition.
Also, please note that we saw a fresh sell signal from the GDX-based Stochastic indicator.
Having said that, let’s take a look at the markets from a more fundamental point of view.
Demand Destruction
While I’ve been warning for months that inflation would come in much hotter than the Fed or market participants had expected, now, inflation is front-page news. However, amid the U.S. dollar’s recent surge, the commodities complex is sending an ominous warning to gold, silver, and mining stocks.
For example, copper prices are down by nearly 6% this week (as of the Nov. 17 close), while crude is down by more than 4% and natural gas is down by more than 11% over the last week and a half. And while I warned previously that the narrative of ‘hyperinflation’ is much more semblance than substance – due to the fact that perpetually higher prices eventually lead to demand destruction – the U.S. government’s war on inflation is intensifying.
To explain, I wrote on Nov. 11:
Surging inflation is now rattling The White House. Releasing a “Statement by President Biden on Today’s Economic News” on Nov. 10, an excerpt read:
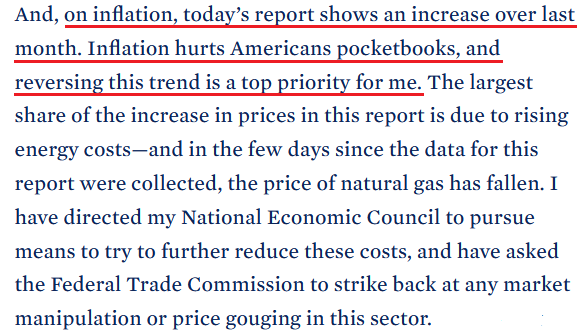 Source: The White House
Moreover, Biden added:
“I am travelling to Baltimore today to highlight how my Infrastructure Bill will bring down these costs, reduce these bottlenecks, and make goods more available and less costly. And I want to reemphasize my commitment to the independence of the Federal Reserve to monitor inflation, and take steps necessary to combat it.”
And firing another missile on Nov. 17, Biden wrote a letter to the U.S. Federal Trade Commission (FTC) that outlined accusations of “illegal conduct” and anti-consumer behavior by oil & gas companies. An excerpt read:
“The Federal Trade Commission has authority to consider whether illegal conduct is costing families at the pump. I believe you should do so immediately.
“I do not accept hard-working Americans paying more for gas because of anti-competitive or otherwise potentially illegal conduct. I, therefore, ask that the Commission further examine what is happening with oil and gas markets, and that you bring all of the Commission's tools to bear if you uncover any wrongdoing.”
For context, the U.S. Energy Department said that crude accounts for half of the cost of retail gasoline – with taxes, refining, transportation, and distribution making up the rest of the spread.
More importantly, though, with investors, the Fed, and The White House now realizing that inflation won’t abate on its own, the latter has gone on the offensive. And with its monetary counterpart poised to follow suit in the coming months, the PMs are caught in the crossfire.
To explain, surging inflation is a tax on consumers. And with perpetual price increases reducing consumers’ purchasing power, unabated inflation threatens to derail the U.S. economic recovery. As evidence, real average hourly earnings – which subtracts the inflation rate from the percentage change in U.S. average hourly earnings – decreased by 0.5% month-over-month (MoM) and 1.2% year-over-year (YoY) in October (the red boxes below).
Please see below:
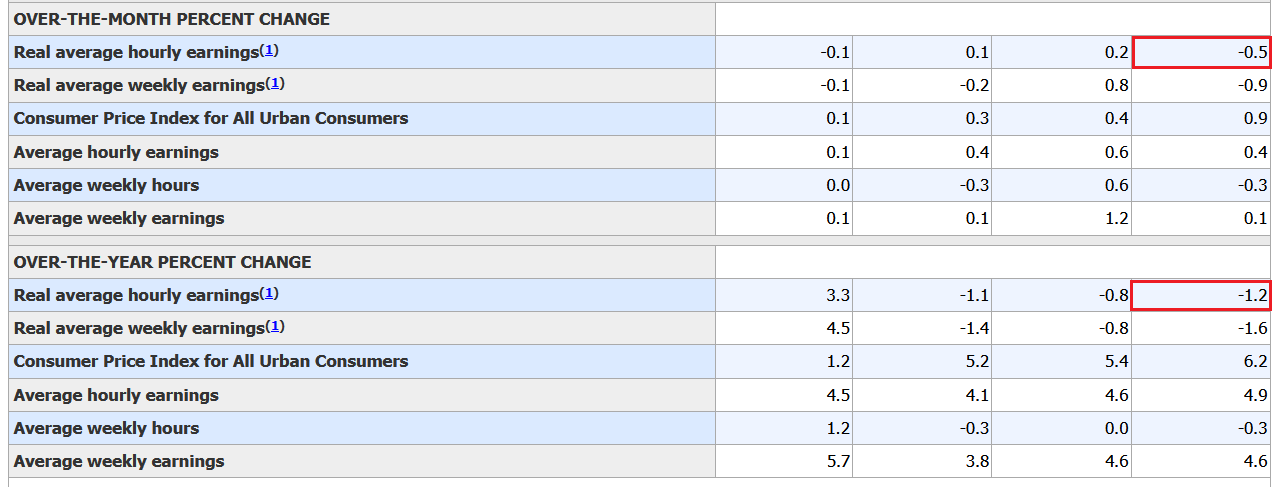 Source: U.S. Bureau of Labor Statistics (BLS)
In a nutshell: the data means that inflation is rising at a faster pace than average U.S. wages and consumers’ purchasing power has declined. For example, if average wages increase from $100 to $105, consumers are worse off if the average cost of goods increases from $100 to $106. Moreover, the longer this dynamic persists, the more it hurts the U.S. economic recovery.
Likewise, the University of Michigan released its Consumer Sentiment Index on Nov. 12. And with the index hitting a 10-year low, it’s no coincidence that The White House (and soon likely the Fed) has made inflation Public Enemy No. 1.
Please see below:
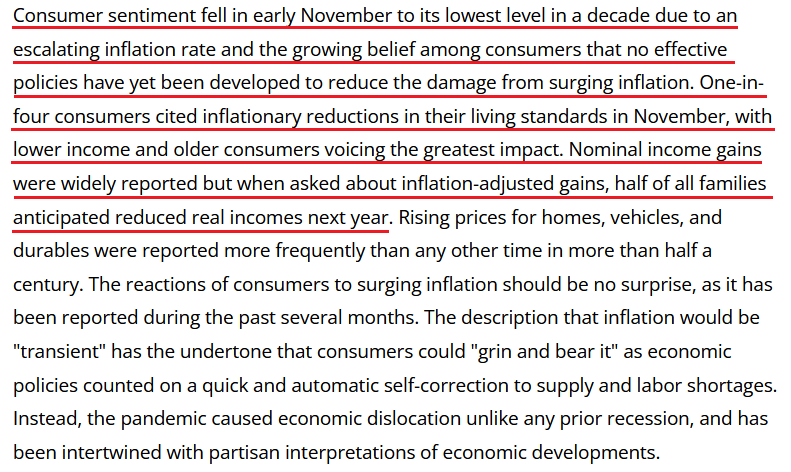 Source: the University of Michigan
Thus, the hyper-inflationists are missing the forest through the trees. In their argument, they assume that high U.S. debt levels make raising interest rates impossible. As a result, the U.S. government will allow inflation to run rampant and the U.S. dollar will crash in the process. However, while it’s an interesting story, it’s unrealistic. And why is that?
Well, for one, not raising interest rates will likely do more harm to the U.S. economy than tightening monetary policy. And the reasons are outlined above: if prices keep rising and consumer confidence keeps falling, eventually demand destruction unfolds. As a result, if policymakers don’t solve their inflationary conundrum, failure to do so will likely push the U.S. economy into recession.
Second, the political component shouldn’t be ignored. Biden’s approval ratings keep hitting new lows along with consumer confidence. Thus, is it in his best interest to maintain the status quo? Of course not. That’s why he’s been so forceful on inflation over the last few weeks. Essentially, if he (and/or the Fed) does nothing, he’ll likely lose the next presidential election and the Democrats will likely lose control of Congress. However, if he tames inflation, then he’s a hero. And left with those two options, which one do you think he’ll choose?
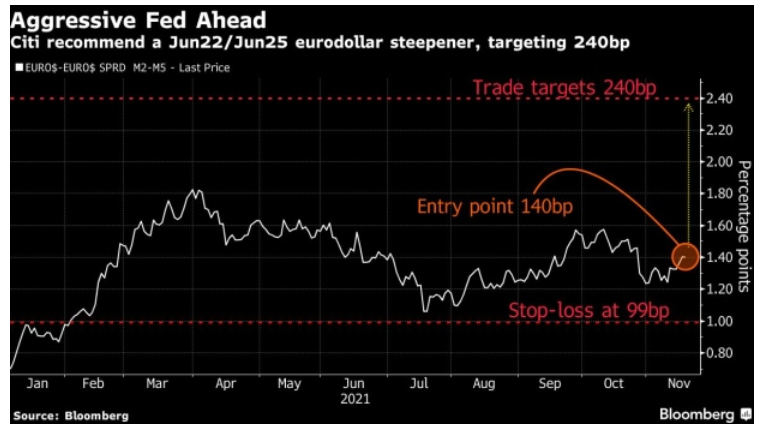
Third, the Fed has already tapered and FOMC officials’ hawkish rhetoric should accelerate in the coming months. To explain, Citigroup and Morgan Stanley expect a faster-tightening cycle once interest rate hikes begin (expected) in 2022. And on Nov. 17, Citigroup recommended a June 2022-June 2025 eurodollar steeper trade – a position that profits if additional rate hikes are priced into the U.S. yield curve.
“We think that as liftoff gets underway, the slope is likely to increase as some of the uncertainties around the global economy, such as supply-chain bottlenecks, start dissipating,” wrote Citigroup strategist Jabaz Mathai.
Currently, swap markets have priced in an 18 basis point rate hike – which is 72% of a typical 25 basis point rate hike – at the Fed’s June 2022 policy meeting. Thereafter, roughly 150 basis points – or six additional rate hikes – are expected by the end of 2025.
However, Citigroup’s trade predicts that the 140 basis points will turn into as much as 240 basis points by the end of 2025 (which implies roughly four more rate hikes than what’s currently priced in). Thus, with inflation now in Biden’s crosshairs, it won’t be surprising if the Fed pivots in the same direction.
Please see below:
Finally, with the Fed and the ECB warning about overvalued assets in their respective financial stability reviews, allowing inflation to sizzle will only increase investors’ bids for any and all inflation hedges. In turn, this will only enhance the stock market’s disconnect from fundamentals, and higher commodity prices will reinvigorate the cost-push inflationary spiral.
As a result, Goldman Sachs CEO David Solomon said on Nov. 17 that the liquidity-fueled circus is likely nearing its end.
“When I step back and think about my 40-year career, there have been periods of time when greed has far outpaced fear. We are in one of those periods. My experience says those periods aren't long-lived. Something will rebalance it and bring a little bit more perspective. And given it feels like inflation is running above trend, chances are interest rates will move up and that will take some of the exuberance out of certain markets.”
The bottom line? While the PMs remain upbeat for now, their fundamental outlooks continue to deteriorate. And while some investors assume that hyperinflation will crash the U.S. economy, policymakers understand this. As a result, avoiding that catastrophe is now on their radar. And while copper and crude have already noticed it, it’s likely only a matter of time before the PMs realize this as well.
In conclusion, the PMs rallied on Nov. 17 and their upbeat attitudes continued to shine through. However, with the fundamental narrative that’s underpinning their strength likely to collapse, their prices should suffer a similar fate. As a result, the medium-term outlook still remains bearish and lower lows should materialize over the next few months.
Overview of the Upcoming Part of the Decline
- It seems to me that the current corrective upswing in gold is about to be over soon, and the next short-term move lower is about to begin. Since it seems to be another short-term move more than it seems to be a continuation of the bigger decline, I think that junior miners would be likely to (at least initially) decline more than silver.
- It seems that the first stop for gold will be close to its previous 2021 lows, slightly below $1,700. Then it will likely correct a bit, but it’s unclear if I want to exit or reverse the current short position based on that – it depends on the number and the nature of the bullish indications that we get at that time.
- After the above-mentioned correction, we’re likely to see a powerful slide, perhaps close to the 2020 low ($1,450 - $1,500).
- If we see a situation where miners slide in a meaningful and volatile way while silver doesn’t (it just declines moderately), I plan to – once again – switch from short positions in miners to short positions in silver. At this time, it’s too early to say at what price levels this could take place, and if we get this kind of opportunity at all – perhaps with gold close to $1,600.
- I plan to exit all remaining short positions when gold shows substantial strength relative to the USD Index while the latter is still rallying. This might take place with gold close to $1,350 - $1,400. I expect silver to fall the hardest in the final part of the move. This moment (when gold performs very strongly against the rallying USD and miners are strong relative to gold after its substantial decline) is likely to be the best entry point for long-term investments, in my view. This might also happen with gold close to $1,375, but it’s too early to say with certainty at this time. I expect the final bottom to take place near the end of the year, perhaps in mid-December. It is not set in stone that PMs have to bottom at that time. If not then, then early 2022 would become a likely time target.
- As a confirmation for the above, I will use the (upcoming or perhaps we have already seen it?) top in the general stock market as the starting point for the three-month countdown. The reason is that after the 1929 top, gold miners declined for about three months after the general stock market started to slide. We also saw some confirmations of this theory based on the analogy to 2008. All in all, the precious metals sector is likely to bottom about three months after the general stock market tops. The additional confirmation will come from the tapering schedule, as markets are likely to move on the rumor and reverse on the fact as they tend to do in general.
- The above is based on the information available today, and it might change in the following days/weeks.
You will find my general overview of the outlook for gold on the chart below:
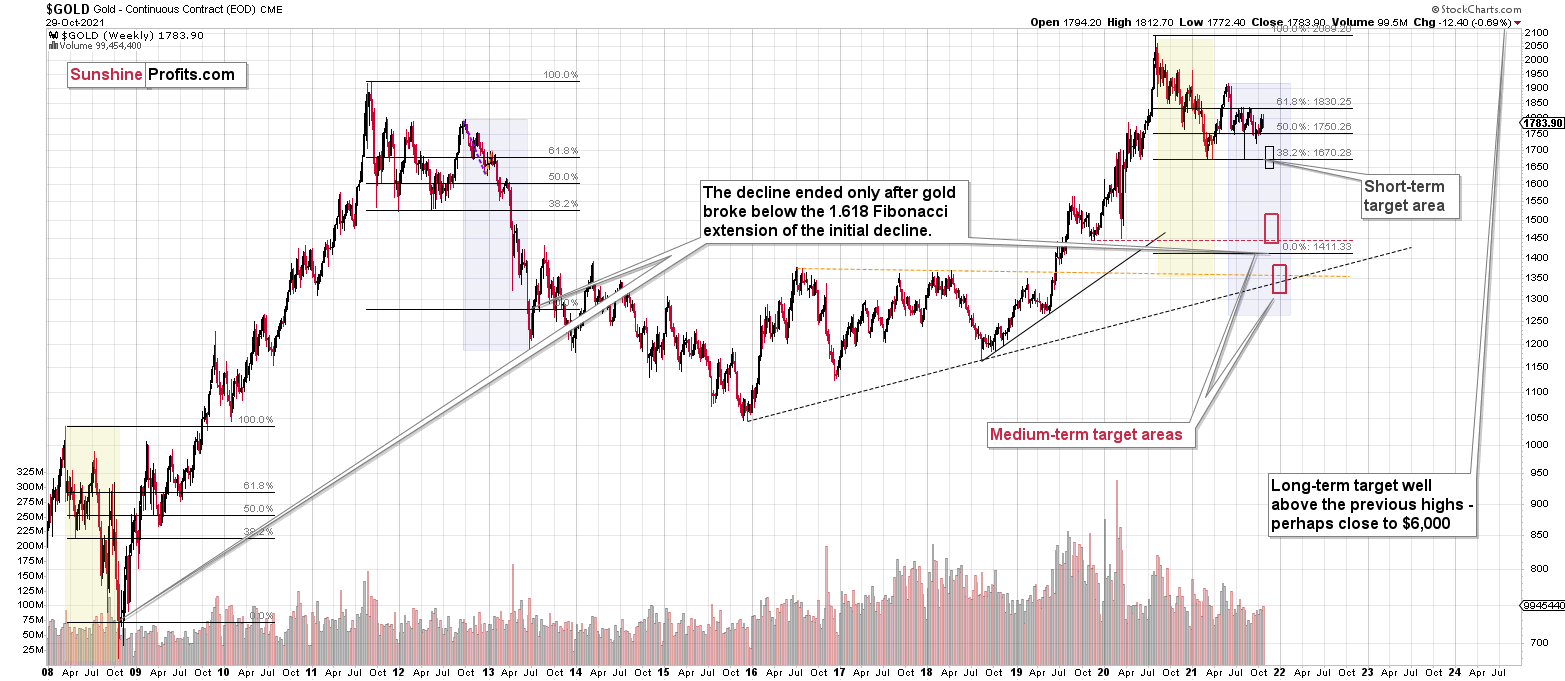
Please note that the above timing details are relatively broad and “for general overview only” – so that you know more or less what I think and how volatile I think the moves are likely to be – on an approximate basis. These time targets are not binding or clear enough for me to think that they should be used for purchasing options, warrants, or similar instruments.
Summary
The PMs rallied last week, and their momentum has teetered on euphoria. However, when prices diverge from fundamentals, sharp sell-offs often occur when sentiment shifts. As a result, caution is warranted, and the PMs’ recent bout of optimism will likely end in disappointment. This disappointment could start within the next few days, based on analogies to very similar cases in mining stocks. The decline in the GDX could start right away or once it moves to or slightly above $35, quite likely in 0 – 3 trading days. That is, if the top didn’t form on Nov. 16.
Since it seems that the PMs are likely about to start another short-term move lower more, I think that junior miners would be likely to (at least initially) decline more than silver.
From the medium-term point of view, the key two long-term factors remain the analogy to 2013 in gold and the broad head and shoulders pattern in the HUI Index. They both suggest much lower prices ahead.
It seems that our profits from the short positions are going to become truly epic in the following months.
After the sell-off (that takes gold to about $1,350 - $1,500), I expect the precious metals to rally significantly. The final part of the decline might take as little as 1-5 weeks, so it's important to stay alert to any changes.
Most importantly, please stay healthy and safe. We made a lot of money last March and this March, and it seems that we’re about to make much more on the upcoming decline, but you have to be healthy to enjoy the results.
As always, we'll keep you - our subscribers - informed.
By the way, we’re currently providing you with the possibility to extend your subscription by a year, two years, or even three years with a special 20% discount. This discount can be applied right away, without the need to wait for your next renewal – if you choose to secure your premium access and complete the payment upfront. The boring time in the PMs is definitely over, and the time to pay close attention to the market is here. Naturally, it’s your capital, and the choice is up to you, but it seems that it might be a good idea to secure more premium access now while saving 20% at the same time. Our support team will be happy to assist you in the above-described upgrade at preferential terms – if you’d like to proceed, please contact us.
To summarize:
Trading capital (supplementary part of the portfolio; our opinion): Full speculative short positions (300% of the full position) in junior mining stocks are justified from the risk to reward point of view with the following binding exit profit-take price levels:
Mining stocks (price levels for the GDXJ ETF): binding profit-take exit price: $35.73; stop-loss: none (the volatility is too big to justify a stop-loss order in case of this particular trade)
Alternatively, if one seeks to leverage, we’re providing the binding profit-take levels for the JDST (2x leveraged) and GDXD (3x leveraged – which is not suggested for most traders/investors due to the significant leverage). The binding profit-take level for the JDST: $16.18; stop-loss for the JDST: none (the volatility is too big to justify an SL order in case of this particular trade); binding profit-take level for the GDXD: $32.08; stop-loss for the GDXD: none (the volatility is too big to justify an SL order in case of this particular trade).
For-your-information targets (our opinion; we continue to think that mining stocks are the preferred way of taking advantage of the upcoming price move, but if for whatever reason one wants/has to use silver or gold for this trade, we are providing the details anyway.):
Silver futures downside profit-take exit price: $19.12
SLV profit-take exit price: $17.72
ZSL profit-take exit price: $41.38
Gold futures downside profit-take exit price: $1,683
HGD.TO – alternative (Canadian) inverse 2x leveraged gold stocks ETF – the upside profit-take exit price: $12.48
HZD.TO – alternative (Canadian) inverse 2x leveraged silver ETF – the upside profit-take exit price: $30.48
Long-term capital (core part of the portfolio; our opinion): No positions (in other words: cash
Insurance capital (core part of the portfolio; our opinion): Full position
Whether you already subscribed or not, we encourage you to find out how to make the most of our alerts and read our replies to the most common alert-and-gold-trading-related questions.
Please note that we describe the situation for the day that the alert is posted in the trading section. In other words, if we are writing about a speculative position, it means that it is up-to-date on the day it was posted. We are also featuring the initial target prices to decide whether keeping a position on a given day is in tune with your approach (some moves are too small for medium-term traders, and some might appear too big for day-traders).
Additionally, you might want to read why our stop-loss orders are usually relatively far from the current price.
Please note that a full position doesn't mean using all of the capital for a given trade. You will find details on our thoughts on gold portfolio structuring in the Key Insights section on our website.
As a reminder - "initial target price" means exactly that - an "initial" one. It's not a price level at which we suggest closing positions. If this becomes the case (like it did in the previous trade), we will refer to these levels as levels of exit orders (exactly as we've done previously). Stop-loss levels, however, are naturally not "initial", but something that, in our opinion, might be entered as an order.
Since it is impossible to synchronize target prices and stop-loss levels for all the ETFs and ETNs with the main markets that we provide these levels for (gold, silver, and mining stocks - the GDX ETF), the stop-loss levels and target prices for other ETNs and ETF (among other: UGL, GLL, AGQ, ZSL, NUGT, DUST, JNUG, JDST) are provided as supplementary, and not as "final". This means that if a stop-loss or a target level is reached for any of the "additional instruments" (GLL for instance), but not for the "main instrument" (gold in this case), we will view positions in both gold and GLL as still open and the stop-loss for GLL would have to be moved lower. On the other hand, if gold moves to a stop-loss level but GLL doesn't, then we will view both positions (in gold and GLL) as closed. In other words, since it's not possible to be 100% certain that each related instrument moves to a given level when the underlying instrument does, we can't provide levels that would be binding. The levels that we do provide are our best estimate of the levels that will correspond to the levels in the underlying assets, but it will be the underlying assets that one will need to focus on regarding the signs pointing to closing a given position or keeping it open. We might adjust the levels in the "additional instruments" without adjusting the levels in the "main instruments", which will simply mean that we have improved our estimation of these levels, not that we changed our outlook on the markets. We are already working on a tool that would update these levels daily for the most popular ETFs, ETNs, and individual mining stocks.
Our preferred ways to invest in and to trade gold along with the reasoning can be found in the how to buy gold section. Furthermore, our preferred ETFs and ETNs can be found in our Gold & Silver ETF Ranking.
As a reminder, Gold & Silver Trading Alerts are posted before or on each trading day (we usually post them before the opening bell, but we don't promise to do that each day). If there's anything urgent, we will send you an additional small alert before posting the main one.
Thank you.
Przemyslaw Radomski, CFA
Founder, Editor-in-chief

