

Briefly: in our opinion, full (300% of the regular position size) speculative short positions in junior mining stocks are justified from the risk/reward point of view at the moment of publishing this Alert.
Let’s start today’s analysis with what I wrote in yesterday’s intraday Gold & Silver Trading Alert:
While the entire recent rally was not YET invalidated, the breakout in the GDX ETF above the declining black resistance line (that you can see on the chart in today’s regular Gold & Silver Trading Alert) was just invalidated.
The GDX price jumped back up, but this looks like an intraday technical bounce, nothing more.
The above is particularly bearish in light of what I already wrote about in today’s regular Gold & Silver Trading Alert: gold’s weekly triangle-vertex-based reversal, and huge-volume-based indications from GLD and GDX. Both were likely to reverse rather sooner than later, and it seems that the turnaround is already behind us.
If it’s not, then it’s unlikely that the really would continue. Instead, we could still see another attempt to move back to the previous highs, similarly to what we saw in mid-November 2021. However, given the recent “attack schedule” provided by the U.S. (tomorrow), which is very likely not to be realized, it seems that any additional rally would be very short-lived.
Either way, it seems that this week marks the turnaround, and whatever happens within the next 1-2 days will be the beginning of a much bigger decline.
The GDX ETF moved up some more, and it ended the day above the declining black resistance line.
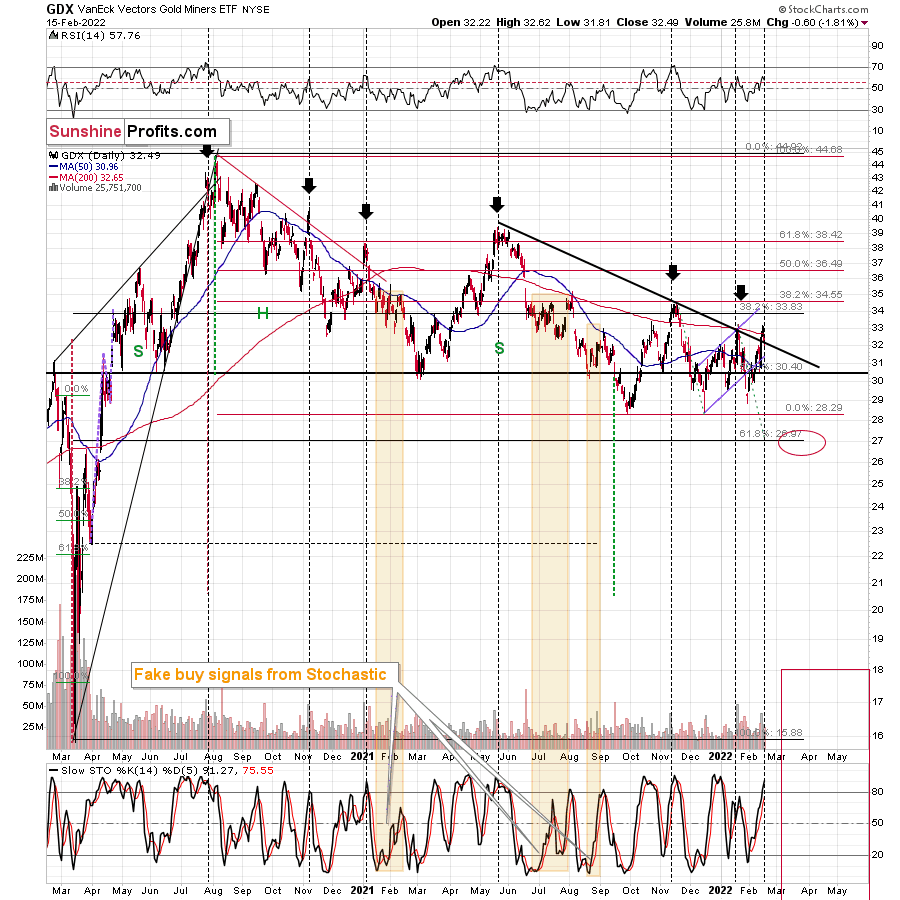
Consequently, the breakout was not invalidated in terms of the daily closing prices. Still, the part that I put in bold remains up-to-date. Just because gold miners declined only moderately yesterday doesn’t mean that it’s the end of the declines.
The attack on Ukraine was “scheduled for today’, and it’s getting more and more obvious that there won’t be any attack, as Russia withdrew some of its troops after completing the military drill.
After today, it will likely be completely obvious that the “scheduled attack” just didn’t materialize, and thus precious metals will have a good reason to give away the recent tension-based gains.
Technically, this means that the breakout above the declining black resistance/support line is likely to be invalidated shortly, and it’s likely to be followed by another sharp slide – similarly to what we saw in the final part of January.
My previous technical comments on the above chart remain up-to-date:
Big daily rallies on big volume in mining stocks (GDX) tend to take place at the end of a given short-term upswing or close to it. For example, we saw that on Nov. 10, 2021, Aug. 27, 2021, Jul. 29, 2021, May 17, 2021, and Jan. 19, 2021.
These were good shorting, not buying opportunities. It’s rather unlikely that right now – AFTER the daily rally on huge volume – we are at a favorable moment to go long or to close the short positions. It seems much more likely that we are in a situation where short positions are even more justified from the risk-to-reward point of view.
What should one do about this upswing? As always, the decision is up to you – it’s your money. I’m not doing anything with my short position in junior mining stocks. If I didn’t already have it in place (at my desired – significant – size), I would have either entered this short position or added to it.
All in all, we saw a rally, but it’s unlikely to be the start of a bigger rally. Instead, it’s likely that what we saw was either the final part of the corrective upswing that started in mid-December, 2021, or it’s close to the final part of the corrective upswing. Either way, I think that the short position in the junior mining stocks remains justified from the risk-to-reward point of view.
Also, let’s keep in mind that the geopolitical tensions are likely to only have a temporary effect on precious metals prices and that the current tensions around Ukraine are likely very exaggerated and likely close to “peak concern” (and thus a concern-based price peak).
Both gold and gold stocks have reached their respective resistance levels created by the previous highs, which makes a turnaround even more likely. Please note that while gold stocks reached their previous 2022 highs, gold moved to new 2022 highs and stopped at its late-2021 highs. In other words, gold stocks are underperforming gold, which is a bearish sign.
My yesterday’s comments on gold’s weekly chart remain up-to-date as well:
Moving back to the markets, if the tensions are very high and we have a make-or-break date, then if there’s no attack tomorrow (Feb. 16), then the tensions will start to subside. Sure, some people might say that the attack could take place in a week or next week, but after such a date is provided and proven false, all following dates will have less meaning. Therefore, it seems that the peak of concern is right now or that it will culminate tomorrow.
This is very interesting, because it perfectly fits the technical picture that we had known in advance. Namely, there are triangle-vertex-based turning points in mid- and late-February, and we are already in the second half of the month, still close to it. Consequently, a reversal here would be a perfect fit.
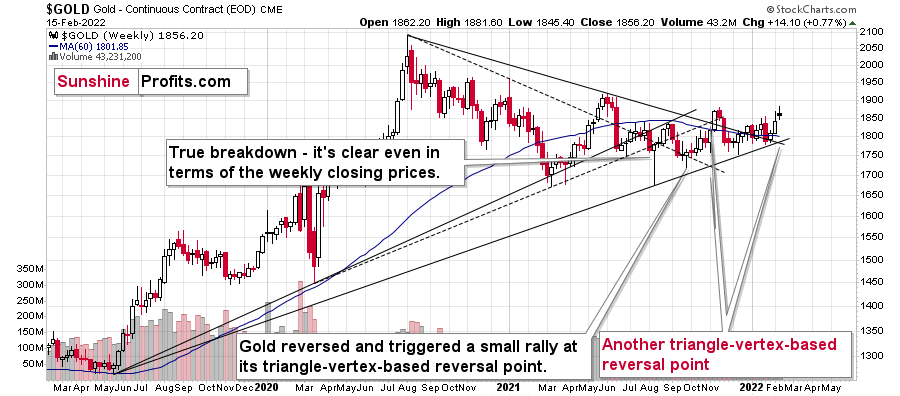
The vertex is based on two long-term lines that are, in turn, based on very important price extremes. This means that the reversal itself is too likely to have important implications.
As there’s no doubt as to what the direction of the previous move was (up, of course), it’s also clear what the implications of a reversal would be. They would be bearish and likely be followed by a decline in gold.
The GLD ETF chart shows that gold declined after it failed to rally above its late-2021 highs, but that the market is not yet confident about the decline – thus gold stayed above the January highs.
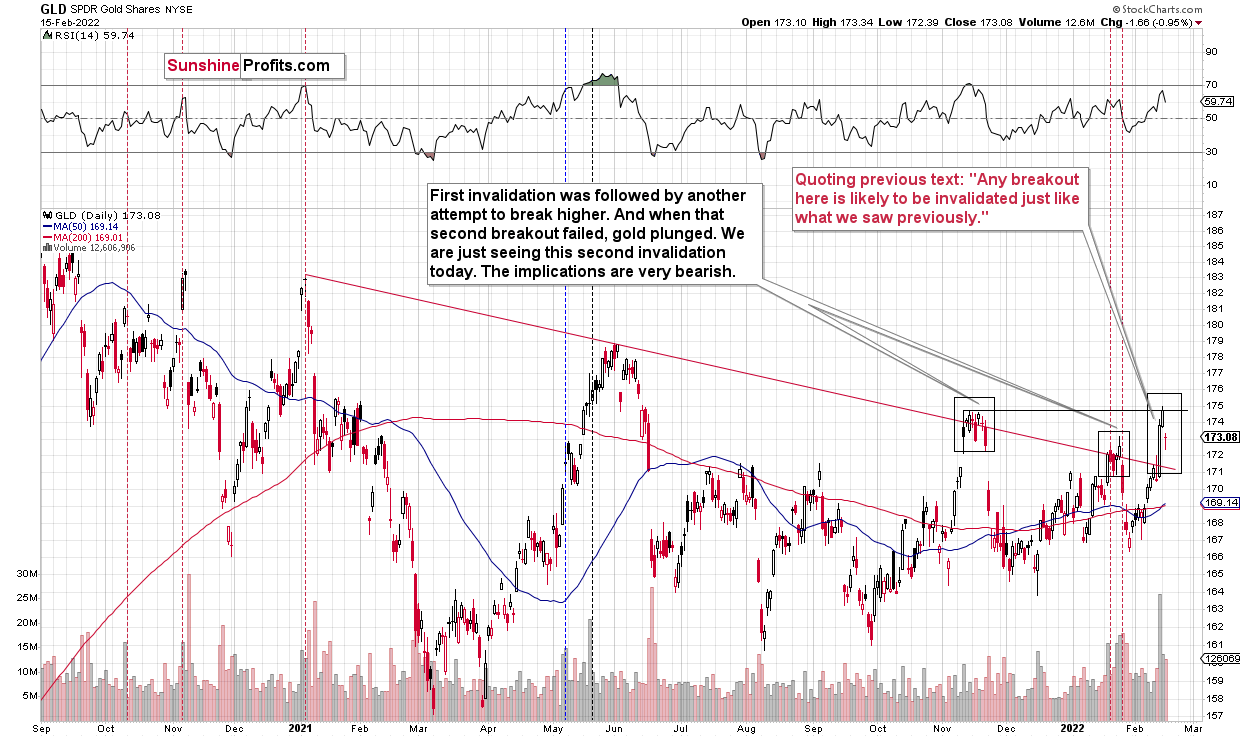
Still, my previous comments on GLD’s huge volume remain up-to-date and so do their bearish implications:
The volume during Friday’s rally was huge, but is it really bullish? Let’s consider what happened in previous cases when we saw GLD rally in big volumes.
I marked those cases with vertical dashed lines. The red ones were great shorting opportunities, and the black ones had rather mixed implications.
Of the 7 cases, 5 of them were good shorting opportunities, and only two of them had rather mixed implications.
Yes, the GLD ETF moved higher on strong volume in early- and mid-May 2021, but in the first case it was a short-term top, and in the second case it was relatively close to a medium-term top.
Overall, with 5 out of 7 cases being bearish, 2 of them being unclear, and none of them being clearly bullish, the implications of Friday’s “strong performance” are actually bearish, not bullish. Looking at first sight might be encouraging, but it’s also likely misleading.
Especially since we have the same indication – from volume – in the case of the mining stocks.
The USD Index declined yesterday, which might explain why gold, silver, and mining stocks haven’t declined more.
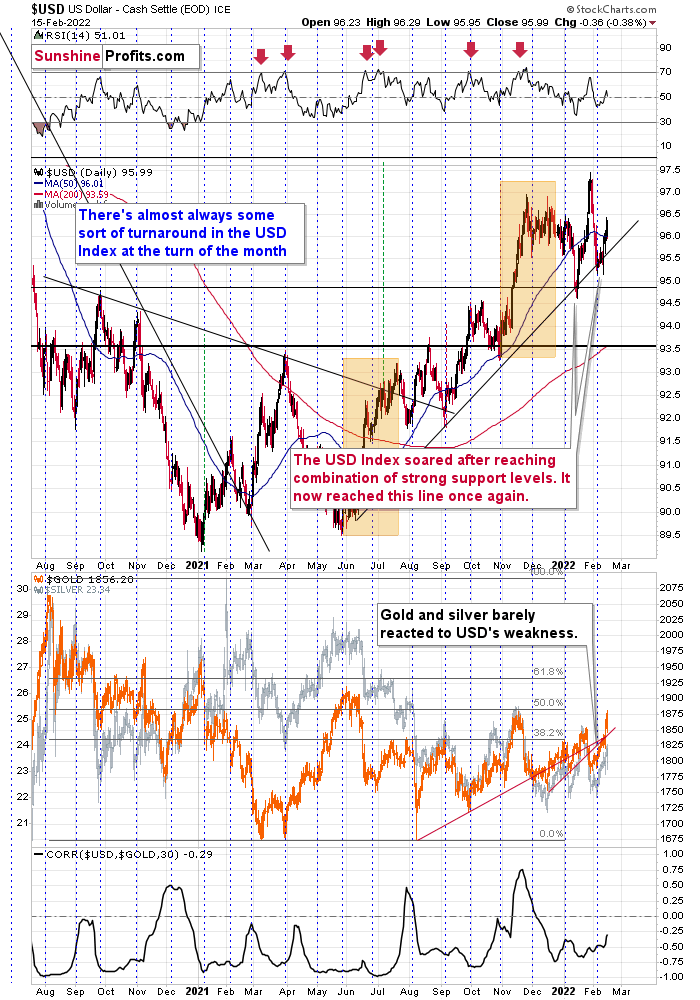
Still, that daily decline didn’t change the medium-term trend, which remains up. This, plus the fact that the USDX is close to its medium-term support, tells us that the downside is likely very limited, while the upside for the USD Index is likely significant.
This, in turn, means that the precious metals sector is likely to decline significantly in the future, as it tends to move in the opposite direction to the USD Index.
The last several months might make one think that the above rule is no longer in place, but please keep in mind that these are specific times from the technical point of view. Gold is stuck in a wide triangle, just like it was the case between 2011 and 2013.
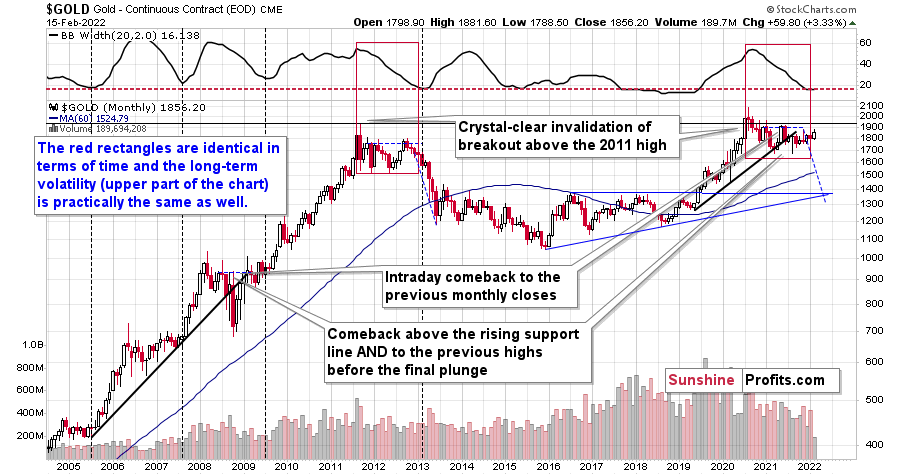
Just as gold ultimately declined back then – and declined profoundly, catching up for the previous stagnation – the same is likely to take place this time.
The width of the Bollinger bands is as low as it was when gold started its massive slide in 2013. You can see it in the upper part of the above chart. As a reminder, the width of the bands gets wider when the moves are volatile, and it gets narrower during stagnation. The thing is that when things get too stagnant for a long time, they then tend to catch up with lots of volatility, thus surprising most investors (those who don’t pay attention to volatility and indicators based on it, that is).
Theoretically, this should work for both declines and rallies, but based on multiple other long- and medium-term oriented factors that I’m discussing today and that I’ve been discussing in the flagship Gold & Silver Trading Alerts (here’s a link to the most recent one), it seems that the next huge move will be to the downside.
Also, silver declined quite visibly yesterday, but it remained above its 50-day moving average.
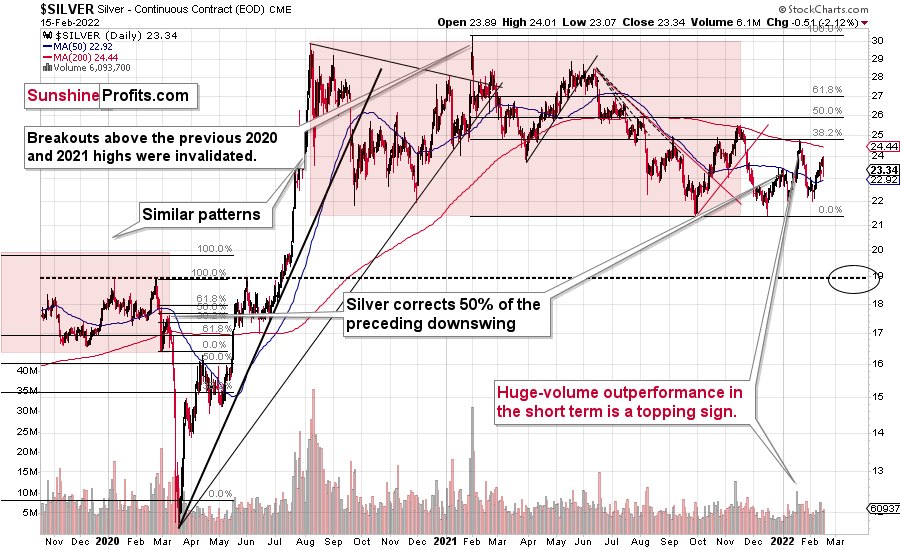
This fits the performance of gold and gold stocks. Namely, the entire sector is hesitating, not sure what’s going on.
When the dust settles (and there’s no invasion of Ukraine), the previous medium-term trends are likely to resume – and the medium-term trend in the precious metals sector is currently down.
Having said that, let’s take a look at the markets from a more fundamental point of view.
Back to Business
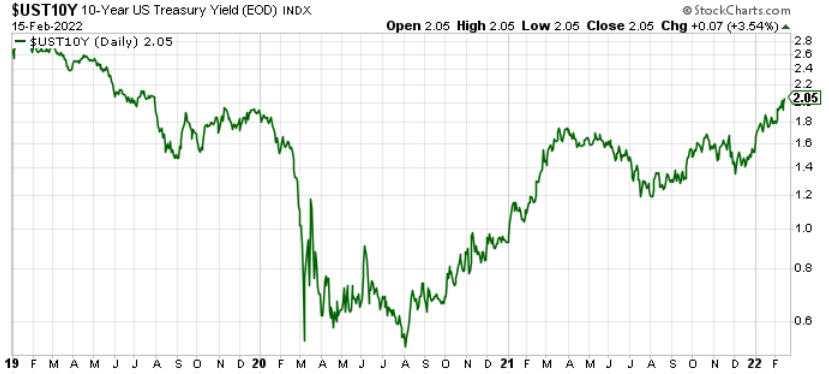
While the Russia-Ukraine conflict remains a wild card as the news fluctuates, the hype died down on Feb. 15. For example, with Russia calling some of its troops back after completing their “drills,” the geopolitical risks fizzled. With that, the PMs’ rallies fizzled. Moreover, as cooler heads prevailed, the U.S. 10-Year Treasury yield closed at a new 2022 high.
Please see below:
In addition, with bond market liquidity stuck in a downtrend, the rapid moves in interest rates that we witnessed in 2022 could cause more fundamental problems for the precious metals. For example, Bloomberg’s U.S. Government Securities Liquidity Index – which gauges bond yields’ deviations from a fair-value model – is at levels that coincide with large daily swings. Moreover, market breadth – which is calculated by analyzing the size of bids and offers for U.S. Treasuries – has also fallen materially.
Please see below:
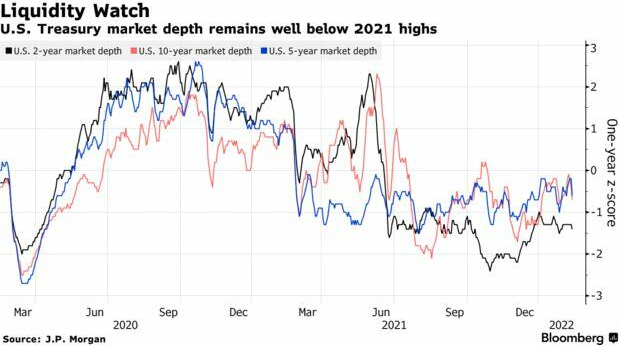
To explain, the black, blue, and pink lines above track the market breadth for the U.S. 2-Year, 5-Year, and 10-Year Treasuries. If you analyze the downtrend, you can see that the size of bids and offers has shrunk over the last several months. As a result, when sell orders hit the market and buyers are nowhere to be found, the prices of U.S. Treasuries plummet and yields increase. Thus, if the activity continues when surging inflation has investors extremely skittish, more mini taper tantrums could erupt in the coming weeks.
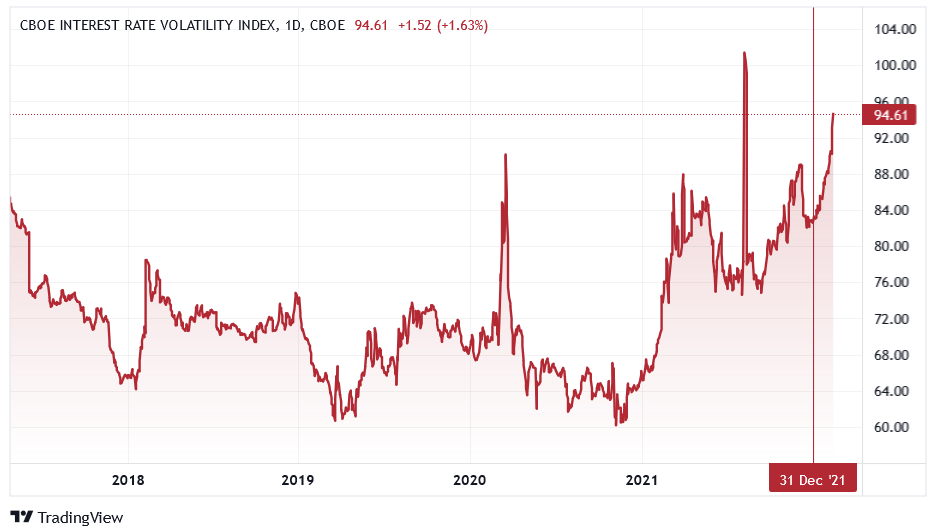
As further evidence, the Cboe Interest Rate Volatility Index (SRVIX) – which uses options on swaps to gauge risk – has rallied hard in 2022. Moreover, the index has surpassed its 2020 highs and only remains below the spike we witnessed in August 2021. As a result, there is plenty of anxiety in the bond market right now.
Please see below:
Headlining the recent uncertainty, the Fed’s next monetary policy meeting is only one month away (Mar. 15/16). Moreover, the date also coincides with a new release of the Fed’s Summary of Economic Projections (SEP). As a result, with inflation’s inability to settle down rattling the Fed and investors, hawkish policy is needed to calm the pricing pressures.
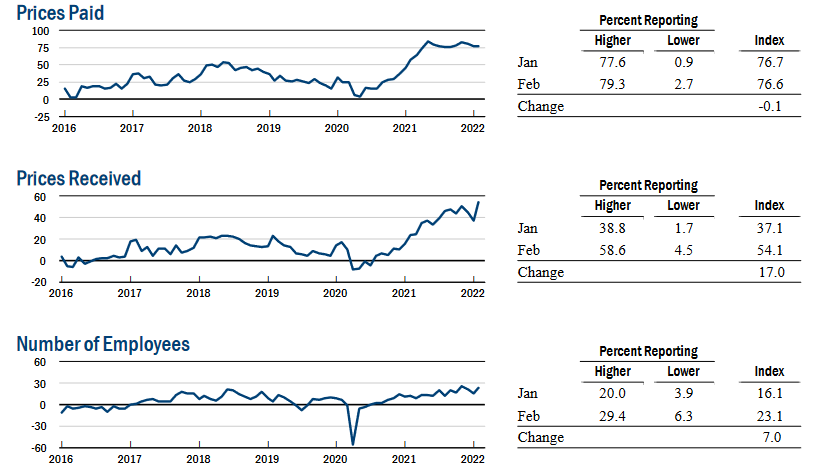
To that point, the New York Fed released its Empire State Manufacturing Index on Feb. 15. While the headline index increased from -0.70 in January to 3.10 in February, the report revealed:
“The index for number of employees climbed seven points to 23.1, indicating solid gains in employment levels, and the average workweek index held steady at 10.9. The prices paid index was little changed at 76.6, while the prices received index rose a steep seventeen points to a record high of 54.1, signaling ongoing substantial increases in both input prices and selling prices.”
As a result, the Fed’s dual mandate (employment and inflation) has been achieved in New York State, and the data supports a hawkish response from the central bank in March.
Please see below:
 Source: New York Fed
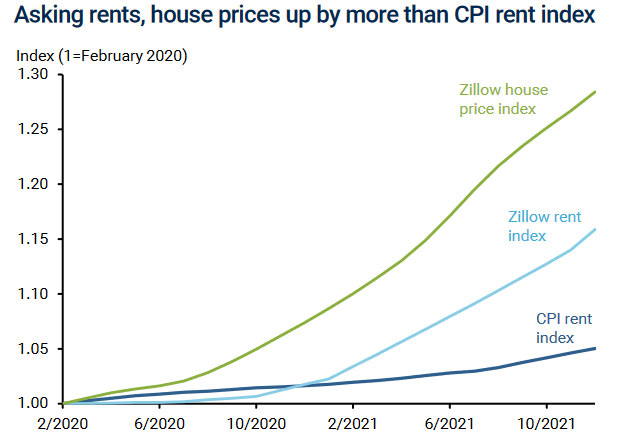
Likewise, the San Francisco Fed released an Economic Letter on rent inflation on Feb. 14. The report revealed:
“Current CPI rent inflation is positively correlated with 1-year lagged Zillow house price inflation, indicating that MSAs with higher Zillow house price inflation in one year are more likely to have higher rent inflation over the following year.”
As a result, the researchers concluded:
“The extraordinarily large increases in two leading indicators of future rent inflation – asking rent inflation and house price inflation – point to significant upside risks to the overall inflation outlook. The potential increases are particularly significant for CPI inflation, which places a larger weight on shelter costs. Still, the potential additions to PCE inflation of about 0.5pp for both 2022 and 2023 are important to consider in light of the Federal Reserve’s 2% inflation target.”
Please see below:
 Source: San Francisco Fed
To explain, the green and light blue lines above track Zillow’s house price and rent indexes, while the dark blue line above tracks the CPI rent index. As you can see, Zillow’s data has materially outperformed the U.S. government’s data since the pandemic struck. As a result, with historical Zillow data often predicting future government data, rent inflation is likely far from its peak, and the headline CPI should remain elevated, putting more pressure on the Fed.
To that point, while the “transitory” camp initially blamed used cars, airfares and hotel accommodations for the inflationary surge, the reality is that pricing pressures have broadened in recent months. Along the way, the percentage of CPI constituents tracking above the Fed’s 2% annual target continues to expand.
Please see below:
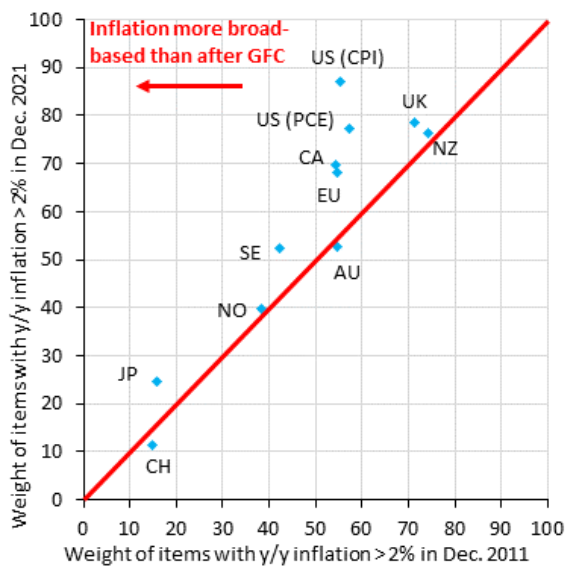 Source: Institute of International Finance (IIF)/Robin Brooks
To explain, the blue diamonds above track the regions and the percentage of their components tracking inflation above 2%. For context, the post-global financial crisis (GFC) data is plotted on the x-axis, the current data is plotted on the y-axis, and the upward-sloping red line depicts the linear trend.
If you analyze the blue diamond at the top half of the middle of the chart labeled “US (CPI),” you can see that nearly 90% of CPI components are tracking above 2%. Conversely, in December 2011 (post-GFC), the figure was closer to 55%. As a result, not only is U.S. inflation outperforming the rest of the world, but it’s also outperforming the precedent set following the GFC. Thus, the Fed has little reason not to raise interest rates in March.
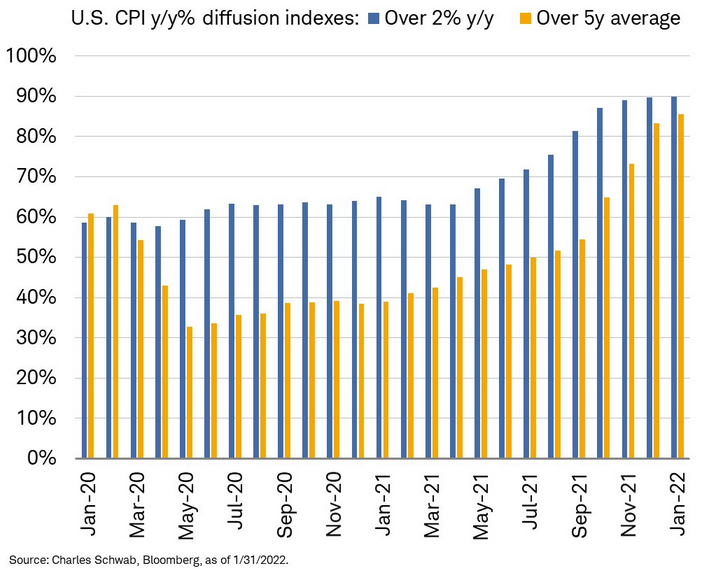
Also noteworthy, Charles Schwab presents the same data for the U.S. chronologically. If you analyze the chart below, you can see that the percentage of components that are tracking inflation above 2% (the blue bars) and the percentage of components above their five-year averages (the orange bars) have been increasing for the last several months. Moreover, with both metrics at or approaching 90% in January 2022, it’s a far cry from the roughly 60% we witnessed in January 2020.
Finally, while the data above presents a bird’s eye view of the inflation story, the merry-go-round continues to circulate on the ground. For example, Restaurant Brands International (RBI) released its fourth-quarter earnings on Feb. 15. For context, RBI is the parent company of Burger King, Tim Hortons, Popeyes, and Firehouse Subs. Despite beating estimates on both the top and bottom lines, CFO Matthew Dunnigan said during the conference call:
“Similar to what others across the industry have noted, we saw a significant increase in commodity volatility as we progress through the quarter, leading to elevated levels of inflation that have similar pass-through effects on both our revenue and expense lines.”
Moreover, CEO Jose Cil added:
“In Canada as well as in the U.S., we've tended to price in line with CPI, and CPI in Canada is – has been probably in '21, about half or even slightly below half of what we've seen in the U.S.”
However, with Cil not waiting for the Fed to solve the problem, he said:
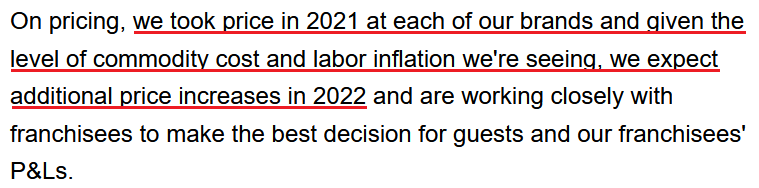 Source: RBI/Seeking Alpha
The bottom line? While the Russia-Ukraine conflict will likely weigh on markets until there is a definitive resolution, the PMs’ fundamental outlooks continue to worsen as the “peak concern” seems to be behind us. With inflation and employment holding firm, there is little stopping the Fed from raising interest rates. With U.S. Treasury nominal and real yields poised to move higher, history shows that the PMs often move in the opposite direction. As a result, while they remain uplifted, for the time being, sentiment should shift over the medium term.
In conclusion, the PMs declined on Feb. 15, as they gave back some of their geopolitical-risk-induced gains. While the USD Index also suffered, the fundamentals hurting the PMs (a hawkish Fed and higher U.S. Treasury yields) support a stronger greenback. As such, once the Russia-Ukraine conflict is no longer the main driver of the financial markets, the PMs and the USD Index will likely go their separate ways.
Overview of the Upcoming Part of the Decline
- It seems to me that the corrective upswing is now over, and that gold, silver, and mining stocks are now likely to continue their medium-term decline.
- It seems that the first (bigger) stop for gold will be close to its previous 2021 lows, slightly below $1,700. Then it will likely correct a bit, but it’s unclear if I want to exit or reverse the current short position based on that – it depends on the number and the nature of the bullish indications that we get at that time.
- After the above-mentioned correction, we’re likely to see a powerful slide, perhaps close to the 2020 low ($1,450 - $1,500).
- If we see a situation where miners slide in a meaningful and volatile way while silver doesn’t (it just declines moderately), I plan to – once again – switch from short positions in miners to short positions in silver. At this time, it’s too early to say at what price levels this could take place, and if we get this kind of opportunity at all – perhaps with gold close to $1,600.
- I plan to exit all remaining short positions once gold shows substantial strength relative to the USD Index while the latter is still rallying. This may be the case with gold close to $1,350 - $1,400. I expect silver to fall the hardest in the final part of the move. This moment (when gold performs very strongly against the rallying USD and miners are strong relative to gold after its substantial decline) is likely to be the best entry point for long-term investments, in my view. This can also happen with gold close to $1,375, but at the moment it’s too early to say with certainty.
- As a confirmation for the above, I will use the (upcoming or perhaps we have already seen it?) top in the general stock market as the starting point for the three-month countdown. The reason is that after the 1929 top, gold miners declined for about three months after the general stock market started to slide. We also saw some confirmations of this theory based on the analogy to 2008. All in all, the precious metals sector is likely to bottom about three months after the general stock market tops.
- The above is based on the information available today, and it might change in the following days/weeks.
You will find my general overview of the outlook for gold on the chart below:
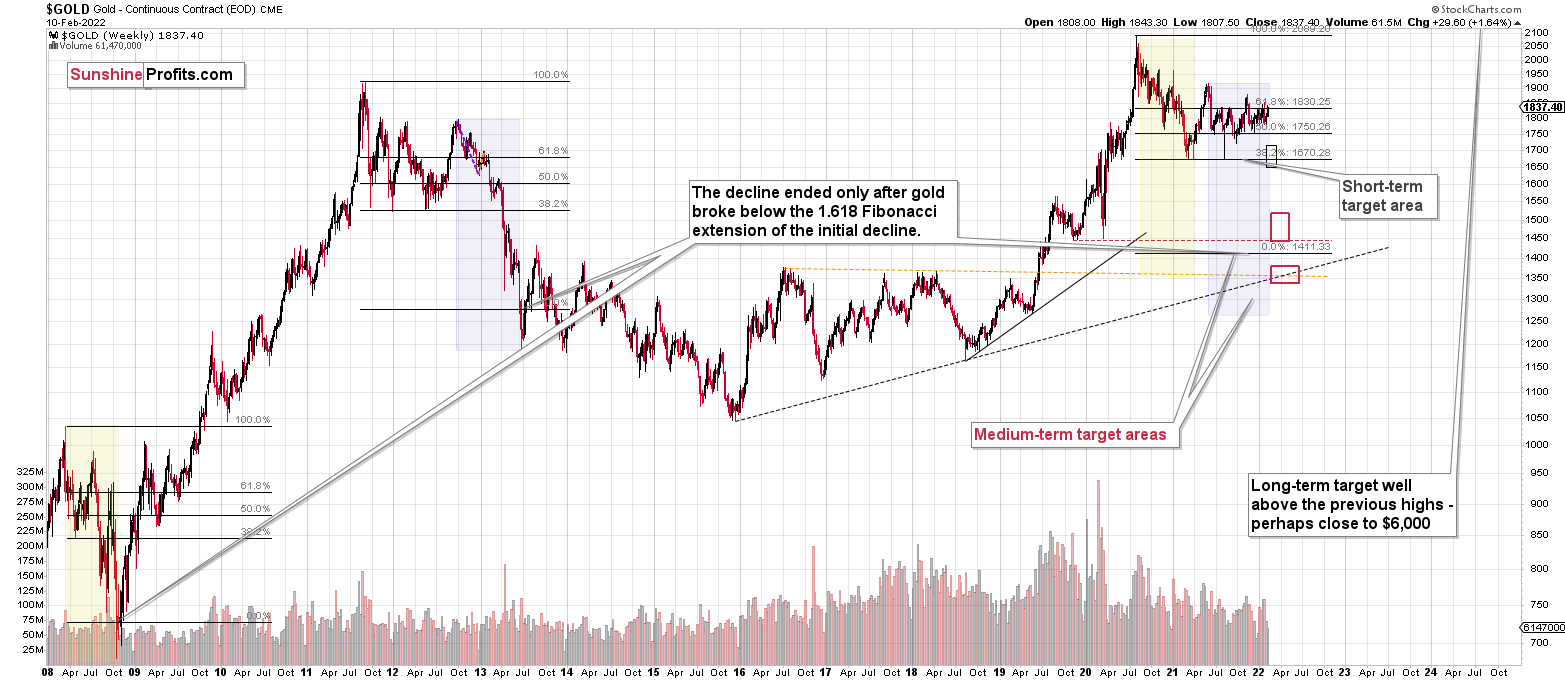
Please note that the above timing details are relatively broad and “for general overview only” – so that you know more or less what I think and how volatile I think the moves are likely to be – on an approximate basis. These time targets are not binding or clear enough for me to think that they should be used for purchasing options, warrants or similar instruments.
Letters to the Editor
Q: When should I short GDXJ?
A: I can’t tell you what and when you should do with your money, as that would be investment advice and I’m not providing such.
However, I can tell you when I think it would be the best moment to be shorting GDXJ in general (it’s not directed at you, specifically, because I don’t know your unique circumstances) – and that moment is “now”. If that moment wasn’t “now,” I would be writing about closing the existing short positions and re-opening them at some other date.
Please note that the “Briefly” opening paragraph confirms the above too:
Briefly: in our opinion, full (300% of the regular position size) speculative short positions in junior mining stocks are justified from the risk/reward point of view at the moment of publishing this Alert.
It doesn’t say anything about adding to one’s positions, because multiple people will read that and some of them already have significant positions (which shouldn’t be increased further). I’m simply stating what’s up-to-date on a given day. To clarify even further – from my point of view, if I didn’t have a short position in junior miners, I’d open a short position right now. However, I do have it, so I’m not doing anything with it at this time.
Summary
Summing up, it seems to me that the corrective upswing is over, or that we won’t have to wait too long for it to be over. Let’s keep in mind that there are triangle-vertex-based reversals in mid- and late-February, so even if we see more back-and-forth trading soon, it’s likely that the decline resumes later this month.
I continue to think that junior mining stocks are currently likely to decline the most out of all the parts of the precious metals sector.
From the medium-term point of view, the two key long-term factors remain the analogy to 2013 in gold and the broad head and shoulders pattern in the HUI Index. They both suggest much lower prices ahead.
It seems that our profits from the short positions are going to become truly epic in the coming months.
After the sell-off (that takes gold to about $1,350 - $1,500), I expect the precious metals to rally significantly. The final part of the decline might take as little as 1-5 weeks, so it's important to stay alert to any changes.
Most importantly, please stay healthy and safe. We made a lot of money last March and this March, and it seems that we’re about to make much more on the upcoming decline, but you have to be healthy to enjoy the results.
As always, we'll keep you - our subscribers - informed.
To summarize:
Trading capital (supplementary part of the portfolio; our opinion): Full speculative short positions (300% of the full position) in junior mining stocks are justified from the risk to reward point of view with the following binding exit profit-take price levels:
Mining stocks (price levels for the GDXJ ETF): binding profit-take exit price: $34.63; stop-loss: none (the volatility is too big to justify a stop-loss order in case of this particular trade)
Alternatively, if one seeks leverage, we’re providing the binding profit-take levels for the JDST (2x leveraged) and GDXD (3x leveraged – which is not suggested for most traders/investors due to the significant leverage). The binding profit-take level for the JDST: $14.98; stop-loss for the JDST: none (the volatility is too big to justify a SL order in case of this particular trade); binding profit-take level for the GDXD: $25.48; stop-loss for the GDXD: none (the volatility is too big to justify a SL order in case of this particular trade).
For-your-information targets (our opinion; we continue to think that mining stocks are the preferred way of taking advantage of the upcoming price move, but if for whatever reason one wants / has to use silver or gold for this trade, we are providing the details anyway.):
Silver futures downside profit-take exit price: $19.12
SLV profit-take exit price: $17.72
ZSL profit-take exit price: $38.28
Gold futures downside profit-take exit price: $1,683
HGD.TO – alternative (Canadian) inverse 2x leveraged gold stocks ETF – the upside profit-take exit price: $11.79
HZD.TO – alternative (Canadian) inverse 2x leveraged silver ETF – the upside profit-take exit price: $29.48
Long-term capital (core part of the portfolio; our opinion): No positions (in other words: cash
Insurance capital (core part of the portfolio; our opinion): Full position
Whether you already subscribed or not, we encourage you to find out how to make the most of our alerts and read our replies to the most common alert-and-gold-trading-related-questions.
Please note that we describe the situation for the day that the alert is posted in the trading section. In other words, if we are writing about a speculative position, it means that it is up-to-date on the day it was posted. We are also featuring the initial target prices to decide whether keeping a position on a given day is in tune with your approach (some moves are too small for medium-term traders, and some might appear too big for day-traders).
Additionally, you might want to read why our stop-loss orders are usually relatively far from the current price.
Please note that a full position doesn't mean using all of the capital for a given trade. You will find details on our thoughts on gold portfolio structuring in the Key Insights section on our website.
As a reminder - "initial target price" means exactly that - an "initial" one. It's not a price level at which we suggest closing positions. If this becomes the case (like it did in the previous trade), we will refer to these levels as levels of exit orders (exactly as we've done previously). Stop-loss levels, however, are naturally not "initial", but something that, in our opinion, might be entered as an order.
Since it is impossible to synchronize target prices and stop-loss levels for all the ETFs and ETNs with the main markets that we provide these levels for (gold, silver and mining stocks - the GDX ETF), the stop-loss levels and target prices for other ETNs and ETF (among other: UGL, GLL, AGQ, ZSL, NUGT, DUST, JNUG, JDST) are provided as supplementary, and not as "final". This means that if a stop-loss or a target level is reached for any of the "additional instruments" (GLL for instance), but not for the "main instrument" (gold in this case), we will view positions in both gold and GLL as still open and the stop-loss for GLL would have to be moved lower. On the other hand, if gold moves to a stop-loss level but GLL doesn't, then we will view both positions (in gold and GLL) as closed. In other words, since it's not possible to be 100% certain that each related instrument moves to a given level when the underlying instrument does, we can't provide levels that would be binding. The levels that we do provide are our best estimate of the levels that will correspond to the levels in the underlying assets, but it will be the underlying assets that one will need to focus on regarding the signs pointing to closing a given position or keeping it open. We might adjust the levels in the "additional instruments" without adjusting the levels in the "main instruments", which will simply mean that we have improved our estimation of these levels, not that we changed our outlook on the markets. We are already working on a tool that would update these levels daily for the most popular ETFs, ETNs and individual mining stocks.
Our preferred ways to invest in and to trade gold along with the reasoning can be found in the how to buy gold section. Furthermore, our preferred ETFs and ETNs can be found in our Gold & Silver ETF Ranking.
As a reminder, Gold & Silver Trading Alerts are posted before or on each trading day (we usually post them before the opening bell, but we don't promise doing that each day). If there's anything urgent, we will send you an additional small alert before posting the main one.
Thank you.
Przemyslaw Radomski, CFA
Founder, Editor-in-chief

