

Briefly: in our opinion, full (300% of the regular position size) speculative short positions in junior mining stocks are justified from the risk/reward point of view at the moment of publishing this Alert.
The tensions around Ukraine continue, and now there’s even a supposedly “scheduled attack date – Feb. 16”. You can read how the Ukrainian sources comment on that in this Reuters article. They find the attack unlikely. It’s very much in tune with what we wrote to you in January. This article mentions also how the financial markets were affected, and that significant money flows are involved. Without any real conflict – something already happened. Perhaps that was the real reason for all these tensions, and perhaps it was something else, like Putin’s show of power. If this sounds unrealistic, please keep in mind that there are many even more “modern” tactics used to influence another country and that they have indeed been used.
Also, here’s something that I found on the Internet that might help to look at the situation
more objectively.
Moving back to the markets, if the tensions are very high and we have a make-or-break date, then if there’s no attack tomorrow (Feb. 16), then the tensions will start to subside. Sure, some people might say that the attack could take place in a week or next week, but after such a date is provided and proven false, all following dates will have less meaning. Therefore, it seems that the peak of concern is right now or that it will culminate tomorrow.
This is very interesting, because it perfectly fits the technical picture that we had known in advance. Namely, there are triangle-vertex-based turning points in mid- and late-February, and we are already in the second half of the month, still close to it. Consequently, a reversal here would be a perfect fit.
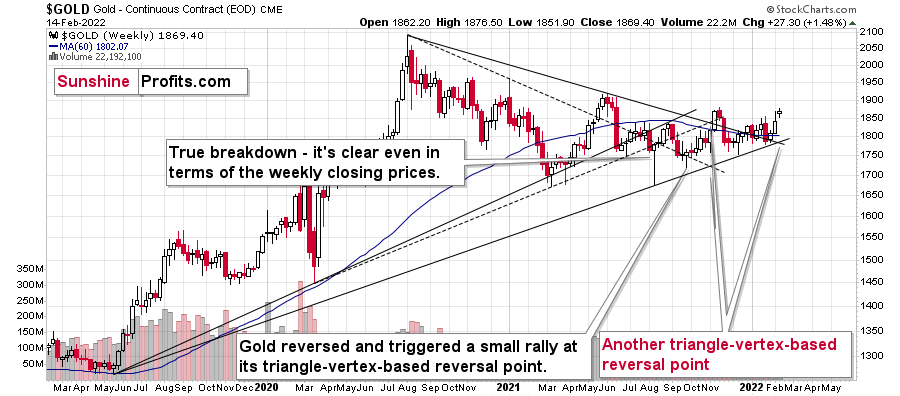
The vertex is based on two long-term lines that are, in turn, based on very important price extremes. This means that the reversal itself is too likely to have important implications.
As there’s no doubt as to what the direction of the previous move was (up, of course), it’s also clear what the implications of a reversal would be. They would be bearish and likely be followed by a decline in gold.
Gold is down $17 so far in today’s pre-market trading, which means that the top might already be in.
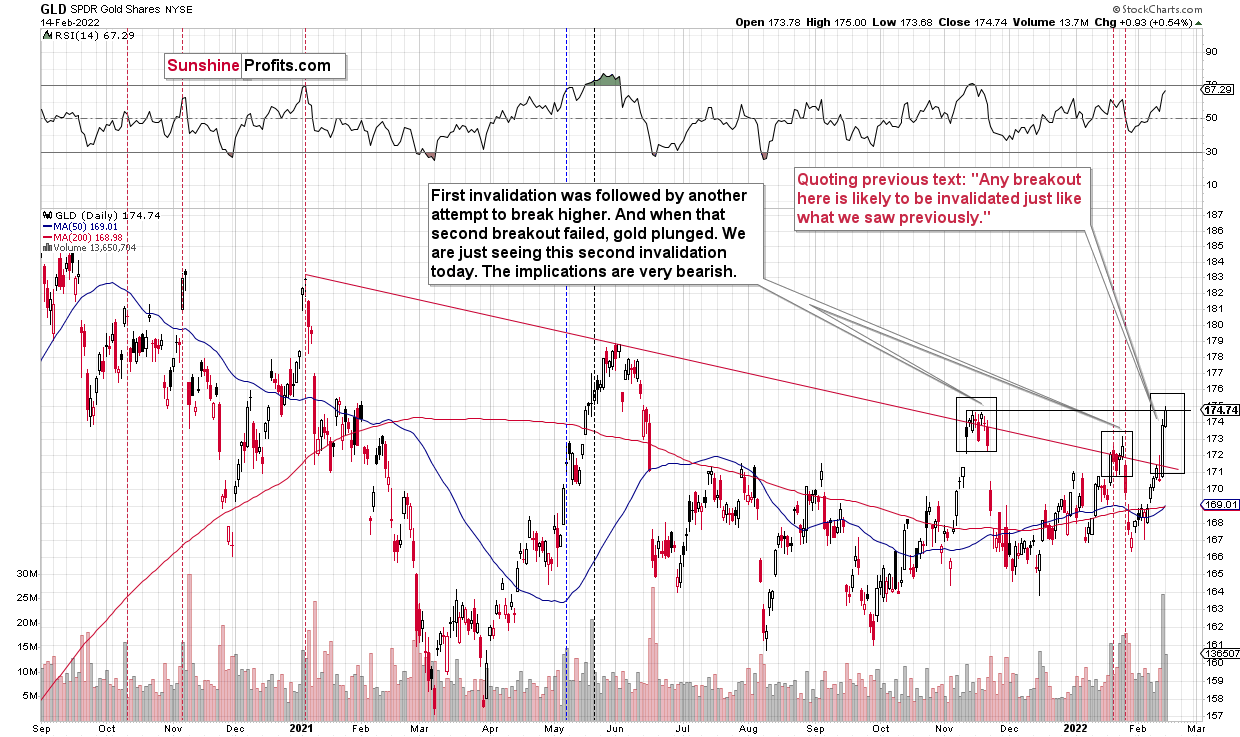
The situation in the GLD ETF has been indicating a reversal as well. The ETF approached its declining medium-term resistance line, and I previously wrote that any breakout here was likely to be invalidated, as we saw earlier in November 2021 and January 2022.
Indeed, we saw a breakout, but it’s very unlikely to hold ground. Instead, a decline either immediately or after the top later this week, and a decline shortly thereafter, are much more likely.
The volume during Friday’s rally was huge, but is it really bullish? Let’s consider what happened in previous cases when we saw GLD rally in big volumes.
I marked those cases with vertical dashed lines. The red ones were great shorting opportunities, and the black ones had rather mixed implications.
Of the 7 cases, 5 of them were good shorting opportunities, and only two of them had rather mixed implications.
Yes, the GLD ETF moved higher on strong volume in early- and mid-May 2021, but in the first case it was a short-term top, and in the second case it was relatively close to a medium-term top.
Overall, with 5 out of 7 cases being bearish, 2 of them being unclear, and none of them being clearly bullish, the implications of Friday’s “strong performance” are actually bearish, not bullish. Looking at first sight might be encouraging, but it’s also likely misleading.
Especially since we have the same indication – from volume – in the case of the mining stocks.
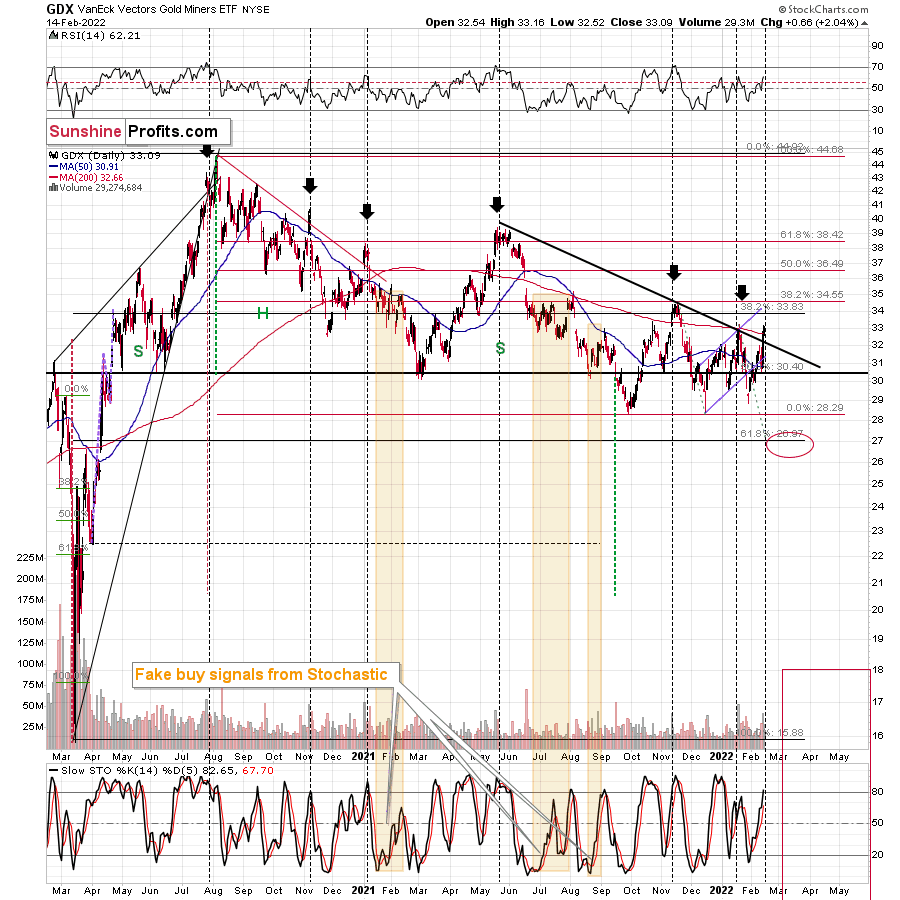
On Friday, gold miners once again soared on huge volume. “Once again,” because the same thing happened about a month ago.
Big daily rallies on big volume in mining stocks (GDX) tend to take place at the end of a given short-term upswing or close to it. For example, we saw that on Nov. 10, 2021, Aug. 27, 2021, Jul. 29, 2021, May 17, 2021, and Jan. 19, 2021.
These were good shorting, not buying opportunities. It’s rather unlikely that right now – AFTER the daily rally on huge volume – we are at a favorable moment to go long or to close the short positions. It seems much more likely that we are in a situation where short positions are even more justified from the risk-to-reward point of view.
What should one do about this upswing? As always, the decision is up to you – it’s your money. I’m not doing anything with my short position in junior mining stocks. If I didn’t already have it in place (at my desired – significant – size), I would have either entered this short position or added to it.
All in all, we saw a rally, but it’s unlikely to be the start of a bigger rally. Instead, it’s likely that what we saw was either the final part of the corrective upswing that started in mid-December, 2021, or it’s close to the final part of the corrective upswing. Either way, I think that the short position in the junior mining stocks remains justified from the risk-to-reward point of view.
Also, let’s keep in mind that the geopolitical tensions are likely to only have a temporary effect on precious metals prices and that the current tensions around Ukraine are likely very exaggerated and likely close to “peak concern” (and thus a concern-based price peak).
Both gold and gold stocks have reached their respective resistance levels created by the previous highs, which makes a turnaround even more likely. Please note that while gold stocks reached their previous 2022 highs, gold moved to new 2022 highs and stopped at its late-2021 highs. In other words, gold stocks are underperforming gold, which is a bearish sign.
Having said that, let’s take a look at the markets from a more fundamental point of view.
Speculative Noise
With financial markets whipsawing after every Russia-Ukraine headline, volatility has risen materially in recent days. With whispers of a Russian invasion on Feb. 16 (which I doubt will be realized), the game of hot potato has uplifted the precious metals market.
However, as I noted on Feb. 14, while the developments are short-term bullish, the PMs’ medium-term fundamentals continue to decelerate. For example, while the general stock market remains concerned about a Russian invasion, U.S. Treasury yields rallied on Feb. 14. With risk-off sentiment often born in the bond market, the safety trade benefiting the PMs didn’t materialize in U.S. Treasuries. As a result, bond traders aren’t demonstrating the same level of fear.
Please see below:
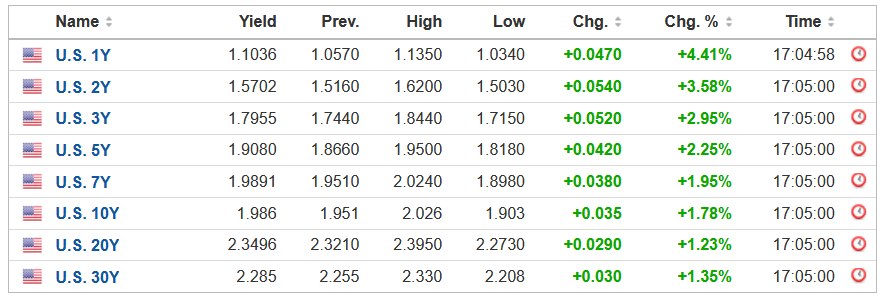 Source: Investing.com
Furthermore, while the potential conflict garners all of the attention, the fundamental issues that upended the PMs in 2021 remain unresolved. For example, with inflation surging, St. Louis Fed President James Bullard said on Feb. 14 that “the last four [Consumer Price Index] reports taken in tandem have indicated that inflation is broadening and possibly accelerating in the U.S. economy.”
“The inflation that we’re seeing is very bad for low- and moderate-income households,” he said. “People are unhappy, consumer confidence is declining. This is not a good situation. We have to reassure people that we’re going to defend our inflation target and we’re going to get back to 2%.”
As a result, Bullard wants a 50 basis point rate hike in March, and four rate hikes by July.
Please see below:
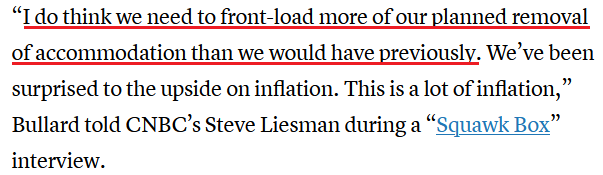 Source: CNBC
Likewise, while San Francisco Fed President Mary Daly is much less hawkish than Bullard, she also supports a rate hike in March.
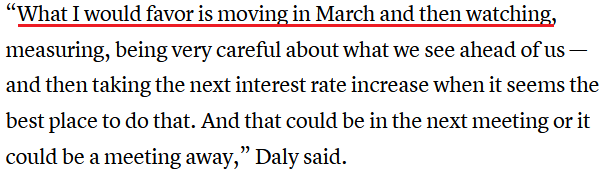 Source: CNBC
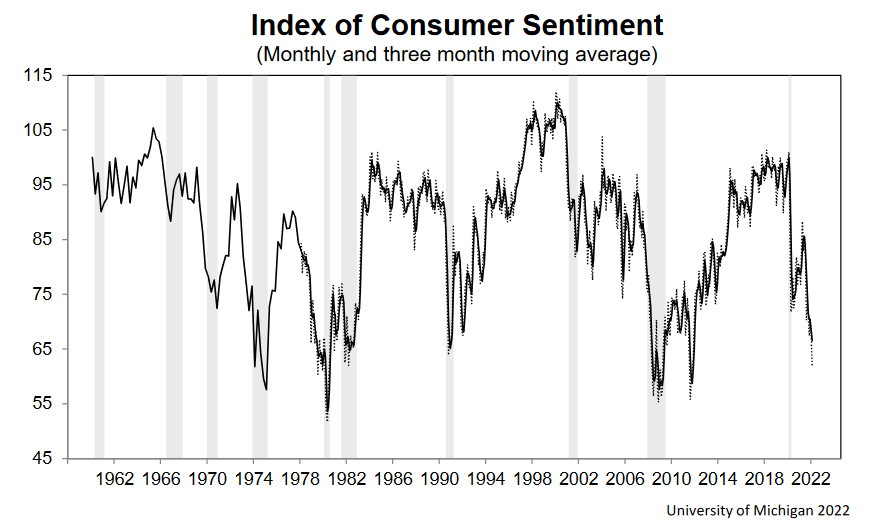
As a result, while the PMs can hide behind the Russia-Ukraine conflict in the short term, their medium-term fundamental outlooks are profoundly bearish. As mentioned, Bullard highlighted inflation’s impact on consumer confidence, and for a good reason. With the University of Michigan releasing its Consumer Sentiment Index on Feb. 11, the report revealed that Americans’ optimism sank to “its worst level in a decade, falling a stunning 8.2% from last month and 19.7% from last February.”
Chief Economist, Richard Curtin said:
“The recent declines have been driven by weakening personal financial prospects, largely due to rising inflation, less confidence in the government's economic policies, and the least favorable long term economic outlook in a decade.”
“The impact of higher inflation on personal finances was spontaneously cited by one-third of all consumers, with nearly half of all consumers expecting declines in their inflation adjusted incomes during the year ahead.”
Please see below:
To that point, I’ve highlighted on numerous occasions that U.S. President Joe Biden’s re-election prospects often move inversely to inflation. With the dynamic still on full display, immediate action is needed to maintain his political survival.
Please see below:
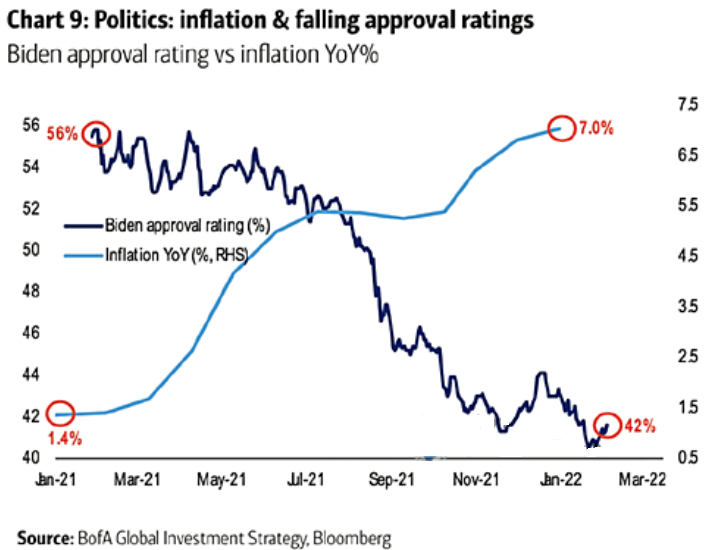
To explain, the light blue line above tracks the year-over-year (YoY) percentage change in inflation, while the dark blue line above tracks Biden’s approval rating. If you analyze the right side of the chart, you can see that the U.S. President remains in a highly perilous position. Moreover, with U.S. midterm elections scheduled for Nov. 8, the Democrats can’t wait nine to 12 months for inflation to calm down. As a result, there is a lot at stake politically in the coming months.
As further evidence, as inflation reduces real incomes and depresses consumer confidence, the Misery Index also hovers near crisis levels.
Please see below:
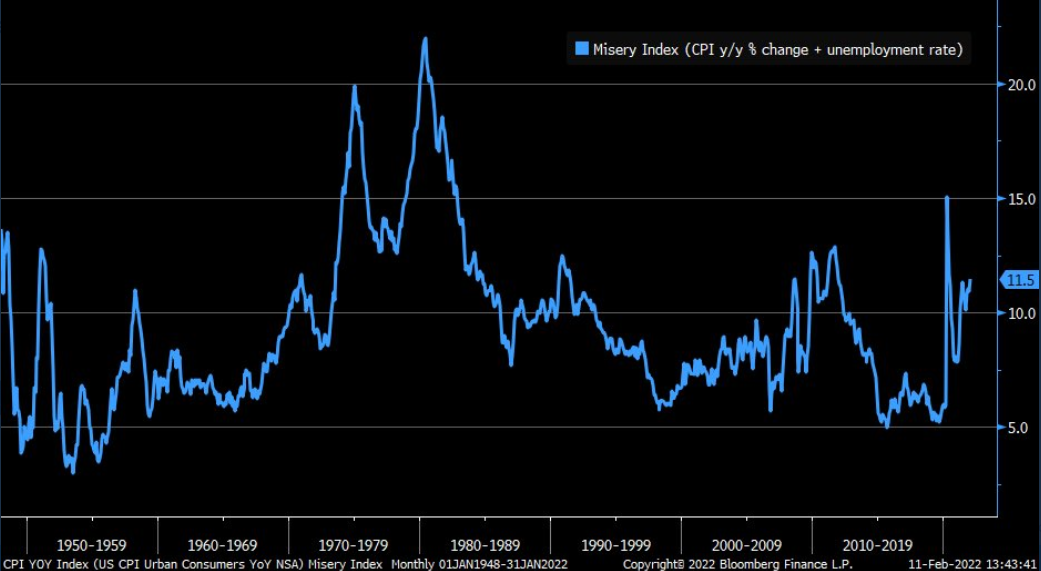
To explain, the blue line above tracks the Misery Index. For context, the index is calculated by subtracting the unemployment rate from the YoY percentage change in the headline CPI. In a nutshell, when inflation outperforms the unemployment rate (the blue line rises), it creates a stagflationary environment in America.
To that point, if you analyze the right side of the chart, you can see that the Misery Index is approaching a level that coincided with the global financial crisis (GFC). As a result, reversing the trend is essential to avoid a U.S. recession.
As such, with inflation still problematic and the writing largely on the wall, the market-implied probability of seven rate hikes by the Fed in 2022 is nearly 93% (as of Feb. 10).
Please see below:
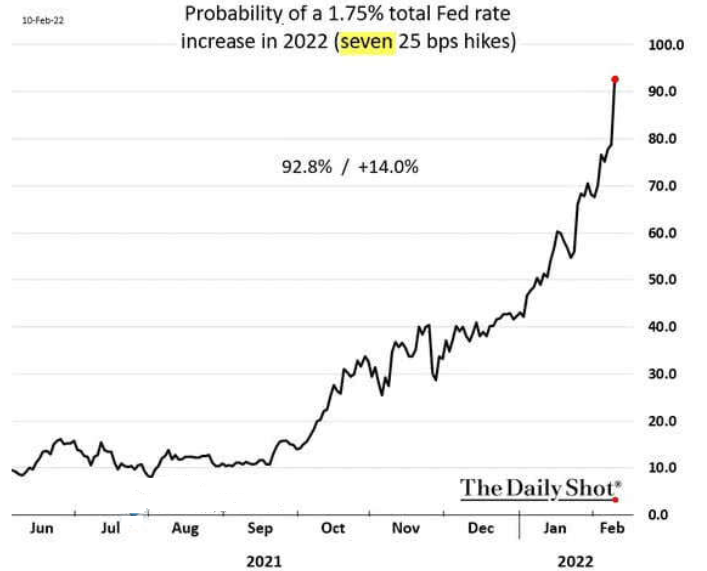
Ironically, while consumers and the bond market fret over inflation, U.S. economic growth remains resilient. While I’ve been warning for months that a bullish U.S. economy is bearish for the PMs, continued strength should turn hawkish expectations into hawkish realities.
To that point, the chart above shows that futures traders expect the U.S. Federal Funds Rate to hit 1.75% in 2022 (versus 0.08% now). However, Michael Darda, Chief Economist at MKM Partners, expects the Fed’s overnight lending rate to hit 3.5% before it’s all said and done.
“We have this booming economy with high inflation and a rapid recovery in the labor market – much different relative to the last cycle,” he said. “The Fed is behind the curve this time. They are going to have to do more.”
Singing a similar tune, John Thorndike, co-head of asset allocation at GMO, told clients that “inflation is now here, [but] the narrative is that inflation goes away and markets tend to struggle with change. It is more likely than not that real yields and policy rates need to move above inflation during this cycle.”
The bottom line? While the Russia-Ukraine drama distracts the PMs from the fundamental realities that confront them over the medium term, their outlooks remain profoundly bearish. Moreover, while I’ve noted on numerous occasions that the algorithms will enhance momentum in either direction, their influence wanes materially as time passes.
As such, while headline risk is material in the short-term, history shows that technicals and fundamentals reign supreme over longer time horizons. Thus, while the recent flare-up is an unfortunate event that hurts our short position, the medium-term developments that led to our bearish outlook continue to strengthen.
In conclusion, the PMs rallied on Feb. 14, as the Russia-Ukraine conflict is the primary driver moving the financial markets. However, while the PMs will ride the wave as far as it takes them, they ignored that the USD Index and U.S. Treasury yields also rallied. Moreover, with Fed officials ramping up the hawkish rhetoric, the PMs' fundamental outlook is more bearish now than it was in 2021 (if we exclude the Russia-Ukraine implications). As a result, while the timeline may have been delayed, lower lows should confront gold, silver, and mining stocks in the coming months.
Overview of the Upcoming Part of the Decline
- It seems to me that the corrective upswing is now over, and that gold, silver, and mining stocks are now likely to continue their medium-term decline.
- It seems that the first (bigger) stop for gold will be close to its previous 2021 lows, slightly below $1,700. Then it will likely correct a bit, but it’s unclear if I want to exit or reverse the current short position based on that – it depends on the number and the nature of the bullish indications that we get at that time.
- After the above-mentioned correction, we’re likely to see a powerful slide, perhaps close to the 2020 low ($1,450 - $1,500).
- If we see a situation where miners slide in a meaningful and volatile way while silver doesn’t (it just declines moderately), I plan to – once again – switch from short positions in miners to short positions in silver. At this time, it’s too early to say at what price levels this could take place, and if we get this kind of opportunity at all – perhaps with gold close to $1,600.
- I plan to exit all remaining short positions once gold shows substantial strength relative to the USD Index while the latter is still rallying. This may be the case with gold close to $1,350 - $1,400. I expect silver to fall the hardest in the final part of the move. This moment (when gold performs very strongly against the rallying USD and miners are strong relative to gold after its substantial decline) is likely to be the best entry point for long-term investments, in my view. This can also happen with gold close to $1,375, but at the moment it’s too early to say with certainty.
- As a confirmation for the above, I will use the (upcoming or perhaps we have already seen it?) top in the general stock market as the starting point for the three-month countdown. The reason is that after the 1929 top, gold miners declined for about three months after the general stock market started to slide. We also saw some confirmations of this theory based on the analogy to 2008. All in all, the precious metals sector is likely to bottom about three months after the general stock market tops.
- The above is based on the information available today, and it might change in the following days/weeks.
You will find my general overview of the outlook for gold on the chart below:
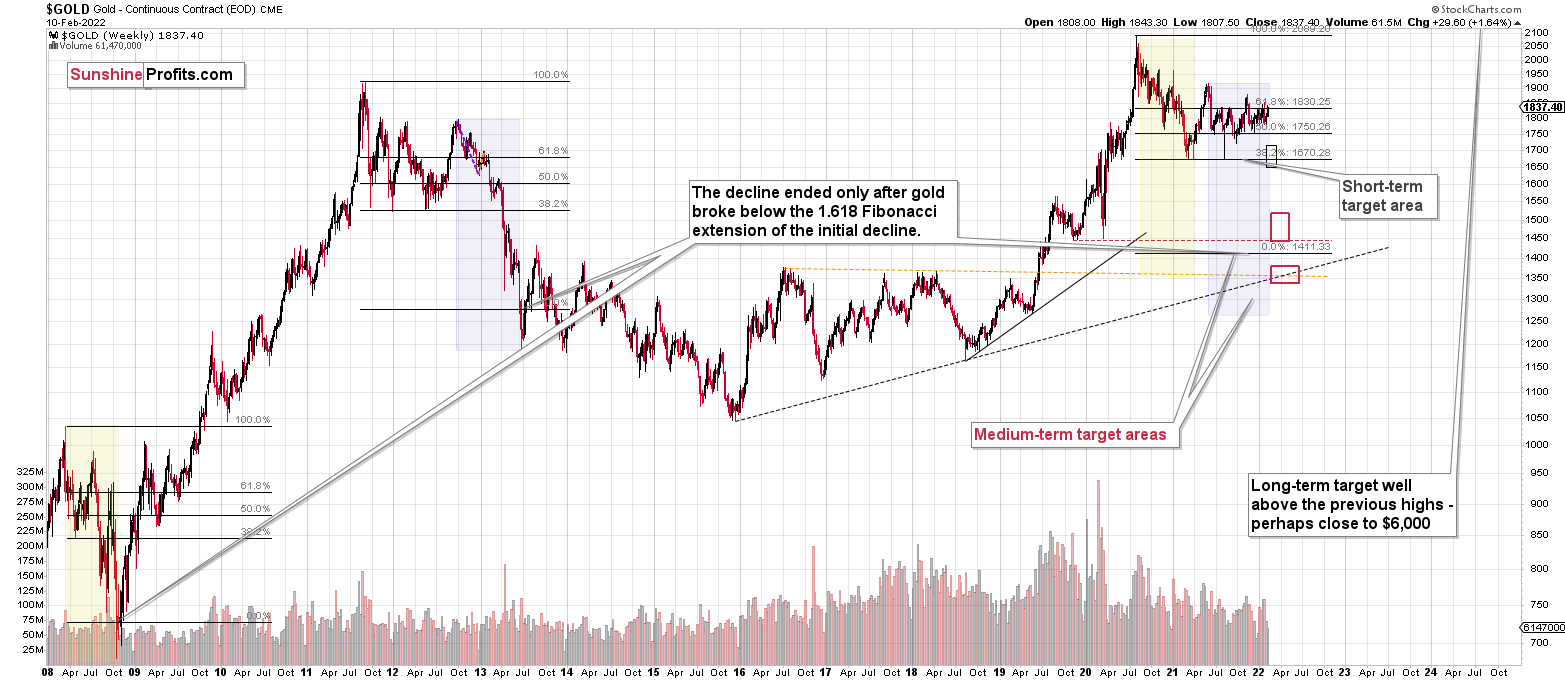
Please note that the above timing details are relatively broad and “for general overview only” – so that you know more or less what I think and how volatile I think the moves are likely to be – on an approximate basis. These time targets are not binding or clear enough for me to think that they should be used for purchasing options, warrants or similar instruments.
Summary
Summing up, it seems to me that the corrective upswing is over, or that we won’t have to wait too long for it to be over. Let’s keep in mind that there are triangle-vertex-based reversals in mid- and late-February, so even if we see more back-and-forth trading soon, it’s likely that the decline resumes later this month.
I continue to think that junior mining stocks are currently likely to decline the most out of all the parts of the precious metals sector.
From the medium-term point of view, the two key long-term factors remain the analogy to 2013 in gold and the broad head and shoulders pattern in the HUI Index. They both suggest much lower prices ahead.
It seems that our profits from the short positions are going to become truly epic in the coming months.
After the sell-off (that takes gold to about $1,350 - $1,500), I expect the precious metals to rally significantly. The final part of the decline might take as little as 1-5 weeks, so it's important to stay alert to any changes.
Most importantly, please stay healthy and safe. We made a lot of money last March and this March, and it seems that we’re about to make much more on the upcoming decline, but you have to be healthy to enjoy the results.
As always, we'll keep you - our subscribers - informed.
To summarize:
Trading capital (supplementary part of the portfolio; our opinion): Full speculative short positions (300% of the full position) in junior mining stocks are justified from the risk to reward point of view with the following binding exit profit-take price levels:
Mining stocks (price levels for the GDXJ ETF): binding profit-take exit price: $34.63; stop-loss: none (the volatility is too big to justify a stop-loss order in case of this particular trade)
Alternatively, if one seeks leverage, we’re providing the binding profit-take levels for the JDST (2x leveraged) and GDXD (3x leveraged – which is not suggested for most traders/investors due to the significant leverage). The binding profit-take level for the JDST: $14.98; stop-loss for the JDST: none (the volatility is too big to justify a SL order in case of this particular trade); binding profit-take level for the GDXD: $25.48; stop-loss for the GDXD: none (the volatility is too big to justify a SL order in case of this particular trade).
For-your-information targets (our opinion; we continue to think that mining stocks are the preferred way of taking advantage of the upcoming price move, but if for whatever reason one wants / has to use silver or gold for this trade, we are providing the details anyway.):
Silver futures downside profit-take exit price: $19.12
SLV profit-take exit price: $17.72
ZSL profit-take exit price: $38.28
Gold futures downside profit-take exit price: $1,683
HGD.TO – alternative (Canadian) inverse 2x leveraged gold stocks ETF – the upside profit-take exit price: $11.79
HZD.TO – alternative (Canadian) inverse 2x leveraged silver ETF – the upside profit-take exit price: $29.48
Long-term capital (core part of the portfolio; our opinion): No positions (in other words: cash
Insurance capital (core part of the portfolio; our opinion): Full position
Whether you already subscribed or not, we encourage you to find out how to make the most of our alerts and read our replies to the most common alert-and-gold-trading-related-questions.
Please note that we describe the situation for the day that the alert is posted in the trading section. In other words, if we are writing about a speculative position, it means that it is up-to-date on the day it was posted. We are also featuring the initial target prices to decide whether keeping a position on a given day is in tune with your approach (some moves are too small for medium-term traders, and some might appear too big for day-traders).
Additionally, you might want to read why our stop-loss orders are usually relatively far from the current price.
Please note that a full position doesn't mean using all of the capital for a given trade. You will find details on our thoughts on gold portfolio structuring in the Key Insights section on our website.
As a reminder - "initial target price" means exactly that - an "initial" one. It's not a price level at which we suggest closing positions. If this becomes the case (like it did in the previous trade), we will refer to these levels as levels of exit orders (exactly as we've done previously). Stop-loss levels, however, are naturally not "initial", but something that, in our opinion, might be entered as an order.
Since it is impossible to synchronize target prices and stop-loss levels for all the ETFs and ETNs with the main markets that we provide these levels for (gold, silver and mining stocks - the GDX ETF), the stop-loss levels and target prices for other ETNs and ETF (among other: UGL, GLL, AGQ, ZSL, NUGT, DUST, JNUG, JDST) are provided as supplementary, and not as "final". This means that if a stop-loss or a target level is reached for any of the "additional instruments" (GLL for instance), but not for the "main instrument" (gold in this case), we will view positions in both gold and GLL as still open and the stop-loss for GLL would have to be moved lower. On the other hand, if gold moves to a stop-loss level but GLL doesn't, then we will view both positions (in gold and GLL) as closed. In other words, since it's not possible to be 100% certain that each related instrument moves to a given level when the underlying instrument does, we can't provide levels that would be binding. The levels that we do provide are our best estimate of the levels that will correspond to the levels in the underlying assets, but it will be the underlying assets that one will need to focus on regarding the signs pointing to closing a given position or keeping it open. We might adjust the levels in the "additional instruments" without adjusting the levels in the "main instruments", which will simply mean that we have improved our estimation of these levels, not that we changed our outlook on the markets. We are already working on a tool that would update these levels daily for the most popular ETFs, ETNs and individual mining stocks.
Our preferred ways to invest in and to trade gold along with the reasoning can be found in the how to buy gold section. Furthermore, our preferred ETFs and ETNs can be found in our Gold & Silver ETF Ranking.
As a reminder, Gold & Silver Trading Alerts are posted before or on each trading day (we usually post them before the opening bell, but we don't promise doing that each day). If there's anything urgent, we will send you an additional small alert before posting the main one.
Thank you.
Przemyslaw Radomski, CFA
Founder, Editor-in-chief

