
tools spotlight

-
Inflation Accelerates in June. Will Gold Finally React?
August 20, 2021, 9:24 AMInflation surged in June to 5.4%. It may retrace soon, but there’s a good chance that it will increase again later, boosting gold at last.
The inflation monster has reared its ugly head. The CPI annual rate surged to 5.4% in June, accelerating from already mind-blowing 5% in May. It was the hottest pace since the Great Recession. However, Powell and his colleagues from the FOMC still claim that inflation will only be temporary, as it was boosted by the reopening from the Great Lockdown, while others predict a replay of the stagflation from the 1970s. Who is right?
Well, it’s true that some inflation measures will decline in the near future. After all, the economy faces supply chain bottlenecks, which are causing price spikes. The global shortage in the supply of semiconductors chips is one of the temporary problems that led to the annual 45.2% spike in the price of used cars in June, accounting for more than one-third of the surge in the overall index.
However, used vehicle prices are skyrocketing not just because of the problems on the supply side, but also because of a higher-than-expected demand. And where did this strong demand come from? You got it – from the extra cash that has been created and distributed to people. There is so much liquidity in the markets thanks to very easy fiscal and monetary policies that people just want to buy stuff, no matter the price.
As Milton Friedman notes, “inflation is always and everywhere a monetary phenomenon” – prices cannot keep on rising without the expansion of money supply. So, supply bottlenecks are only one driver of rising inflation – the surge in the broad money supply, the reduced pace of globalization and the complacent stance of central banks are other factors.
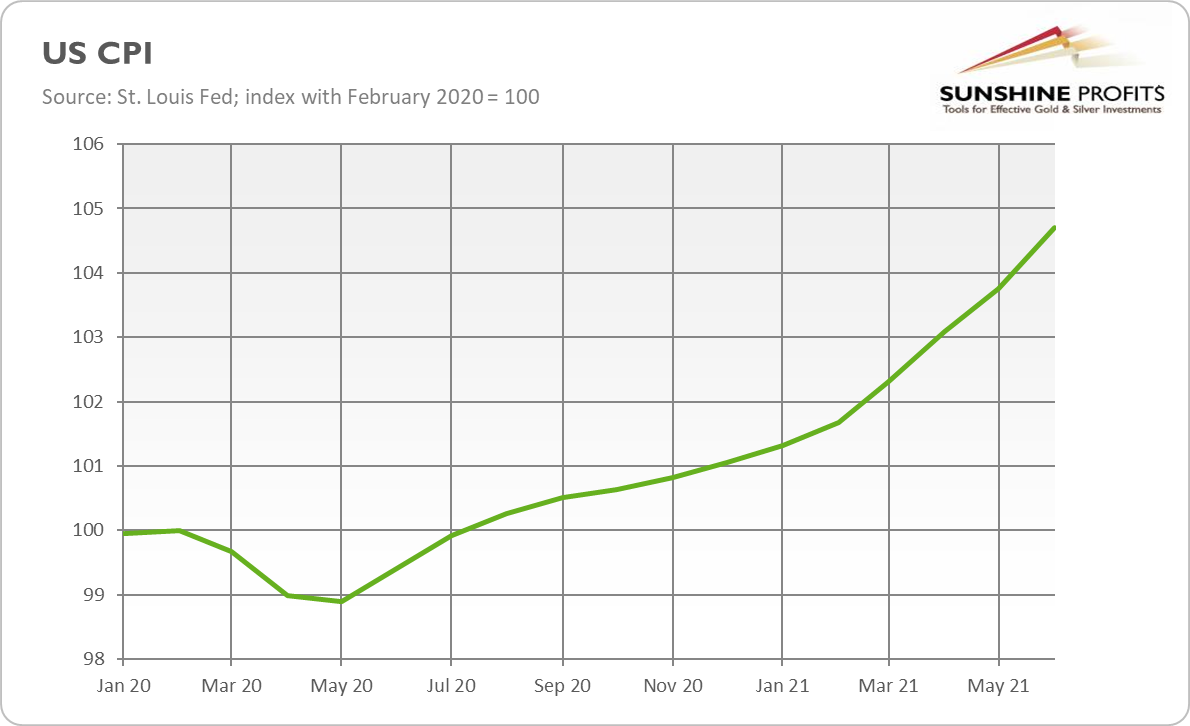
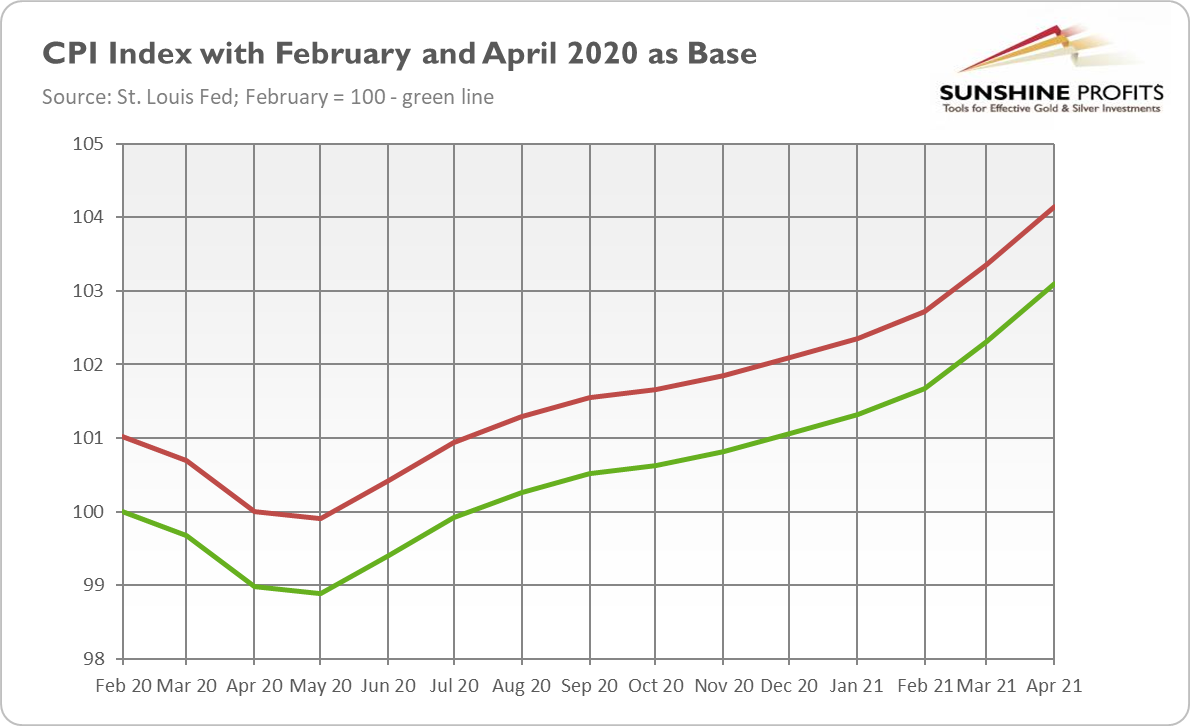
What’s more, even if we drop the subindex for used cars from the calculation, the annual inflation rate would be 3.6%, almost twice the Fed’s target. Indeed, there is still some base effect, but even if we compare the recent inflation readings to February 2020, we see in the chart below that the CPI is 4.7% higher than before the pandemic.
So, some improvement in the supply of semiconductors (if we drop out low CPI readings from the calculation) could soften inflation somewhat in July or later this year. However, even if inflation backs out of its current pace, it will likely remain elevated; even experts admit it. The economists polled by the Wall Street Journal forecast that inflation will drop to 3.2% by the end of this year and stay above 2% through 2023.
There is still high inflationary pressure that should keep consumer prices boosted. For instance, the ISM® Prices Index registered 92.1%in June, indicating that raw materials’ prices increased for the 13th consecutive month. The index has risen to its highest level since July 1979. Producer prices are also rising, while transportation costs, in particular freight prices, are skyrocketing. All this should add to the inflationary pressure, possibly translating into higher consumer prices in the future.
Another important issue is that inflation often comes in waves. So, even if the first bout ends soon, it won’t mean that the threat of high inflation is going to disappear. It might be the case that we are just in a transitional phase, slowly moving into a period of higher inflation. Please take a look at the chart below. As you can see, the stagflation from the 1970s didn’t show up overnight.
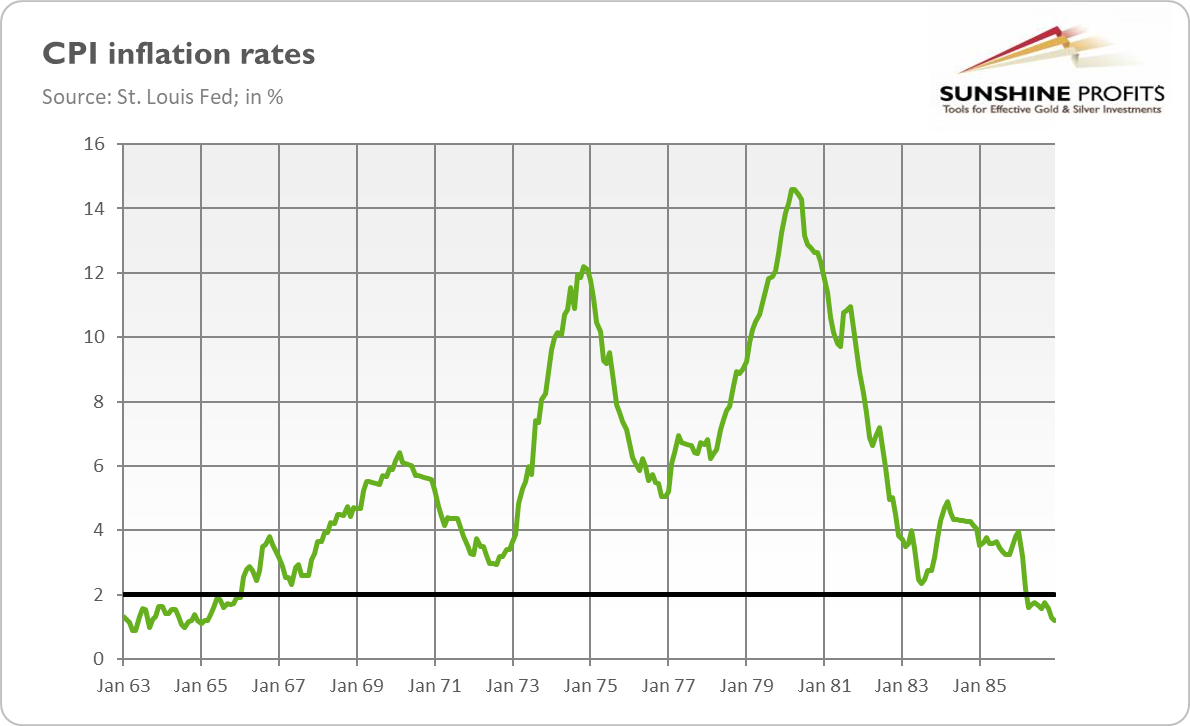
Instead, the first wave started in 1965 and peaked a year later. However, in 1967, the second wave began, which peaked in 1970. Then, inflation eased, giving false hopes, but it accelerated again in 1973-1975, and – after another temporary retreat –in 1978-1980.
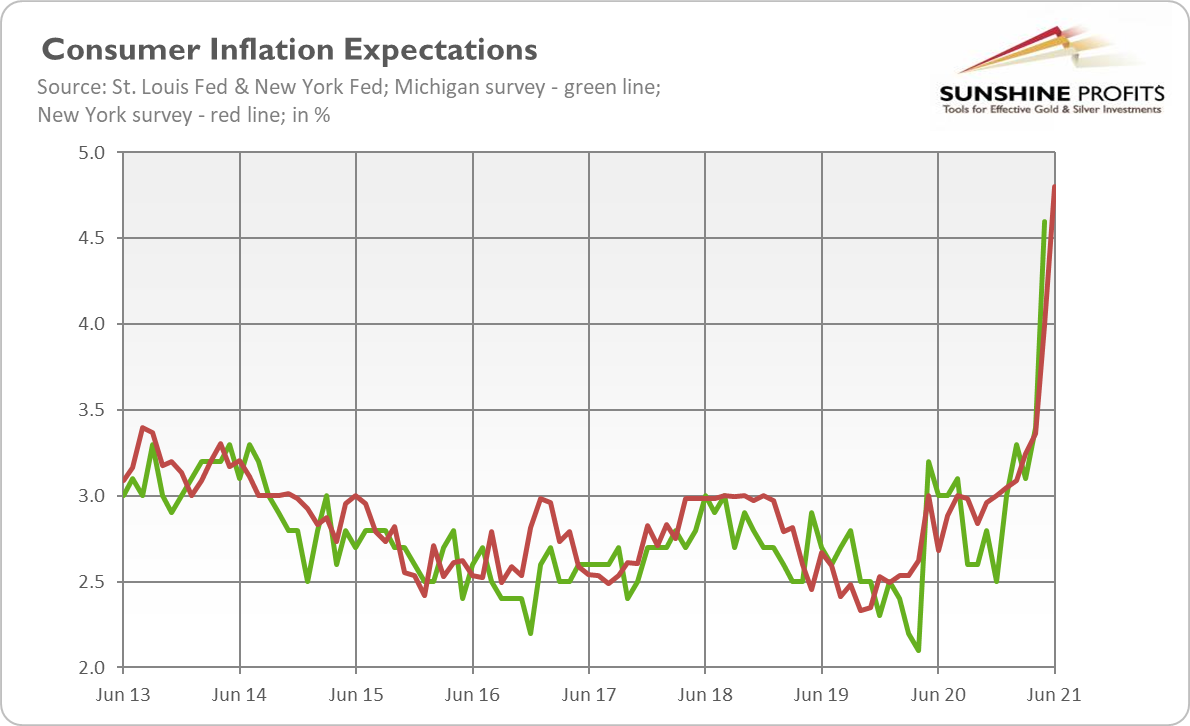
So, the first bout of inflation always looks temporary, but it may lay the groundwork for even higher inflation, especially if inflation expectations de-anchor. And, indeed, although medium-term consumer expectations remain stable, one-year expectations have recently risen, as the chart below shows. In the case of New York Fed’s Survey of Consumer Expectations (red line), they have soared 0.8 percentage points, reaching 4.8% – a new series high.
What does it all imply for the gold market? Well, initially, the impact of inflation might be negative. This is because the markets will eventually react to higher inflation and the more hawkish Fed. So, the bond yields will rise, increasing the opportunity costs of holding gold.
However, after some time, higher inflation will become disruptive for the economy. Either real household incomes or corporate profits will decline (depending on the companies’ ability to pass surging costs), while higher interest rates will trigger some defaults. When inflationary psychology sets in and people start to worry about all the bad consequences of inflation, gold should shine. So far, the party goes on; but a hangover lurks just around the corner.
Thank you for reading today’s free analysis. If you enjoyed it, and would you like to know more about the links between the economic outlook and the gold market, we invite you to read the August Gold Market Overview report. Please note that in addition to the above-mentioned free fundamental gold reports, we provide premium daily Gold & Silver Trading Alerts with clear buy and sell signals. We provide these premium analyses also on a weekly basis in the form of Gold Investment Updates. In order to enjoy our gold analyses in their full scope, we invite you to subscribe today. If you’re not ready to subscribe yet and are not on our gold mailing list yet, we urge you to sign up. It’s free and if you don’t like it, you can easily unsubscribe. Sign up today!
Arkadiusz Sieron, PhD
Sunshine Profits: Effective Investment through Diligence & Care.-----
Disclaimer: Please note that the aim of the above analysis is to discuss the likely long-term impact of the featured phenomenon on the price of gold and this analysis does not indicate (nor does it aim to do so) whether gold is likely to move higher or lower in the short- or medium term. In order to determine the latter, many additional factors need to be considered (i.e. sentiment, chart patterns, cycles, indicators, ratios, self-similar patterns and more) and we are taking them into account (and discussing the short- and medium-term outlook) in our Gold & Silver Trading Alerts.
-
Will the Fed Bring Gold to the Bottom?
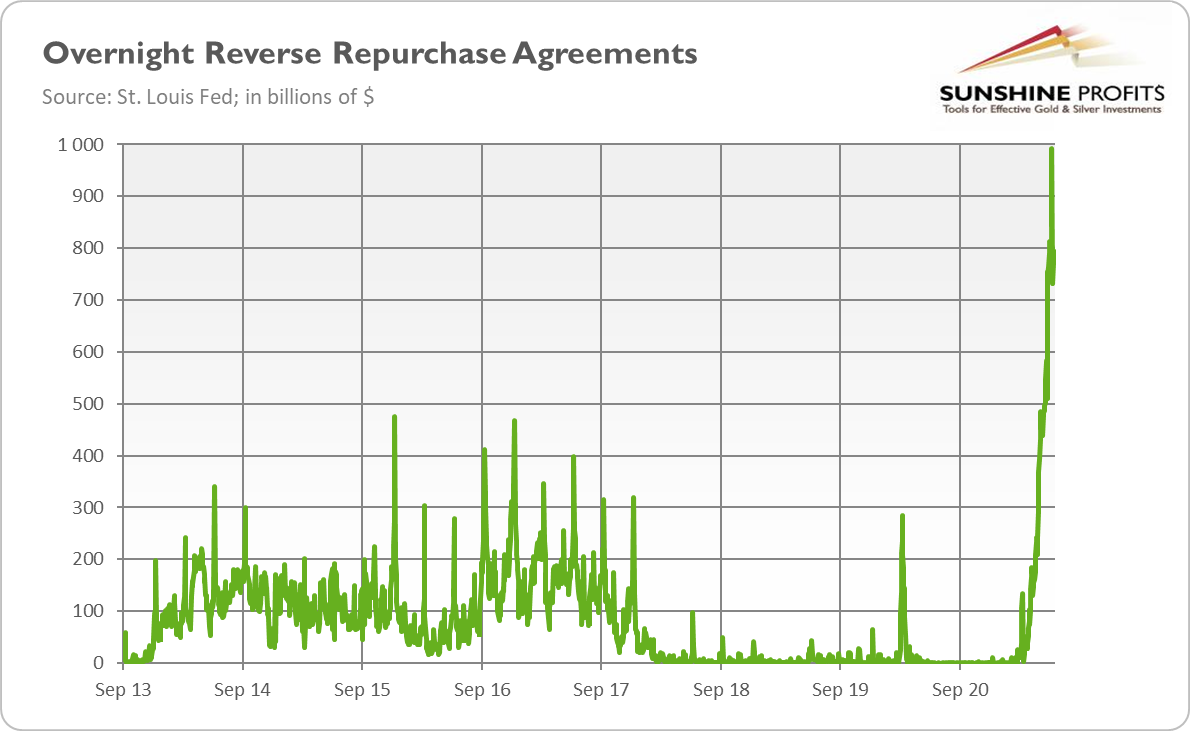
August 6, 2021, 6:40 AMThe Fed’s reverse repos reached almost $1 trillion in June. Brace yourselves gold bulls – tightening is coming!
Something interesting is happening in the financial markets. As you probably know, the Fed’s reverse repurchase operations have been increasing recently. At the very end of June, their volume almost reached one trillion dollars ($991.9 billion)! It’s a record high, as the chart below shows.
Oh boy, what a spike! What does it mean? Well, when the Fed purchases assets, it injects liquidity into the markets. On the contrary, when the US central bank engages in reverse repurchase operations, it drains liquidity from the markets. This is because reverse repurchase agreements are purchases of securities with the agreement to sell them at a higher price at a specific future date – of course, we refer here to buying and selling from the point of view of financial institutions. They are purchasing assets from the Fed to resell them later, so they basically lend some money to the US central bank.
In other words, the record high volume of repos means that financial institutions pour cash into the Fed like mad. We could say that there is an excessive liquidity problem in the financial markets, so commercial banks and other institutions deposit abundant cash at the Fed (you can think of reverse repos as short-term loans).
So, we have a somewhat paradoxical situation. The Fed is still purchasing assets under its quantitative easing program, injecting liquidity into the financial sphere. However, market participants don’t need this liquidity, so they buy back some assets from the Fed in the form of reverse repo operations. Given that the Fed buys about $120 billion per month in Treasuries and MBS, the reverse repos have already undone more than eight months of QE!
Part of the problem here is the crazy world of negative real interest rates. In such an environment, commercial banks prefer safe, close-to-zero interest rates from the Fed to risking anything in the market. In other words, the bond yields are so low that banks don’t want to deploy funds productively but prefer to hold them safely at the Fed. Such behavior is completely understandable in the world of negative yields, but it will lead to sluggish investment and economic growth. Well, abundant liquidity that becomes a hot potato, as well as slow real growth, sound like positive factors for gold, which likes stagflation-like conditions.
However, the reverse repos are strictly linked to the Fed’s plan to normalize its monetary policy at some point in the future. But hiking the federal funds rate is not simple with such a mammoth balance sheet. You see, the Fed’s balance sheet is simply too big. As the chart below shows, the US central bank’s assets amount to above $8 trillion.
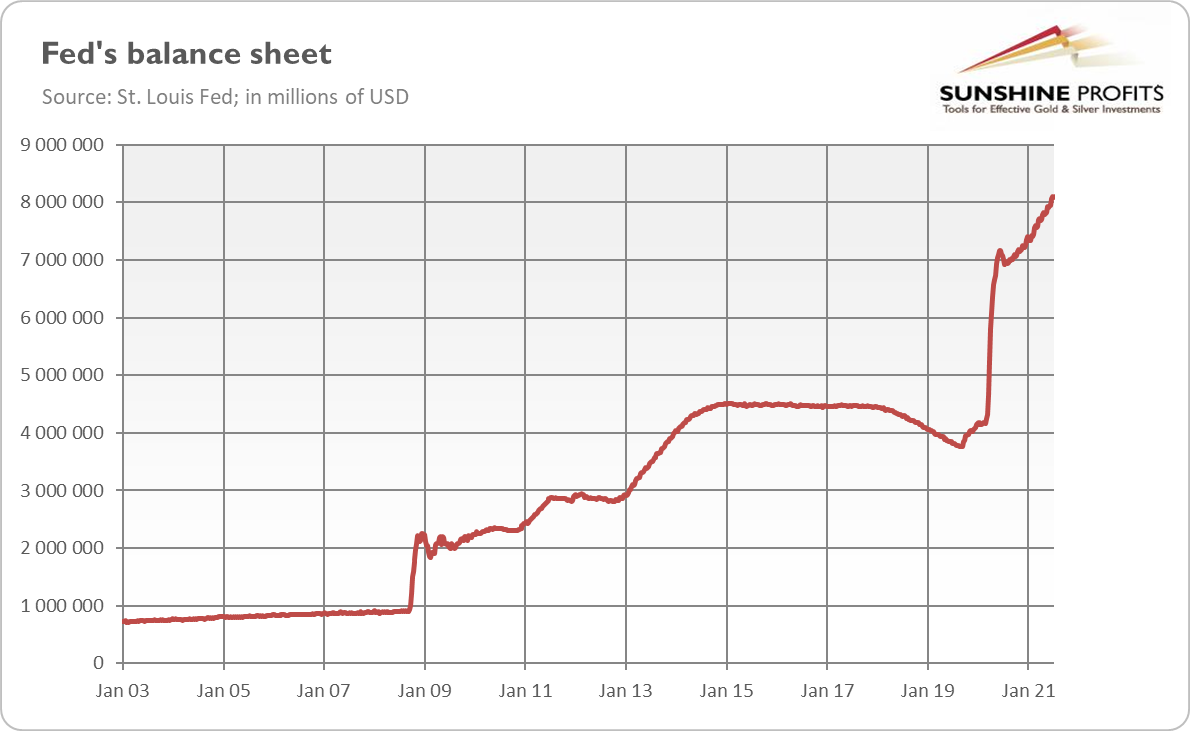
Such a giant balance sheet creates downward pressure on the interest rates. If left alone, they could even drop below zero. This is why the Fed started the overnight repurchase operations – to drain some excessive liquidity from the markets in order to regain control over the interest rates. So, the current developments in the repo market are a strong signal that the Fed is preparing for raising the interest rates. Actually, the Fed has already lifted its repo rate from 0% to 0.05%, allegedly as a technical adjustment. This is a fundamentally negative factor for the gold market.
Nonetheless, gold bulls may find comfort in the fact that it’s not easy to return to normalcy. Remember the Fed’s previous attempt to normalize its monetary policy? The US central bank had to reverse its course in 2019, just two years after starting the balance sheet’s reduction. It turned out that quantitative tightening was too harsh for fragile financial markets, and the Fed had to pump liquidity again (in the form of repo operations), as well as cut the interest rates – even before the pandemic and the following economic crisis started. Similarly, by paying trillions in reverse repos at 0.05% now, the Fed makes them more attractive, planting the seeds of the next liquidity crisis.
In other words, the Fed’s tightening cycle practically always ended up in a recession. Moreover, there were many indicators that the recession would take place in 2020 or 2021 anyway, even without the coronavirus and the Great Lockdown. So, this time won’t be different. Well, actually, it could be different –in such a way that the next recession will be accompanied by higher inflation. If stagflation really occurs, gold will shine as it did in the 1970s.
Thank you for reading today’s free analysis. If you enjoyed it, and would you like to know more about the links between the economic outlook and the gold market, we invite you to read the August Gold Market Overview report. Please note that in addition to the above-mentioned free fundamental gold reports, we provide premium daily Gold & Silver Trading Alerts with clear buy and sell signals. We provide these premium analyses also on a weekly basis in the form of Gold Investment Updates. In order to enjoy our gold analyses in their full scope, we invite you to subscribe today. If you’re not ready to subscribe yet and are not on our gold mailing list yet, we urge you to sign up. It’s free and if you don’t like it, you can easily unsubscribe. Sign up today!
Arkadiusz Sieron, PhD
Sunshine Profits: Effective Investment through Diligence & Care.-----
Disclaimer: Please note that the aim of the above analysis is to discuss the likely long-term impact of the featured phenomenon on the price of gold and this analysis does not indicate (nor does it aim to do so) whether gold is likely to move higher or lower in the short- or medium term. In order to determine the latter, many additional factors need to be considered (i.e. sentiment, chart patterns, cycles, indicators, ratios, self-similar patterns and more) and we are taking them into account (and discussing the short- and medium-term outlook) in our Gold & Silver Trading Alerts.
-
Gold at a Crossroads of Hawkish Fed and High Inflation
July 30, 2021, 11:58 AMGold has been trading sideways recently, but this won’t last forever – the yellow metal is likely to move downward before continuing its rise.
So, so you think you can tell heaven from hell, a bull market from a bear market? It’s not so easy, as gold seems to be at a crossroads. On the one hand, accelerating inflation should take gold higher, especially that the real interest rates stay well below zero. On the other hand, a hawkish Fed should send the yellow metal lower, as it would boost the expectations of higher bond yields. The Fed’s tightening cycle increases the interest rates and strengthens the US dollar, creating downward pressure on gold.
However, gold is neither soaring nor plunging. Instead, it seems to be in a sideways trend. Indeed, as the chart below shows, gold has been moving in a trading zone of $1,700-$1,900 since September 2020.
Now, the obvious question is: what’s next? Are we observing a bearish correction within the bull market that started in late 2018? Or did the pandemic and the following economic crisis interrupt the bear market that begun in 2011? Could a new one have started in August 2020? Or maybe gold has returned to its sideways trend from 2017-2018, with the trading corridor simply situated higher?
Oh boy, if I had the answers to all the wise questions that I’m asking! You see, the problem is that the coronavirus crisis was a very special recession – it was very deep but also very short. So, all the golden trends and cycles have intensified and shortened. What used to be years before the epidemic, took months this time. Welcome to a condensed gold market!
Hence, I would say that the peak of July 2021 marked the end of the bull market which started at the end of 2018, and triggered a new bear market, as traders decided that the vaccines would save the economy and the worst was behind the globe. This is, of course, bad news for all investors with long positions.
I didn’t call the bear market earlier, as the combination of higher inflation and a dovish Fed was a strong bullish argument. However, the June FOMC meeting and its dot-plot marked a turning point for the US monetary policy. The Fed officials started talking about tapering, divorcing from its extraordinary pandemic stance.
So, I’ve become more bearish in the short-to-medium term than I was previously. After all, gold doesn’t like the expectations of tapering quantitative easing and rising federal funds rate. The taper tantrum of 2013 made gold plunge.
Nonetheless, the exact replay of the taper tantrum is not likely. The Fed is much more cautious, with a stronger dovish bias and better communication with the markets. The quantitative tightening will be more gradual and better announced. So, gold may not slide as abruptly as in 2013.
Another reason for not being a radical pessimist is the prospects of higher inflation. After all, inflation is a monetary phenomenon that occurs when too much money is chasing too few goods – and the recent rate of growth of the broad money supply was much higher than the pace needed to reach the Fed’s 2% target. The inflationary worries should provide some support for gold prices. What gold desperately needs here is inflation psychology. So far, we have high inflation, but markets remain calm. However, when higher inflation expectations set in, gold may shine thanks to the abovementioned worries about inflation’s impact on the economy – and, thanks to stronger demand for inflation hedges.
In other words, gold is not plunging because the Fed is not hawkish enough, and it’s not rallying because inflation is not disruptive enough. Now, the key point is that it’s more likely that we will see a more hawkish Fed (and rising interest rates) sooner than stagflation. As the chart below shows, the real interest rates haven’t yet started to normalize. When they do, gold will suffer (although it might not be hit as severely as in April 2013).
Therefore, gold may decline shortly when the US central bank tapers its asset purchases (and the bond yields increase) while the first bout of inflation softens. But later, gold may rise due to the negative effects of rising interest rates and the second wave of higher inflation.
In other words, right now, the real economy is thriving, so inflation is not seen as a major problem, as it is accompanied by fast GDP growth. However, the economy will slow down at some point in the future (partially because of higher inflation) – and then we will be moving towards stagflation, gold’s favorite macroeconomic environment.
Thank you for reading today’s free analysis. If you enjoyed it, and would you like to know more about the links between the economic outlook and the gold market, we invite you to read the August Gold Market Overview report. Please note that in addition to the above-mentioned free fundamental gold reports, we provide premium daily Gold & Silver Trading Alerts with clear buy and sell signals. We provide these premium analyses also on a weekly basis in the form of Gold Investment Updates. In order to enjoy our gold analyses in their full scope, we invite you to subscribe today. If you’re not ready to subscribe yet and are not on our gold mailing list yet, we urge you to sign up. It’s free and if you don’t like it, you can easily unsubscribe. Sign up today!
Arkadiusz Sieron, PhD
Sunshine Profits: Effective Investment through Diligence & Care.-----
Disclaimer: Please note that the aim of the above analysis is to discuss the likely long-term impact of the featured phenomenon on the price of gold and this analysis does not indicate (nor does it aim to do so) whether gold is likely to move higher or lower in the short- or medium term. In order to determine the latter, many additional factors need to be considered (i.e. sentiment, chart patterns, cycles, indicators, ratios, self-similar patterns and more) and we are taking them into account (and discussing the short- and medium-term outlook) in our Gold & Silver Trading Alerts.
-
Gold’s Behavior in Various Parallel Inflation Universes
July 23, 2021, 6:18 AMThe current high inflation could theoretically transform into hyperinflation, disinflation, stagflation, or deflation. What does each mean for gold?
Inflation, inflation, inflation. We all know that prices have surged recently. And we all know that high inflation is likely to stay with us for a while, even if we assume that the CPI annual rate has already peaked, which is not so obvious. But let’s look beyond the nearest horizon and think about what lies ahead after months of high inflation, and what consequences it could have for the gold market.
From the logical point of view, there are three options. Inflation rates could accelerate further, leading to hyperinflation in an extreme case. They could remain more or less the same, resulting possibly in stagflation when the pace of GDP growth decelerates. And, finally, the rates of annual changes in the CPI could slow down, implying disinflation, or they could even become negative – in this scenario, we would enter the world of deflation. So, which of these “flations” awaits us?
Although some commentators scare us with the specter of hyperinflation, I would reject this variant. Surely, the inflation rate at 5% is relatively high, but it’s not even close to 50%, which is an accepted hyperinflation threshold. We also don’t see people getting rid of depreciating money as quickly as possible – instead, the demand for money has been rising recently (or, in other words, the velocity of money has been decreasing).
It’s also worth remembering that hyperinflation usually occurs when fiscal deficits are financed by money creation, especially when the government cannot raise funds through borrowing or taxes, for example because of a war or other sociopolitical convulsions. Sure, the budget deficits are partially monetized, but we are far from the situation in which the US government would be unable to collect taxes or find lenders ready to buy its bonds. Hence, gold bugs counting on hyperinflation may be disappointed – but I doubt that they would really want to live during the collapse of the monetary system.
The opposite scenario, i.e., deflation, is also unlikely. To be clear, asset price deflation is possible if some of the asset bubbles burst, but the absolute declines in the consumer prices, similar to those observed during the Great Depression, or even the Great Recession, are not very probable. The broad money supply is still increasing rapidly, the fiscal policy remains easy as never, and the Fed remains ultra-dovish and ready to intervene to prevent deflation. For deflation to happen, we would need to have the next global financial crisis which would severely hit the aggregate demand and oil prices.
Although there are significant vulnerabilities in the financial sector, it’s definitely too early to talk about significant deflation risks on the horizon. As with hyperinflation, this is bad news for gold, as the yellow metal performs well during the deflationary crises (although at the beginning, people usually collect cash, disposing of almost all assets).
So, we are left with two options. Inflation will either diminish to its previous levels (maybe to slightly higher readings than before the pandemic), and we will return more or less to the Goldilocks economy, or inflation will stay relatively high (although it may subside a bit), while the economic growth will slow down significantly (and more than inflation). It goes without saying that the latter option would be much better for gold than the former one, as gold doesn’t like periods of decelerating inflation rates and of a decent pace of economic growth (remember 1980 and the 1990s?). So, could gold investors reasonably ask whether we will experience disinflation or stagflation?
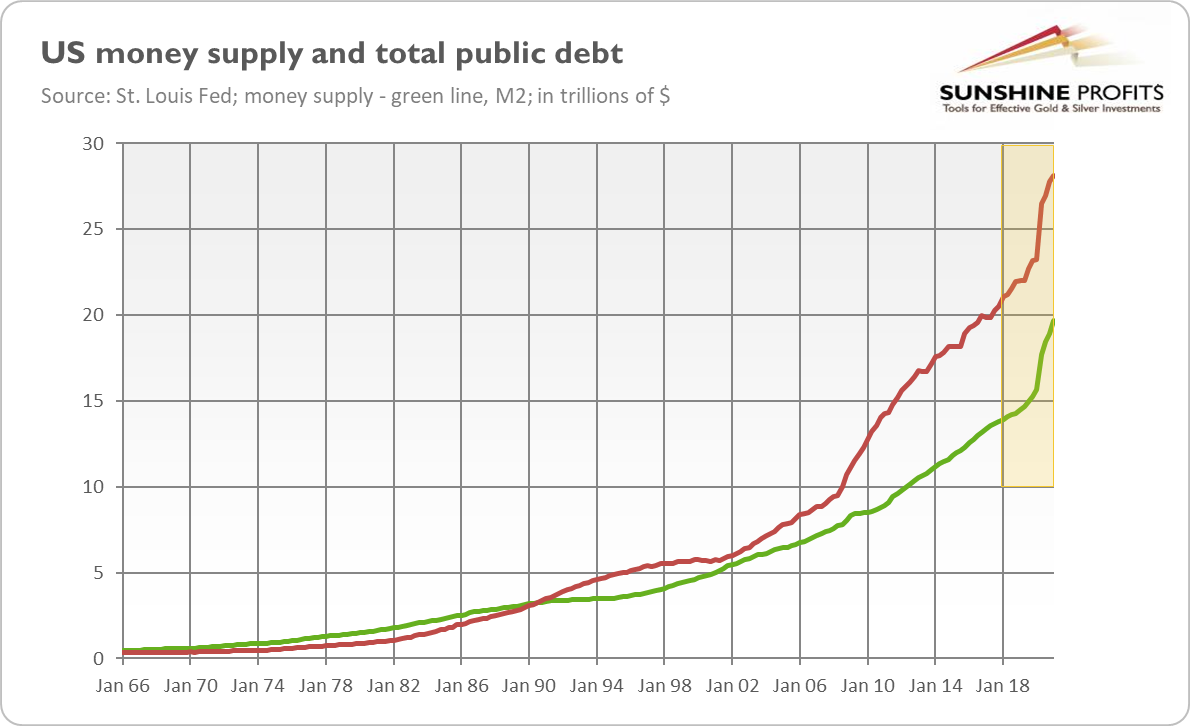
Well, the Fed believes that the current high inflation readings will prove to be temporary and we will return to the pre-epidemic era of low inflation. But you can’t step in the same river twice, and you can’t step in the same economy twice. You can’t undo all the monetary and fiscal stimulus nor the surge in the broad money supply and the public debt (see the chart below).
So, the pre-pandemic low inflation readings are not set in stone. And the impact of some deflationary forces could be exaggerated by the central bankers and the pundits – for example, the recent ECB research shows that “the disinflationary role of globalization has been economically small”.
Hence, I worry about stagflation. And I’m not alone. The results of the latest biannual survey of the chief U.S. economists from 27 financial institutions for the U.S. Securities Industry and Financial Markets Association also highlight the risks of high inflation and stagnation. They reveal that 87% of respondents consider “stagflation, as opposed to hyperinflation or deflation, as the bigger risk to the economy.”
Actually, the GDP growth is commonly projected to slow down significantly next year. For example, according to the recent Fed’s dot-plot, the pace of the economic growth will decline from 7% in 2021 to 3.3% in 2022. It’s still fast, but less than half of this year’s growth. And it’s likely to be slower, as the FOMC members tend to be overly optimistic.
The stagflation scenario could be positive for gold, as the yellow metal likes the combination of sluggish (or even negative) growth and high inflation. Indeed, gold shined in the 1970s, the era of The Great Stagflation. Of course, there are important differences between then and now, but the economic laws are immutable: the mix of easy fiscal policy and monetary policy superimposed on economic reopening is a recipe for overheating and, ultimately, stagflation.
However, so far, the markets have bet on transitory inflation. Moreover, they are focused on fast economic expansion and the Fed’s hawkish signals. But we could see more uncertainty later this year when higher interest rates and inflation hamper the economic activity. In that case, gold could get back on track.
Thank you for reading today’s free analysis. If you enjoyed it, and would you like to know more about the links between the economic outlook, and the gold market, we invite you to read the July Gold Market Overview report. Please note that in addition to the above-mentioned free fundamental gold reports, and we provide premium daily Gold & Silver Trading Alerts with clear buy and sell signals. We provide these premium analyses also on a weekly basis in the form of Gold Investment Updates. In order to enjoy our gold analyses in their full scope, we invite you to subscribe today. If you’re not ready to subscribe yet though and are not on our gold mailing list yet, we urge you to sign up. It’s free and if you don’t like it, you can easily unsubscribe. Sign up today!
Arkadiusz Sieron, PhD
Sunshine Profits: Effective Investment through Diligence & Care.-----
Disclaimer: Please note that the aim of the above analysis is to discuss the likely long-term impact of the featured phenomenon on the price of gold and this analysis does not indicate (nor does it aim to do so) whether gold is likely to move higher or lower in the short- or medium term. In order to determine the latter, many additional factors need to be considered (i.e. sentiment, chart patterns, cycles, indicators, ratios, self-similar patterns and more) and we are taking them into account (and discussing the short- and medium-term outlook) in our Gold & Silver Trading Alerts.
-
Gold Asks: Has Inflation Already Peaked?
July 16, 2021, 4:16 PMInflation surged in May, and some worry that it has already reached its peak. Has it indeed? This issue is key for the Fed and the gold market.
Inflation has soared recently. The CPI annual rate surged 5% in May, which was the fastest jump since the Great Recession. However, the Fed officials still maintain that inflation will only be temporary. Some of the analysts even claim that inflation has already peaked, and it will decelerate from now on. Are they right?
Well, they present a few strong arguments. First, there is no doubt that the recent rise in prices has been partially caused by the problems with the supply chains. But, luckily, the bottlenecks are short-lived phenomena, and they always resolve themselves, i.e., by the magic of market mechanism. The best example may be lumber prices which were skyrocketing earlier this year but which have recently declined, as production surged in response to rallying prices.
Second, the detailed data on inflation shows that the surge in the overall inflation index was partially driven by categories that were heavily distorted by the pandemic, such as used cars or airline fares. The increases in these categories are not surprising or worrying, given the current recovery from the epidemic.
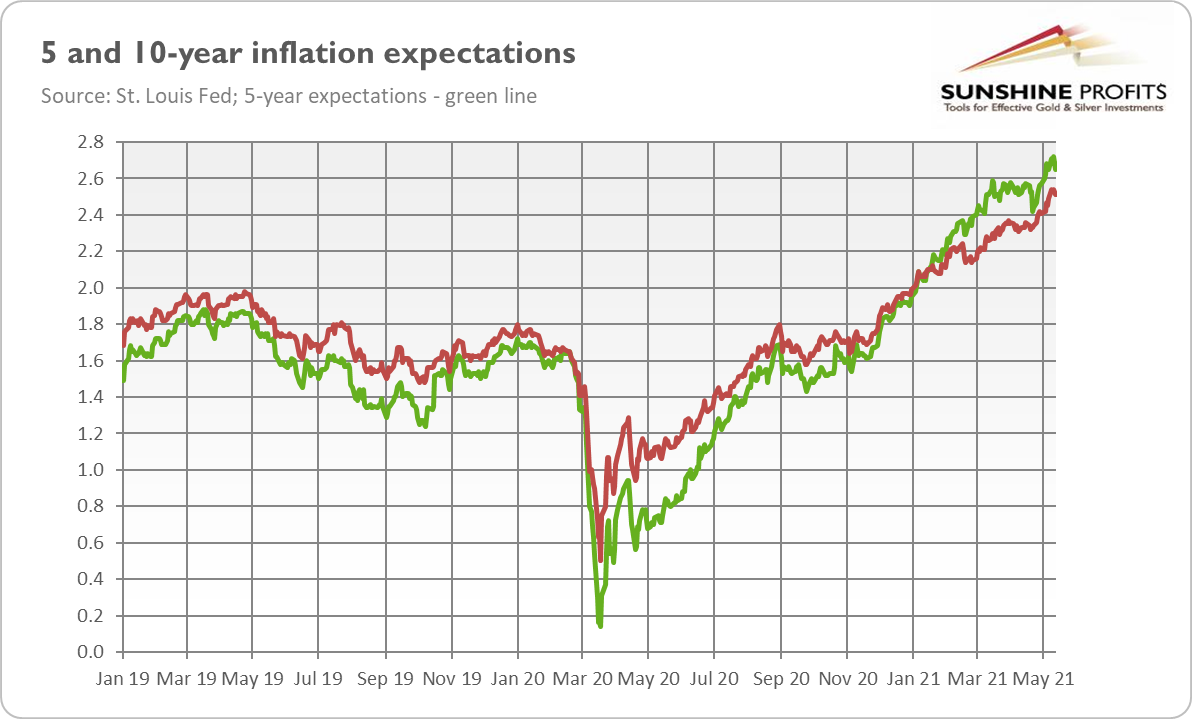
Third, the market-based inflation expectations have already peaked. As the chart below shows, both 5-year and 10-year breakeven inflation rates have reached their heights in May. Since then, the former ones have declined from above 2.7% to about 2.3%, while the latter from above 2.5% to about 2.2%
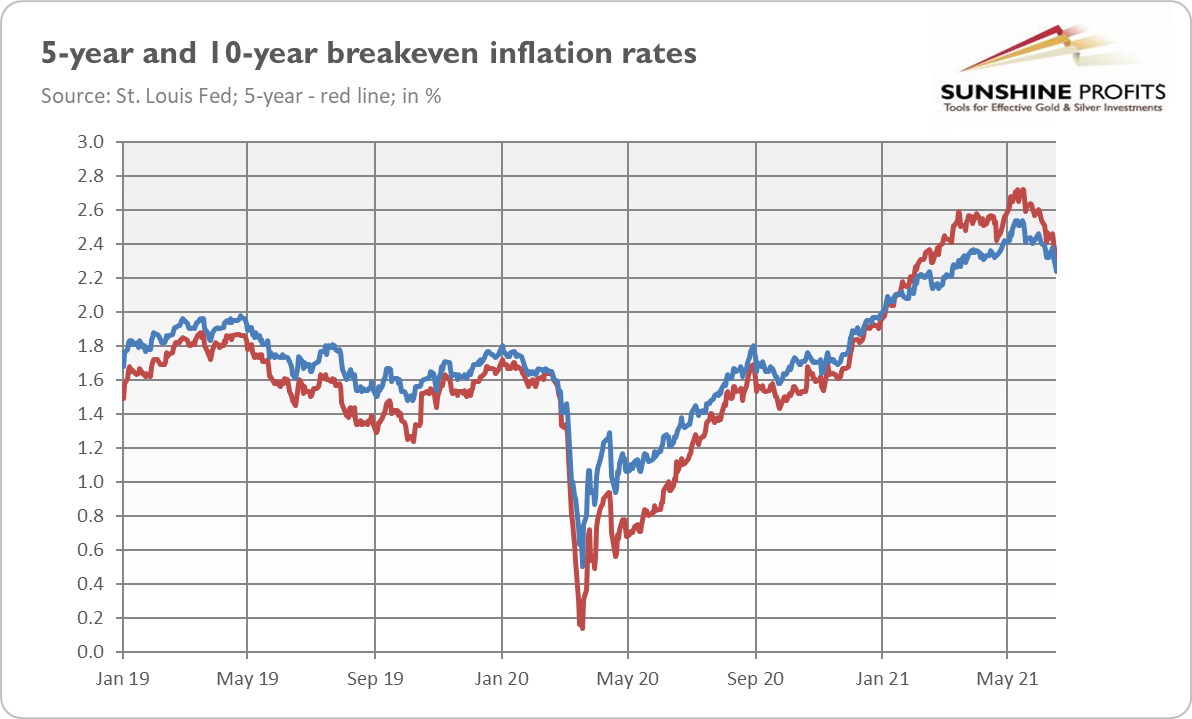
It means that the markets bought the Fed’s narrative about temporary inflation and started to worry less about it.
Should gold investors do the same? I’m not so sure. To be clear, I acknowledge and always acknowledged that the supply problems contributed to the acceleration in inflation. However, the risk of inflation doesn’t solely depend on continuously rising commodity prices. And the Fed officials always say that increases in inflation rates are temporary, as they don’t want to admit they failed in maintaining price stability.
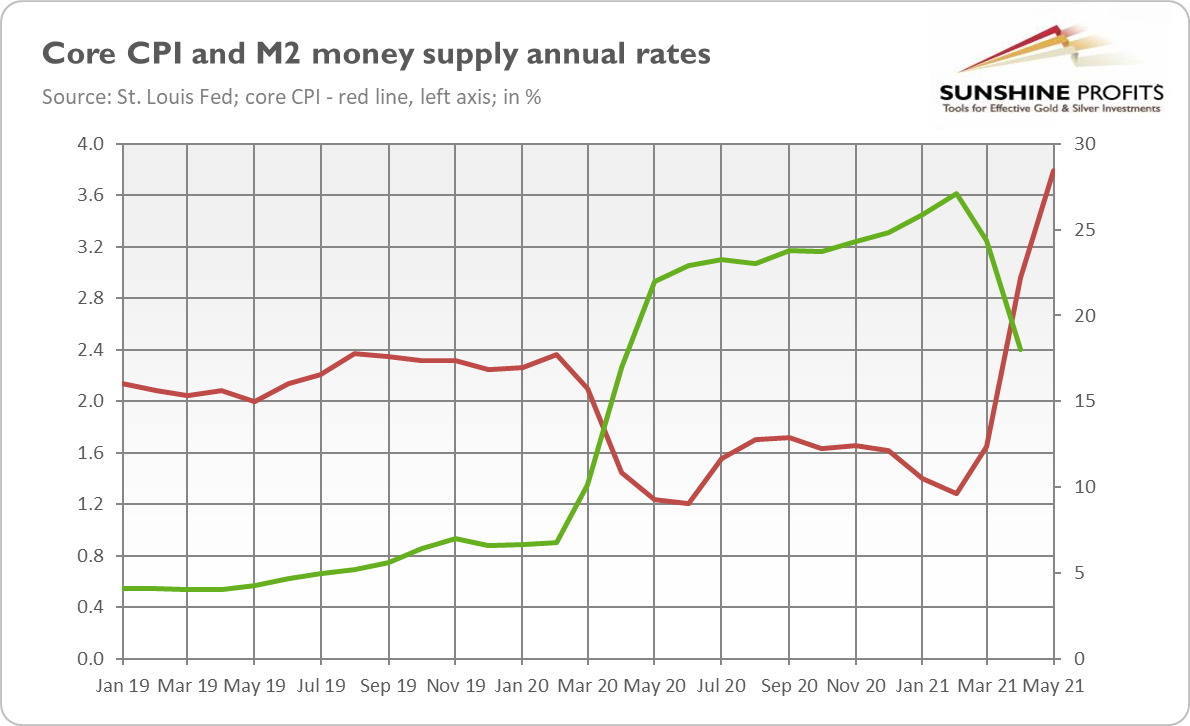
Some fundamental factors supporting high inflation are still in force. First, as the chart below shows, the broad money supply is still increasing fast (although there was a deceleration since February), as the monetary impulses probably haven’t been fully transmitted into the real economy yet.
Second, both the monetary and fiscal policies remain very easy. Given President Biden’s fiscal agenda and the continuous increase in the public debt, the Fed is unlikely to materially normalize its monetary policy.
Third, we know that in response to input cost inflation, producers raised their charges at an unprecedented pace. It means that their power to pass on greater costs has increased, which could increase both inflation and consumers’ expectations of inflation in the future.
Fourth, we have just finished recovering from the economic crisis. Usually, inflationary pressures only intensify with the progress of the business cycle. With a developing and then maturing economic expansion, employment will rise, manufacturing capacity will be more fully utilized, and inflation could prove to be more persistent than anticipated by the pundits. Please remember that the fiscal stimulus the economy got was greater than the estimated size of the output gap, so the risk of overheating is still present, even if some bottlenecks have resolved.
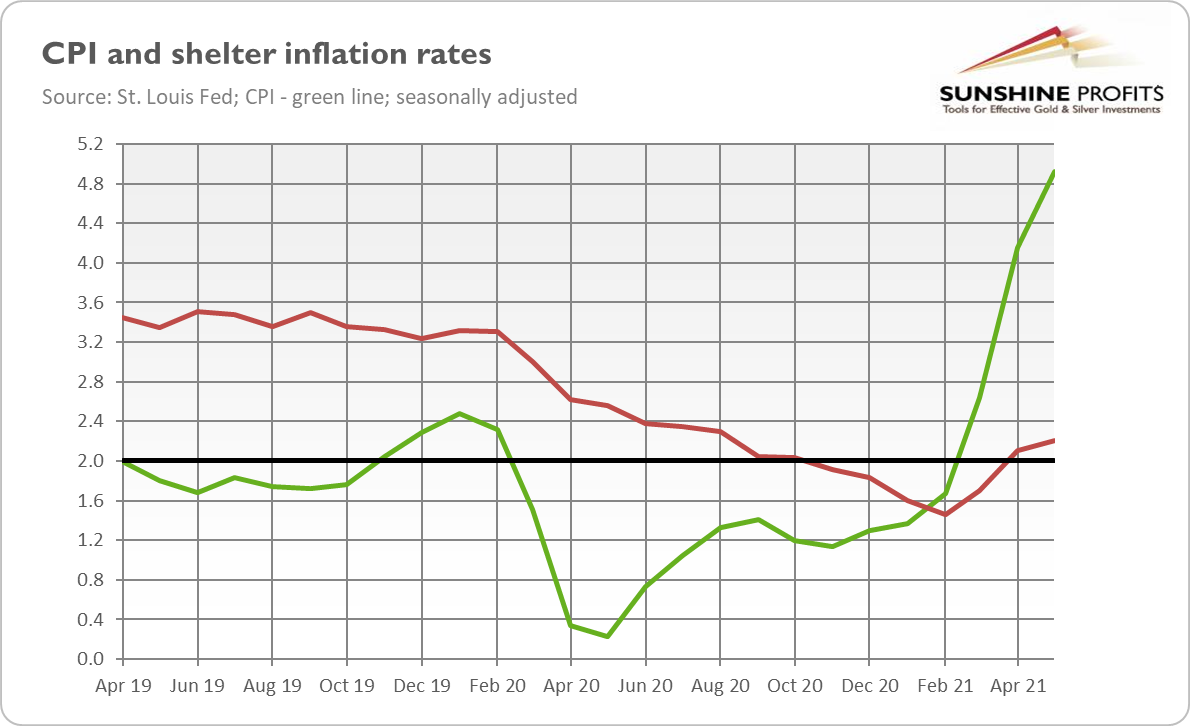
Last but not least, the rise in inflation wasn’t driven solely by the recovery from the pandemic. Some categories which were severely hit by the epidemic are not surging. For example, the index for food away from home rose annually by 4% in May 2021. Meanwhile, some core components surged. For instance, the index for shelter, which makes almost one-third of the overall index, increased from 1.5% in February to 2.2% in May 2021, as the chart below shows. It suggests that inflation may be more broad-based than many analysts think.
What does all this mean for the gold market? Well, if inflation remains high or even continues to rise, the real interest rates will remain in negative territory, supporting gold prices. However, there is an important caveat: upward inflationary surprises could force the Fed to send fresh hawkish messages or even taper its quantitative easing earlier than planned, pushing the nominal bond yields higher and creating selling pressure on gold prices.
It seems that so far investors were more worried by the sooner-than-expected hikes in the federal funds rate than by the rising inflation and the fact that the FOMC members have raised their inflation forecasts by an entire percentage point. Gold bulls need a shift in investors’ focus. Otherwise, the markets could remain optimistic about the future, purchasing risky assets rather than safe havens such as gold.
Thank you for reading today’s free analysis. If you enjoyed it, and would you like to know more about the links between the economic outlook, and the gold market, we invite you to read the July Gold Market Overview report. Please note that in addition to the above-mentioned free fundamental gold reports, and we provide premium daily Gold & Silver Trading Alerts with clear buy and sell signals. We provide these premium analyses also on a weekly basis in the form of Gold Investment Updates. In order to enjoy our gold analyses in their full scope, we invite you to subscribe today. If you’re not ready to subscribe yet though and are not on our gold mailing list yet, we urge you to sign up. It’s free and if you don’t like it, you can easily unsubscribe. Sign up today!
Arkadiusz Sieron, PhD
Sunshine Profits: Effective Investment through Diligence & Care.-----
Disclaimer: Please note that the aim of the above analysis is to discuss the likely long-term impact of the featured phenomenon on the price of gold and this analysis does not indicate (nor does it aim to do so) whether gold is likely to move higher or lower in the short- or medium term. In order to determine the latter, many additional factors need to be considered (i.e. sentiment, chart patterns, cycles, indicators, ratios, self-similar patterns and more) and we are taking them into account (and discussing the short- and medium-term outlook) in our Gold & Silver Trading Alerts.
-
Is There Any Gold in Basel?
July 9, 2021, 9:05 AMAt the end of June, the Basel III accord became binding for European banks. This new set of rules could have an effect on the entire gold market.
On June 28, the Basel III agreement came into force for EU, Swiss, and US banks. On January 1, 2022, it will also be binding for British banks, so I guess it’s high time to cover this issue in the Gold Market Overview.
So, let’s begin by explaining what the Basel III accord is. It is a set of financial reforms that were agreed in 2010 after the Great Recession revealed some “deficiencies” in the global financial system. The name comes from the Basel Committee on Banking Supervision at the Bank for International Settlements, which is based in Basel, Switzerland. The main idea behind the third Basel Standards is to strengthen bank capital requirements in order to limit the risk taken by commercial banks and prevent the replay of the global financial crisis of 2007-2009.
OK, great, the idea of more prudent commercial banks is glorious, but what does Basel III have to do with gold? Well, it turns out quite a lot! First, physical or allocated gold could be treated as a risk-free asset. As we can read in the Basel framework (p. 192), “at national discretion, gold bullion held in own vaults or on an allocated basis to the extent backed by bullion liabilities can be treated as cash and therefore risk-weighted at 0%”.
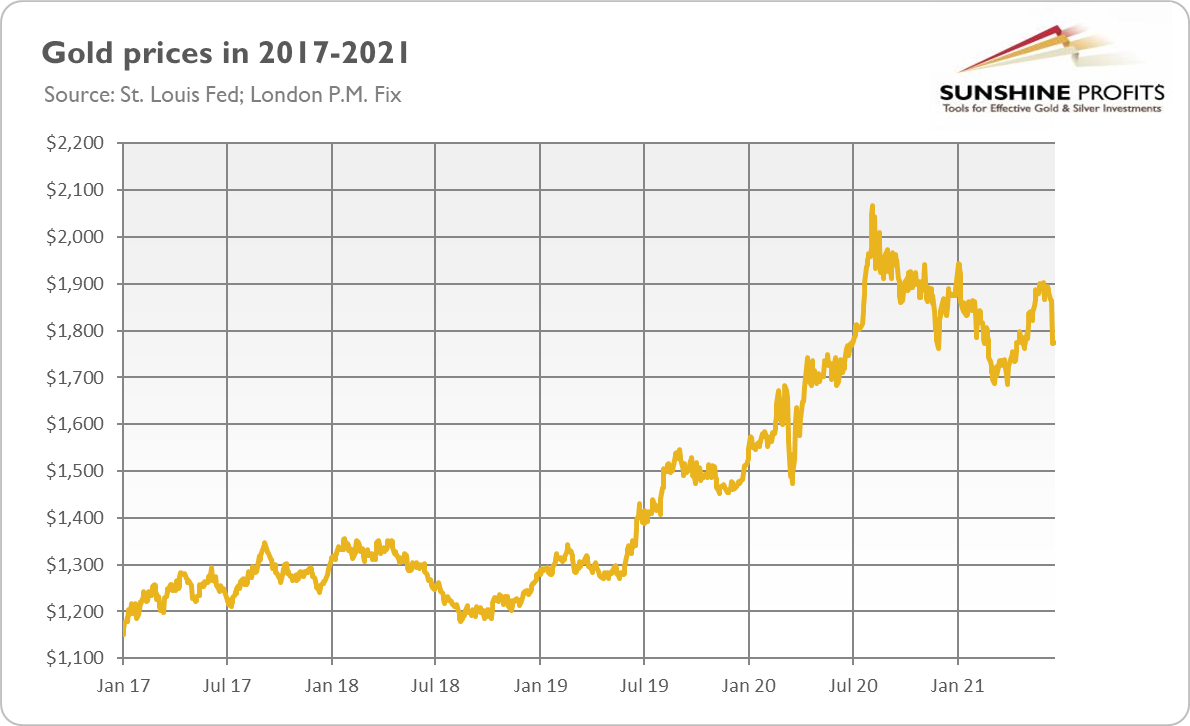
This reform, if introduced now and analyzed separately, would be bullish for gold, as considering gold a risk-free asset makes it less costly and more attractive for banks to hold. However, the announcement of this particular decision goes back to 2017 and its implementation to April 2019. The chart below shows that this announcement didn’t cause any rally in gold.
However, now this change will be accompanied by another rule. It’s the Net Stable Funding Ratio requirement, which obliges banks to hold enough stable funding to cover their long-term assets. The key ramification is that this new rule requires banks to have stable funding at 85% of unallocated gold. In other words, the precious metals transactions undertaken by clearing banks have to be backed now in 85% by gold. Or, the reserve ratio has, in a sense, increased from the pre-Basel III level of 0% to 85%. As mentioned in the framework (p. 977), “Assets assigned an 85% RSF [requires stable funding] factor comprise: (…) physical traded commodities, including gold”.
So, for example, let’s assume that a bank has $10 billion in gold positions, with $2 billion in allocated gold and $8 billion in unallocated gold. Under Basel III, the allocated gold is fine, but unallocated gold is considered as risky as equities, and banks have to provide collaterals for 85% of its value, in cash or physical gold.
The direct consequences for the banking sector are clear. The handling of unallocated gold will become more expensive, undermining the pre-Basel bullion business model. So, some banks will exit the precious metals market (Nova Scotiabank has already exited it), while remaining clearing banks will be forced to increase the costs they charge or to raise the shareholders’ equity to provide the required reserves.
The indirect effects on the yellow metal are more difficult to predict. Some analysts believe that Basel III will hit the precious metals market, sending gold prices down. The reason is that the new framework makes unallocated gold less attractive, and unallocated gold performs some valuable functions like providing liquidity for gold producers, refiners, jewelry, etc. So, the gold market will become less liquid, which will reduce gold’s attractiveness as a portfolio element for all would-be investors.
In other words, under Basel III, the cost of holding gold on banks’ balance sheets increases, undermining the clearing and settlement system of the precious metals and hurting the part of gold demand that relies on the unallocated gold market.
However, some claim that Basel III will be fundamentally bullish for gold, especially for physical gold. The reasoning goes as follows: the new regulations will diminish the profitability of trading gold derivatives, reducing the supply of unallocated paper gold. Meanwhile, as physical, allocated gold is a risk-free asset, market participants will move from paper gold to physical bullion, pushing its price higher. As there is – the argumentation continues – price suppression in the paper gold derivatives like Comex gold futures and London LBMA forwards, the significance of physical gold will increase and the true price of gold will rise. In other words, Basel III is believed to cause a liquidity squeeze in the physical metal, which could send gold prices higher.
As one can see, this view assumes the existence of systematic price suppression, which is far from being proven. But we can hold the bullish view without assuming price manipulation. This is because unallocated gold accounts function similarly to fractional reserve banking: banks have only part of gold deposited at them. But now, the reserve ratio is 85%, up from 0%, which means that the supply of unbacked gold positions will have to diminish (or banks will have to buy more physical gold or other risk-free assets to back them). In other words, banks will try to cover their short positions of gold in order to fulfill the NSFR requirement; and the decrease in the supply of gold should increase its price.
However, I suspect that gold bulls’ hopes about Basel III could be exaggerated. It doesn’t have to be a game-changer for gold prices – instead, we could just see fewer clearing banks, higher costs charged by the remaining ones, and lower liquidity in the gold market. Stronger demand for physical gold doesn’t have to transform into a rally in gold prices, as these are shaped in the international ‘paper’ markets.
Additionally, the announcement of reclassification of the risk weighting of gold didn’t make gold skyrocket. The price of gold did start to rally in 2019, but it was quite likely caused by the dovish U-turn of the US central bank. So, the recent regulatory changes don’t have to push gold prices higher, especially if expectations of the Fed’s tightening cycle increase and the real interest rates rise. But maybe later, closer to 2022 (when Basel III finally takes effect in the UK), we will see some upward movement, as most of the unallocated gold is traded on the London gold market.
Thank you for reading today’s free analysis. If you enjoyed it, and would you like to know more about the links between the economic outlook, and the gold market, we invite you to read the July Gold Market Overview report. Please note that in addition to the above-mentioned free fundamental gold reports, and we provide premium daily Gold & Silver Trading Alerts with clear buy and sell signals. We provide these premium analyses also on a weekly basis in the form of Gold Investment Updates. In order to enjoy our gold analyses in their full scope, we invite you to subscribe today. If you’re not ready to subscribe yet though and are not on our gold mailing list yet, we urge you to sign up. It’s free and if you don’t like it, you can easily unsubscribe. Sign up today!
Arkadiusz Sieron, PhD
Sunshine Profits: Effective Investment through Diligence & Care.-----
Disclaimer: Please note that the aim of the above analysis is to discuss the likely long-term impact of the featured phenomenon on the price of gold and this analysis does not indicate (nor does it aim to do so) whether gold is likely to move higher or lower in the short- or medium term. In order to determine the latter, many additional factors need to be considered (i.e. sentiment, chart patterns, cycles, indicators, ratios, self-similar patterns and more) and we are taking them into account (and discussing the short- and medium-term outlook) in our Gold & Silver Trading Alerts.
-
Will Fed Hawks Peck Gold?
July 2, 2021, 10:33 AMAlthough gold doesn’t have to suffer during the actual tightening cycle, the Fed’s hawkish turn is fundamentally negative for gold prices.
Oh no, my worst nightmare related to the precious metals has materialized. In the June edition of the Gold Market Overview, I wrote:
Of course, gold is not a perfect inflation hedge in the short term. If the interest rates increase or the Fed tightens the monetary conditions in response to inflation, gold may struggle. Actually, the start of normalization of the monetary policy could push gold downward, just as it happened in 2011.
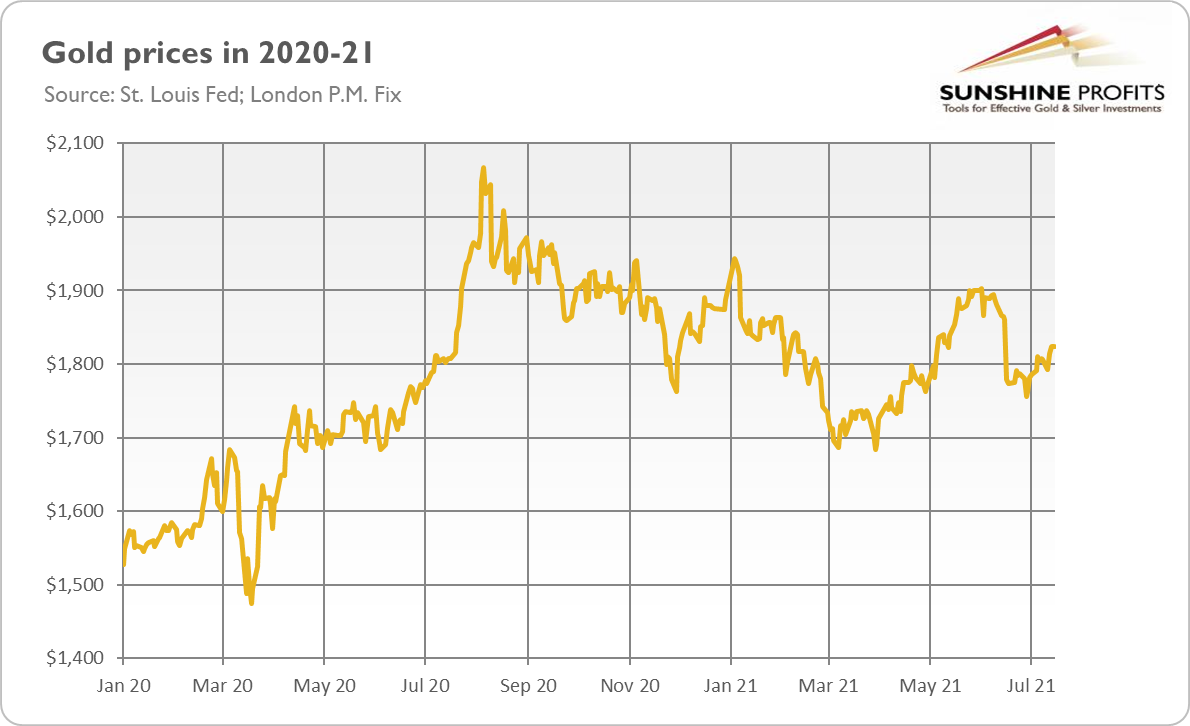
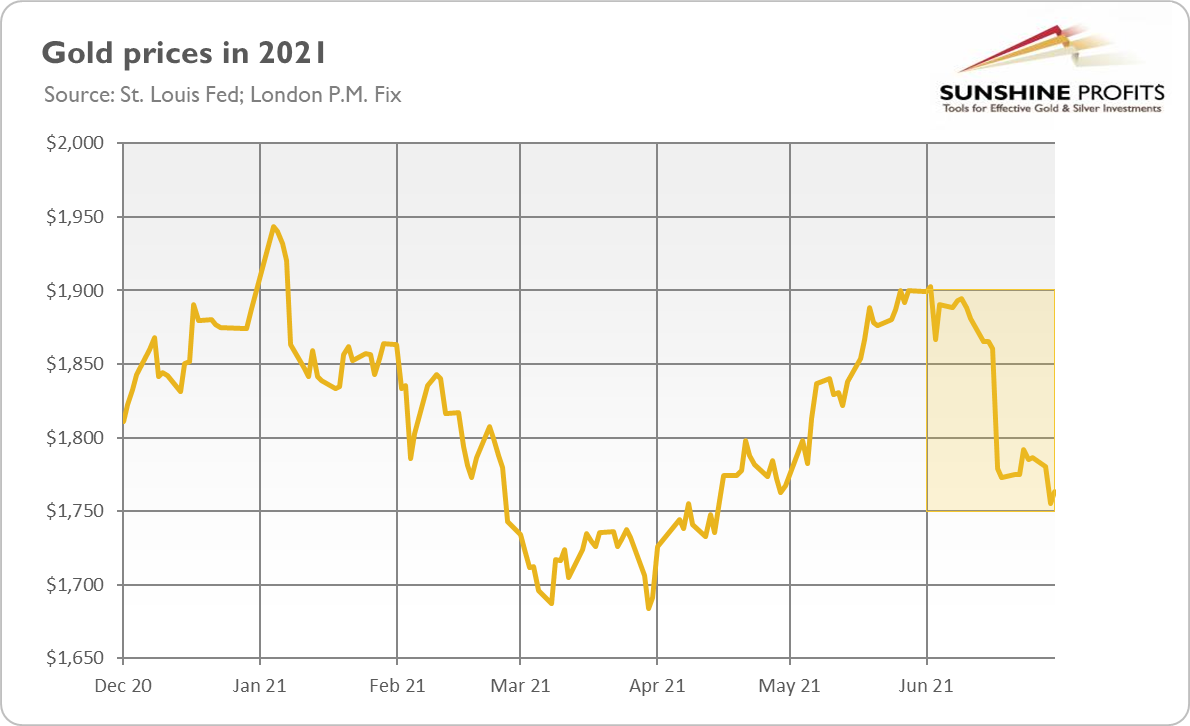
And indeed, the Fed turned hawkish in June. The FOMC members started talking about tapering quantitative easing, and at the same time the recent dot-plot revealed great willingness among them to hike interest rates. And, in line with the prediction, gold prices plunged in response to the Fed’s hawkish signals about possible normalization of the monetary policy. As the chart below shows, the London (P.M. Fix) price of gold declined from $1,895 to $1,763 in June.
Now, the key question is: what’s next for gold? Was the June slide just a correction? An exaggerated reaction to the not-so-meaningful economic projections of the FOMC members? After all, “they do not represent a Committee decision” and they “are not a great forecaster of future rate moves”, as Powell reminded in the prepared remarks for his press conference in June.
But maybe it's the other way around? Did the Fed’s about-face mark the end of the bull market in gold? Are we witnessing a replay of 2013, where expectations of the Fed’s tightening cycle and higher interest rates (and later the taper tantrum) sent gold lower, pushing it into bears’ embrace?
To find out, let’s check how gold behaved in the previous tightening cycles. As one can see in the chart below, the last tightening cycle of 2015-2019 wasn’t very detrimental for the yellow metal; gold prices weren’t declining, they remained in the sideways trend.
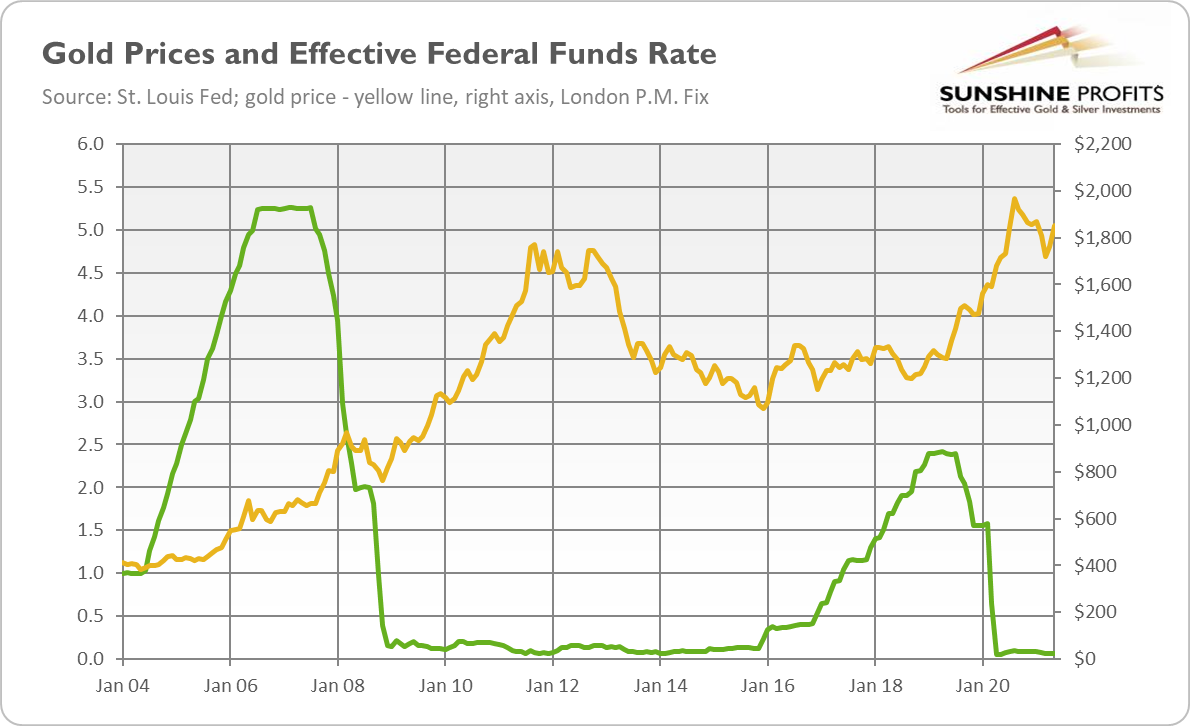
Of course, the tightening created downward pressure on gold. We can see that its price started to rally when the normalization ended, and it accelerated when the Fed turned dovish and started the cycle of interest rate cuts. However, gold didn’t enter a bear market; it’s consoling news for all gold bulls.
Neither the tightening cycle of 2004-2006 was negative for gold prices. On the contrary, the price of gold appreciated in that period. Interestingly, it was a period of rising inflation, as the chart below shows. Similarly, the tightening cycle of the mid-1970s was accompanied by accelerating CPI annual rates, and it was also a positive period for gold.
Hence, the upcoming tightening cycle doesn’t have to be bad for the yellow metal. If it is accompanied by rising inflation, gold may rise in tandem with the federal funds rate. So, it turns out that the key is not the actual changes in the Fed’s policy and interest rates, but the expectations of these changes, which translate into the real interest rates.
Indeed, the chart below reveals a strong positive correlation between gold prices and real interest rates. It shows that gold suffered not from the actual previous tightening cycle, but from the expectations of the tightening cycle. As one can see in the chart, the yellow metal definitely entered a bear market in late 2012, just when the real interest rates bottomed out. And then, gold prices plunged in 2013 amid the taper tantrum, when the surprising announcement of tapering of asset purchases by Ben Bernanke pushed the bond yields much higher. Importantly, the actual tapering began a few months later, while the first interest rate hike came only in December 2015.
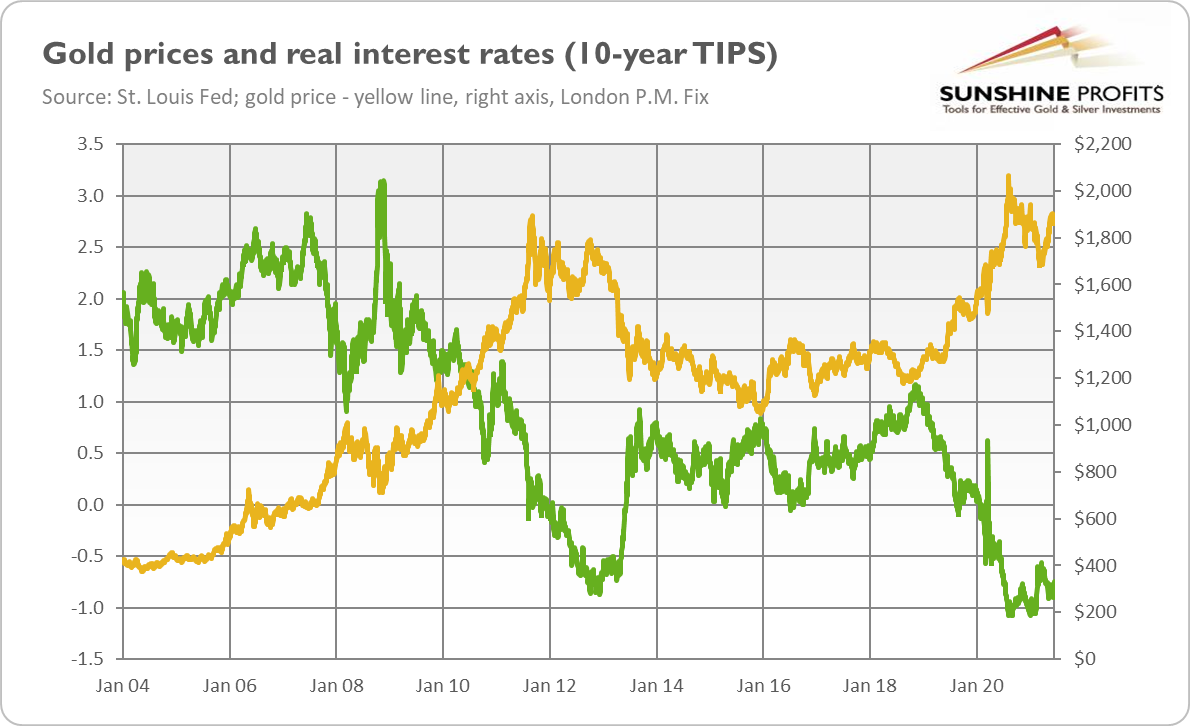
So, what does this short review of the previous tightening cycles imply for the gold market? Well, the good news is that gold doesn’t have to suffer from the tightening cycle, especially if higher inflation turns out to be more lasting than commonly believed. This is because the real interest rates will remain low. And, given the increase in the public debt, Wall Street’s addiction to easy money, and the Fed’s dovish bias, the upcoming tightening will probably be less tight than the previous ones.
However, I also have some bad news. First, it might be the case that inflation and inflation expectations have already peaked in May, while the real interest rates have reached the bottom. In this scenario, the outlook for gold is rather grim.
Second, although gold may be fine with the actual tightening cycle, we are in the expectations phase. And what do I mean by that? Investors are betting that the Fed will start tightening its monetary policy soon; for example, they expect the official announcement on tapering as early as September 2021. And the expectations are what matters. The Fed’s meeting in June could have been a mini taper-tantrum, as it surprised investors, the bond yields rose, and the price of gold plunged. So, if history is any guide, it seems that gold still has more room to slide.
Thank you for reading today’s free analysis. If you enjoyed it, and would you like to know more about the links between the economic outlook, and the gold market, we invite you to read the July Gold Market Overview report. Please note that in addition to the above-mentioned free fundamental gold reports, and we provide premium daily Gold & Silver Trading Alerts with clear buy and sell signals. We provide these premium analyses also on a weekly basis in the form of Gold Investment Updates. In order to enjoy our gold analyses in their full scope, we invite you to subscribe today. If you’re not ready to subscribe yet though and are not on our gold mailing list yet, we urge you to sign up. It’s free and if you don’t like it, you can easily unsubscribe. Sign up today!
Arkadiusz Sieron, PhD
Sunshine Profits: Effective Investment through Diligence & Care.-----
Disclaimer: Please note that the aim of the above analysis is to discuss the likely long-term impact of the featured phenomenon on the price of gold and this analysis does not indicate (nor does it aim to do so) whether gold is likely to move higher or lower in the short- or medium term. In order to determine the latter, many additional factors need to be considered (i.e. sentiment, chart patterns, cycles, indicators, ratios, self-similar patterns and more) and we are taking them into account (and discussing the short- and medium-term outlook) in our Gold & Silver Trading Alerts.
-
Is There a Next Housing Bubble That Will Make Gold Shine?
June 25, 2021, 10:06 AMHome prices are surging, making some investors worry about the housing market. These fears seem to be exaggerated, but bubble-like conditions are widespread.
House prices are surging. As the chart below shows, the S&P/Case-Shiller U.S. National Home Price Index has reached 239 in February 2021, the highest number in history and about 30% higher than during the 2006 peak.
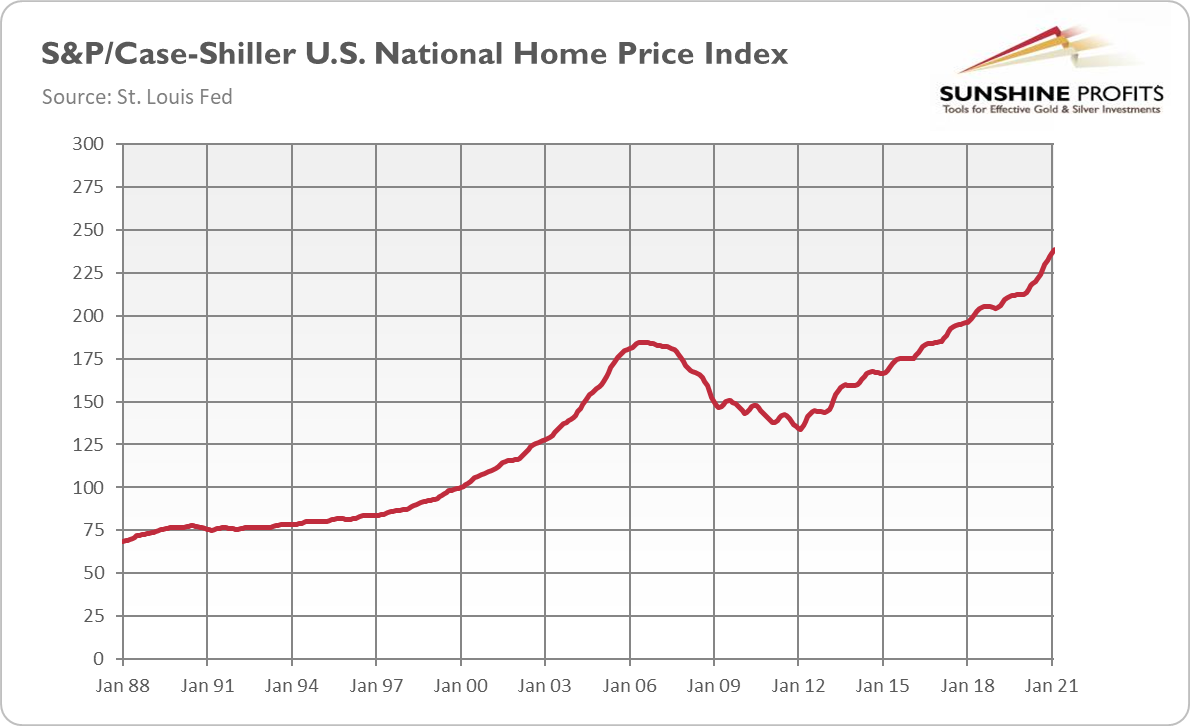
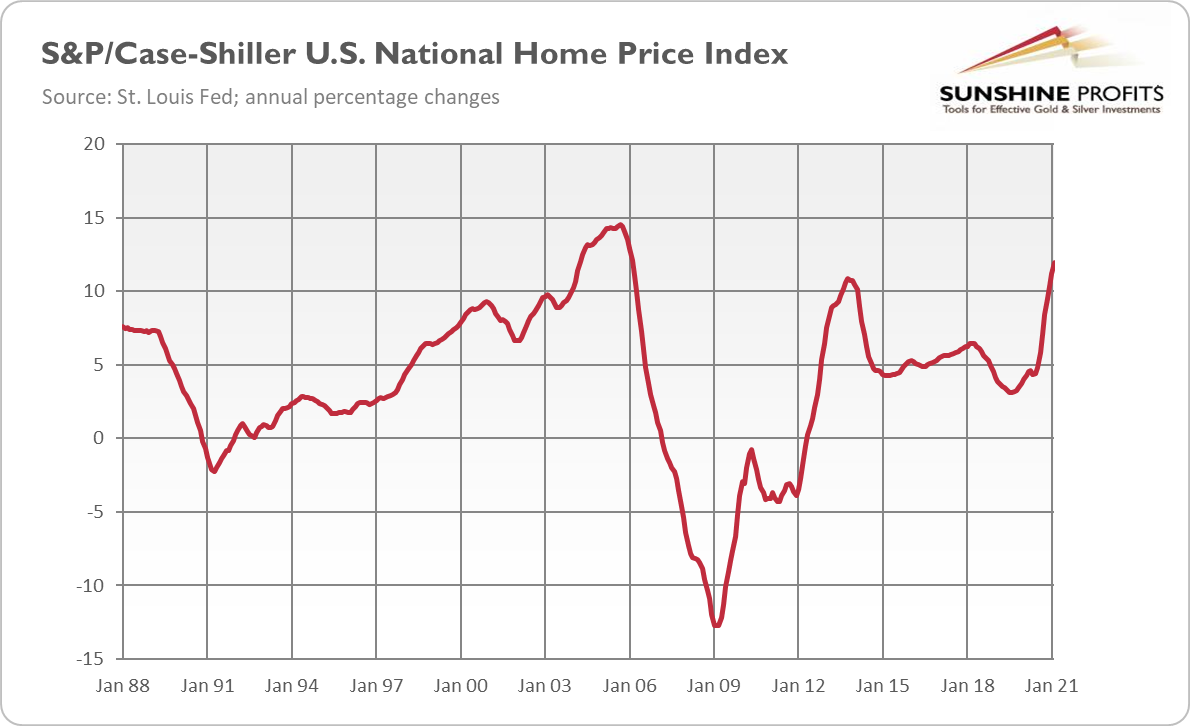
What’s more, the National Home Price Index has jumped 12% year-over-year in February, which is the highest annualized gain since January 2006 when the housing bubble started deflating as can be seen in the chart below. At the same time, inventory in many regions has hit record lows.
Not surprisingly, some analysts started to worry about the formation of the next housing bubble. The previous one led to the global financial crisis. However, at least some part of the recent increases can be explained by other factors than mere expectations of price increases, which characterizes a bubble.
The mortgage rates plunged thanks to the Fed’s zero-interest-rate policy and accommodative monetary policy. The easy fiscal policy with stimulus checks also added fuel to the fire, especially given that people couldn’t spend money on services, so they spent more on housing.
The demographic factors also helped to move prices up. Many Millennials have just entered the prime home-buying age, and the pandemic made a lot of people demand more space as they work remotely.
In other words, the recent surge in prices is likely a result of an imbalance between tight supply (that rises too slowly to meet booming demand fueled by low interest rates) and income growth rather than an irrational exuberance. Furthermore, lending standards are also tighter now. Please take a look at the chart below, which shows the home price index vis-à-vis the GDP (presented also as an index).
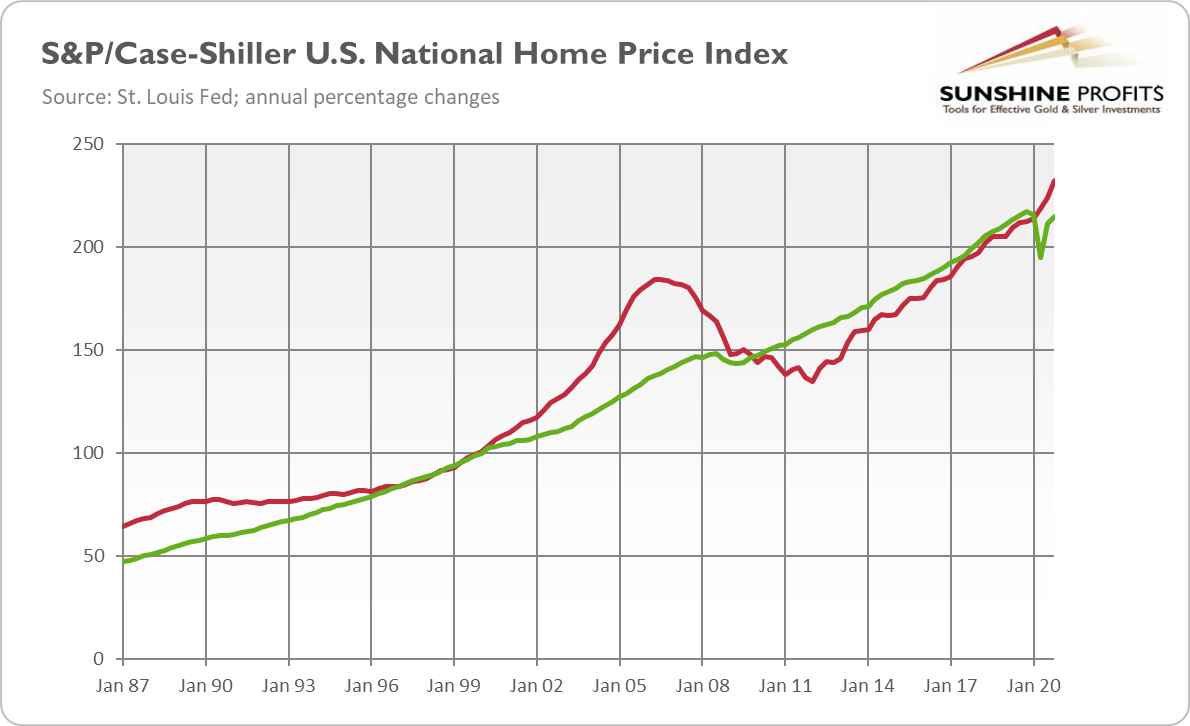
As one can see, in the 2000s there was a clear, huge divergence between the pace of GDP growth and the pace of home prices’ appreciation that lasted a few years before the bubble burst. But since the end of the Great Recession, the growth in house prices was below the GDP growth. Therefore, I would say that there is no bubble in the housing market. Not yet, at least – house prices started to diverge from GDP growth during the pandemic recession…
Hence, it would be smart to monitor the housing market carefully. However, so far, gold bulls shouldn’t count on the housing bubble and its burst as important factor that could support the price of the yellow metal. Nevertheless, the recent ultra-low real interest rates and high inflation should support both: gold and houses. After all, they are both hard assets sensitive to interest rates and are being eagerly bought during inflationary periods.
More importantly, despite the fact that it’s maybe too early to call the national bubble in the housing market (although some locations are really hot), in many markets there are bubble-like conditions. Just think about soaring stock market indices reaching one record after another. Or negative-yielding bonds worth about $18 trillion. Or surging used car prices that have just hit an all-time high. Or lumber that has become America’s hottest commodity.
Or Dogecoin, a cryptocurrency that was created as a joke. It has gained about 8,500% this year, despite the recent sell-off in the cryptocurrency market. As a popular tweet commented on this, “Moderna created a lifesaving vaccine in record time and is worth $70 billion. Dogecoin became a meme and is worth $87 Billion.”
The widespread character of these price increases is the reason why some analysts refer to the “everything bubble”. It might be an exaggeration, but the scope of bubble-like conditions clearly shows that markets are awash in liquidity. All this new money supply and excess liquidity simply entered the economy, exerting inflationary pressure across the board and boosting mainly risk assets.
Indeed, there is inflation, but still mainly in the asset markets, not in the consumer sphere. However, this is changing, as the April CPI reading has clearly indicated. Producer/commodity inflation could advance into the next stage in which consumer prices are also generally increasing. Inflated asset valuations and rising prices of goods suggest that caution is warranted, and it would be smart to allocate some portion of the investment portfolio toward gold.
The bottom line is that the global expansion will continue, which is bad for gold. However, the growth is fueled by excessive liquidity and ultra-low interest rates, which also creates inflationary pressure and bubble-like conditions. Gold could be supported by all this – it may even thrive if inflation turns out to be higher and more lasting than it’s widely believed.
Thank you for reading today’s free analysis. If you enjoyed it, and would you like to know more about the links between the economic outlook, the current (past?) crisis and the gold market, we invite you to read the June Gold Market Overview report. Please note that in addition to the above-mentioned free fundamental gold reports, and we provide premium daily Gold & Silver Trading Alerts with clear buy and sell signals. We provide these premium analyses also on a weekly basis in the form of Gold Investment Updates. In order to enjoy our gold analyses in their full scope, we invite you to subscribe today. If you’re not ready to subscribe yet though and are not on our gold mailing list yet, we urge you to sign up. It’s free and if you don’t like it, you can easily unsubscribe. Sign up today!
Arkadiusz Sieron, PhD
Sunshine Profits: Effective Investment through Diligence & Care.-----
Disclaimer: Please note that the aim of the above analysis is to discuss the likely long-term impact of the featured phenomenon on the price of gold and this analysis does not indicate (nor does it aim to do so) whether gold is likely to move higher or lower in the short- or medium term. In order to determine the latter, many additional factors need to be considered (i.e. sentiment, chart patterns, cycles, indicators, ratios, self-similar patterns and more) and we are taking them into account (and discussing the short- and medium-term outlook) in our Gold & Silver Trading Alerts.
-
Gold Asks: Will the Economic Boom Continue?
June 17, 2021, 9:33 AMThe US GDP has already recovered from the pandemic recession. What’s next for the economy and the gold market?
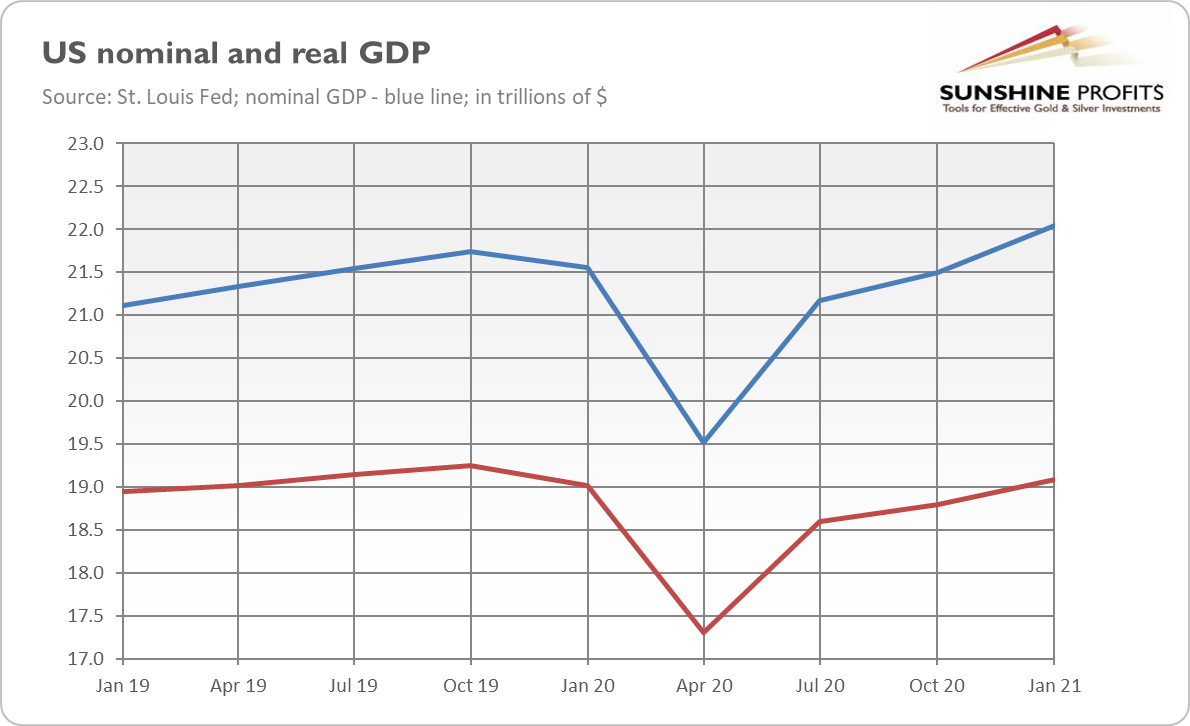
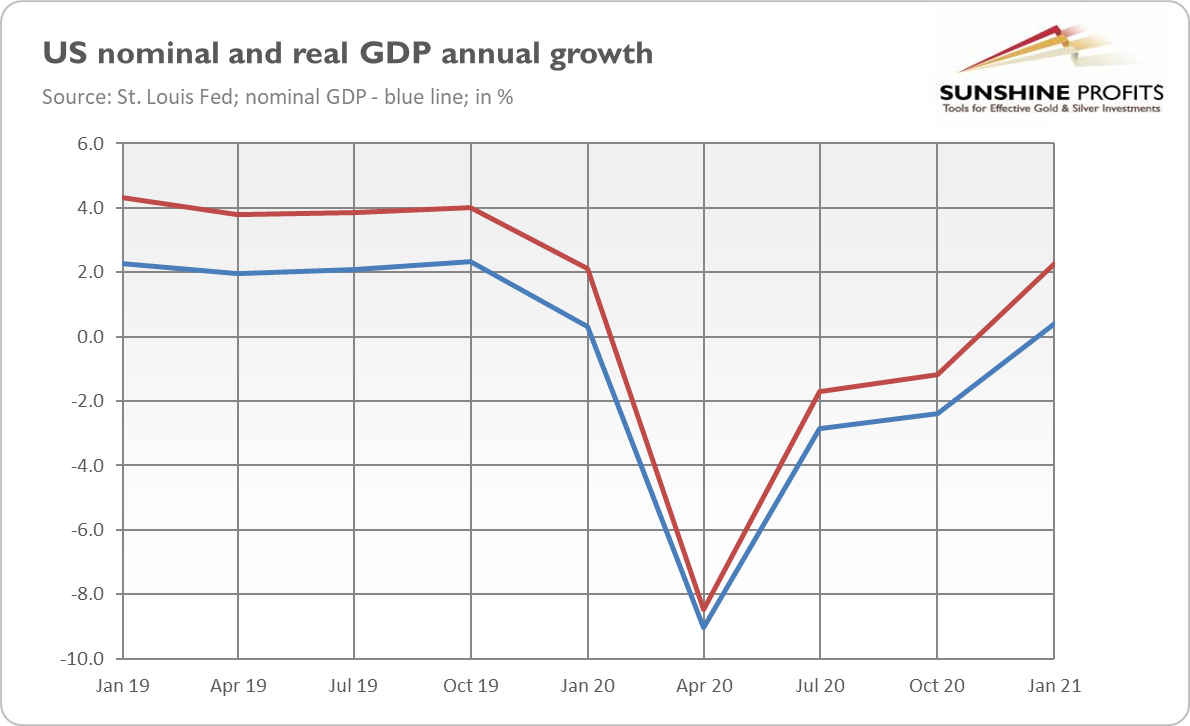
Ladies and Gentlemen, the economic crisis has ended. Actually, not only is the recession over but so is the recovery! This is at least what the recent GDP readings are indicating. As the chart below shows, the US nominal GDP has already jumped above the pre-pandemic level. The real GDP, which takes inflation into account, remained in the first quarter of 2021 below the size of the economy seen at the end of 2019, but it will likely surpass this level in the second quarter of the year.
As one can see in the chart below, in terms of GDP growth, the situation is a bit worse, as the annual percentage changes are still below the pre-epidemic level. However, this should change in the second quarter of 2021 when the growth pace is likely to peak amid base effect and reopening of the economy.
So, the question is: what’s next? Will the economic boom become well-established or will we see a lot of volatility or even new slumps? Given the recent flux of disappointing high-frequency indicators that fell considerably short of expectations (just think about April’s nonfarm payrolls), the question is very relevant.
Well, there are many threats to growth, that’s for sure. The first is, of course, the ever-evolving coronavirus and its new variants. However, judging by preliminary evidence, the vaccines should remain effective, allowing economies to function freely.
The second obvious danger is clearly the economy overheating and higher inflation. The Fed and the Congress injected a lot of liquidity into the economy although it would recover if it was left to its own devices thanks to the rollout of vaccinations and easing lockdowns. So, much of government funds arrived just when the economy practically recovered, which is a recipe for higher prices and inflation-related turbulences in the financial markets.
Third, the increase in debt – both private and public – makes the global economy more fragile. Given the level of indebtedness, even small increases in real interest rates would be dangerous. They would increase the costs of servicing debts for the governments and could hit the asset prices. The fact that the Fed will be under great pressure to remain very dovish is, of course, positive for gold prices. Even if we see some effort to normalize the monetary policy, interest rates and the Fed’s balance sheet will never return to the pre-recession levels.
Last but not least, there is a threat of financial crisis. Many people are worried that there is a bubble in the stock market (and in other markets as well, such as the cryptocurrency market). Indeed, the equities have been reaching new peaks and the valuations are elevated. The margin debt has also jumped. Not surprisingly, the relative frequency of Google searches for the “stock market bubble” has recently risen (just as for the word “inflation”).
Even the Fed in its latest Financial Stability Report expressed some concerns. This is what the Fed Governor Lael Brainard said in a statement linked to the report:
Vulnerabilities associated with elevated risk appetite are rising. Valuations across a range of asset classes have continued to rise from levels that were already elevated late last year. Equity indices are setting new highs, equity prices relative to forecasts of earnings are near the top of their historical distribution, and the appetite for risk has increased broadly, as the "meme stock" episode demonstrated. Corporate bond markets are also seeing elevated risk appetite, and the spreads of lower quality speculative-grade bonds relative to Treasury yields are among the tightest we have seen historically. The combination of stretched valuations with very high levels of corporate indebtedness bear watching because of the potential to amplify the effects of a re-pricing event.
To sum up, the US economy has already recovered from the coronavirus recession, which is bad for safe-haven assets such as gold, as the yellow metal doesn’t like economic expansions. However, there are important threats to sustainable economic growth, which should support the price of gold.
Actually, there is still room for gold to rally further. This is because we are in an inflationary phase of the economic expansion (this boom will be more inflationary than the post-Great Recession period), and all the money created during the pandemic has flowed into the asset markets, pushing their prices into elevated levels not necessarily justified by fundamentals (just think about Dogecoin). Gold could benefit from such a bubble, as well as from an inflationary and hot environment.
Thank you for reading today’s free analysis. If you enjoyed it, and would you like to know more about the links between the economic outlook, the current (past?) crisis and the gold market, we invite you to read the June Gold Market Overview report. Please note that in addition to the above-mentioned free fundamental gold reports, and we provide premium daily Gold & Silver Trading Alerts with clear buy and sell signals. We provide these premium analyses also on a weekly basis in the form of Gold Investment Updates. In order to enjoy our gold analyses in their full scope, we invite you to subscribe today. If you’re not ready to subscribe yet though and are not on our gold mailing list yet, we urge you to sign up. It’s free and if you don’t like it, you can easily unsubscribe. Sign up today!
Arkadiusz Sieron, PhD
Sunshine Profits: Effective Investment through Diligence & Care.-----
Disclaimer: Please note that the aim of the above analysis is to discuss the likely long-term impact of the featured phenomenon on the price of gold and this analysis does not indicate (nor does it aim to do so) whether gold is likely to move higher or lower in the short- or medium term. In order to determine the latter, many additional factors need to be considered (i.e. sentiment, chart patterns, cycles, indicators, ratios, self-similar patterns and more) and we are taking them into account (and discussing the short- and medium-term outlook) in our Gold & Silver Trading Alerts.
-
Is Gold Really an Inflation Hedge?
June 11, 2021, 10:48 AMInflation is back, and that’s usually depicted as good for gold. But is the yellow metal still a hedge against inflation, or has something changed?
Inflation has returned. This is partly understandable. After all, during the Covid recession, consumers and businesses accumulated a lot of cash as their spending was reduced, while revenues were sustained by money transfers from the government. These funds are now entering the economy, which makes demand grow much faster than supply, thus boosting prices. After some time, supply may catch up, curbing inflation. However, there is an important risk that inflation will turn out to be higher and/or more permanent than many analysts believe.
From the fundamental point of view, gold should benefit from higher inflation. But why? In theory, there are several channels by which inflation supports the yellow metal. First, the inflationary increase in the money supply makes all goods and services more expensive, including gold. Indeed, the scientific paper by Lucey and others finds a reliable long-run relationship between gold and the US money supply.
Second, gold is a real, tangible and rare good with limited supply that cannot be increased quickly or at will. These features make gold a key element during the so-called flight into real values or into hard assets, which happens when inflation gets out of control. In other words, gold is the ultimate store of value which proved to hold its worth over time, unlike paper currencies that are subject to inflation and lose their value systematically.
Third, inflation means the loss of purchasing power of the currency, so when the greenback depreciates quicker than its major peers, the dollar-denominated price of gold increases. Fourth, when inflation is unexpected or when the Fed remains behind the curve and doesn’t hike nominal interest rates, real interest rates decline, supporting gold prices.
Fifth, high inflation increases economic uncertainty, which increases safe-haven demand for gold. In other words, an outbreak of inflation introduces some turbulences and leads to portfolio rebalancing, thus increasing gold’s appeal as a portfolio diversifier. During inflation, bonds underperform, so gold’s attractiveness increases.
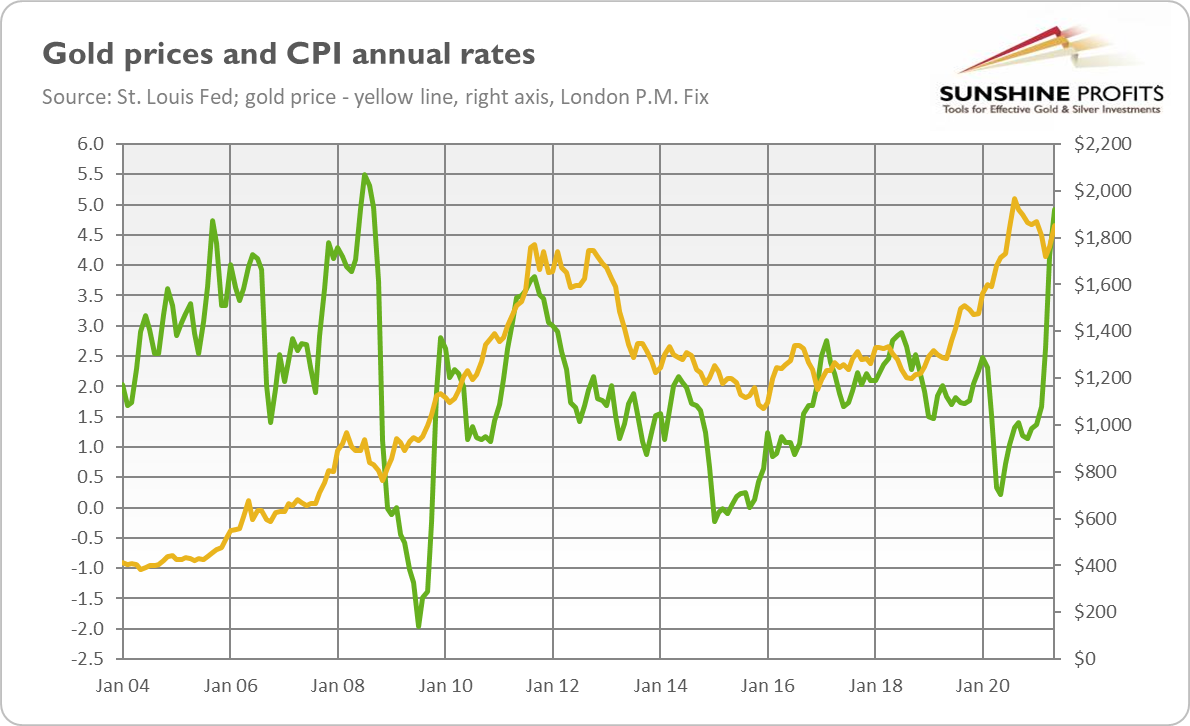
And last but definitely not least, gold is perceived as an inflation hedge. But is it really a good hedge against inflation? I analyzed this issue a few years ago – it would be nice to provide an update in light of more recent developments. So, let’s take a look at the chart below, which shows gold prices and CPI annual inflation rates.
As one can see, the relationship between these two series is far from being perfect. Actually, the correlation coefficient is significantly below zero (-0.41), which means that the correlation is negative! It means that although there are certain long-term trends – for example, gold rallied during stagflation in the 1970s and entered a bear market during the disinflation period in the 1980s and 1990s – there is no positive relationship between the CPI annual percentage change and the price of gold on a monthly basis.
In other words, the data shows that gold may serve as an inflation hedge only in the long run, as gold indeed preserves its value over a long time (for example, in the period from 1895 to 1999, the real price of gold increased on average by 0.3% per year). It is a good choice for investors also when there is relatively high and accelerating inflation, usually accompanied by fears about the current state of the U.S. dollar and a lack of confidence in the Fed and the global monetary system based on fiat monies.
However, let’s not draw conclusions too hastily. The chart below also presents the CPI and gold – but this time both series are year-on-year percentage changes (previously we had gold prices, now we have annual percentage changes in these prices).
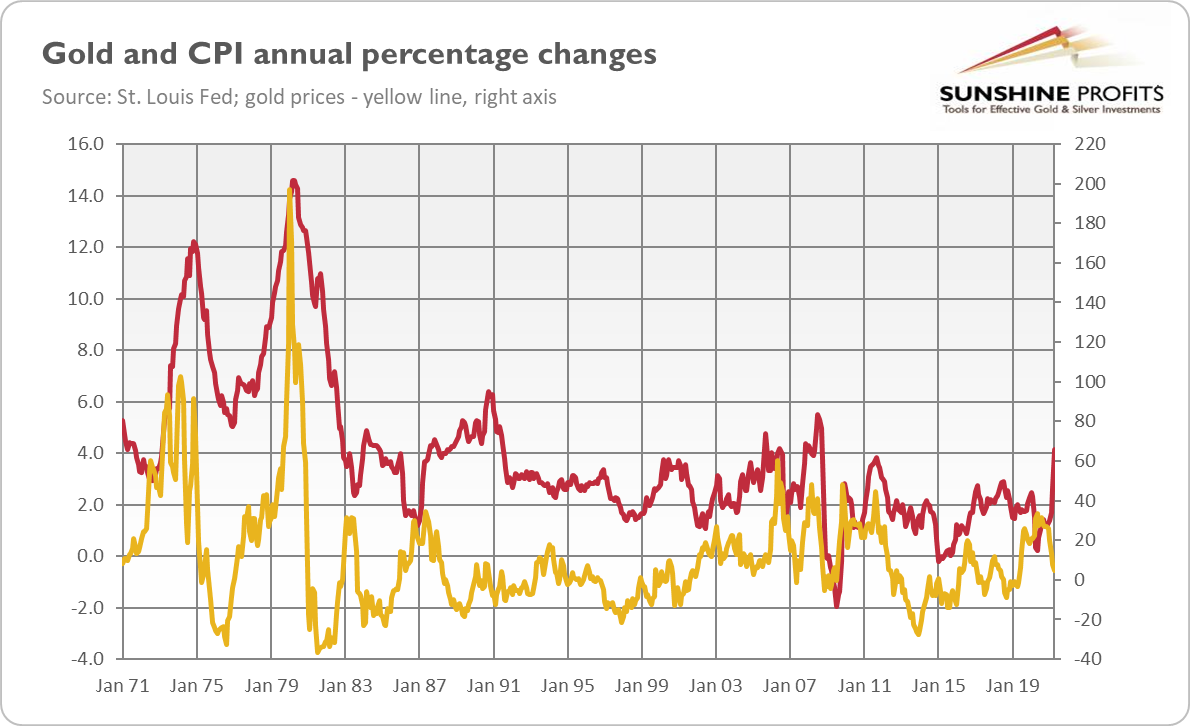
Have you noticed something? Yup, this time both series behave much more similarly. Indeed, the correlation coefficient is now positive (0.44). Hence, there is a positive relationship between gold and inflation although not always seen in absolute prices (but in changes in these prices), and not always seen in the CPI (as inflation has broader effects not limited only to consumer prices).
Summing up the above analysis, it seems justified to claim that gold could benefit from the current elevated levels of inflation, especially if it turns out to be more lasting than commonly believed. It will also be good for gold if the Fed remains dovish and tolerant of inflation surpassing its target significantly.
Thank you for reading today’s free analysis. If you enjoyed it, and would you like to know more about the links between the economic outlook, the current (past?) crisis and the gold market, we invite you to read the June Gold Market Overview report. Please note that in addition to the above-mentioned free fundamental gold reports, and we provide premium daily Gold & Silver Trading Alerts with clear buy and sell signals. We provide these premium analyses also on a weekly basis in the form of Gold Investment Updates. In order to enjoy our gold analyses in their full scope, we invite you to subscribe today. If you’re not ready to subscribe yet though and are not on our gold mailing list yet, we urge you to sign up. It’s free and if you don’t like it, you can easily unsubscribe. Sign up today!
Arkadiusz Sieron, PhD
Sunshine Profits: Effective Investment through Diligence & Care.-----
Disclaimer: Please note that the aim of the above analysis is to discuss the likely long-term impact of the featured phenomenon on the price of gold and this analysis does not indicate (nor does it aim to do so) whether gold is likely to move higher or lower in the short- or medium term. In order to determine the latter, many additional factors need to be considered (i.e. sentiment, chart patterns, cycles, indicators, ratios, self-similar patterns and more) and we are taking them into account (and discussing the short- and medium-term outlook) in our Gold & Silver Trading Alerts.
-
The Return of Inflation. Can Gold Withstand the Dark Side?
June 4, 2021, 6:17 AMInflation broke into the economy violently. It’s a destructive, dark force. But gold can resist it, being after all a much stronger asset than Anakin Skywalker.
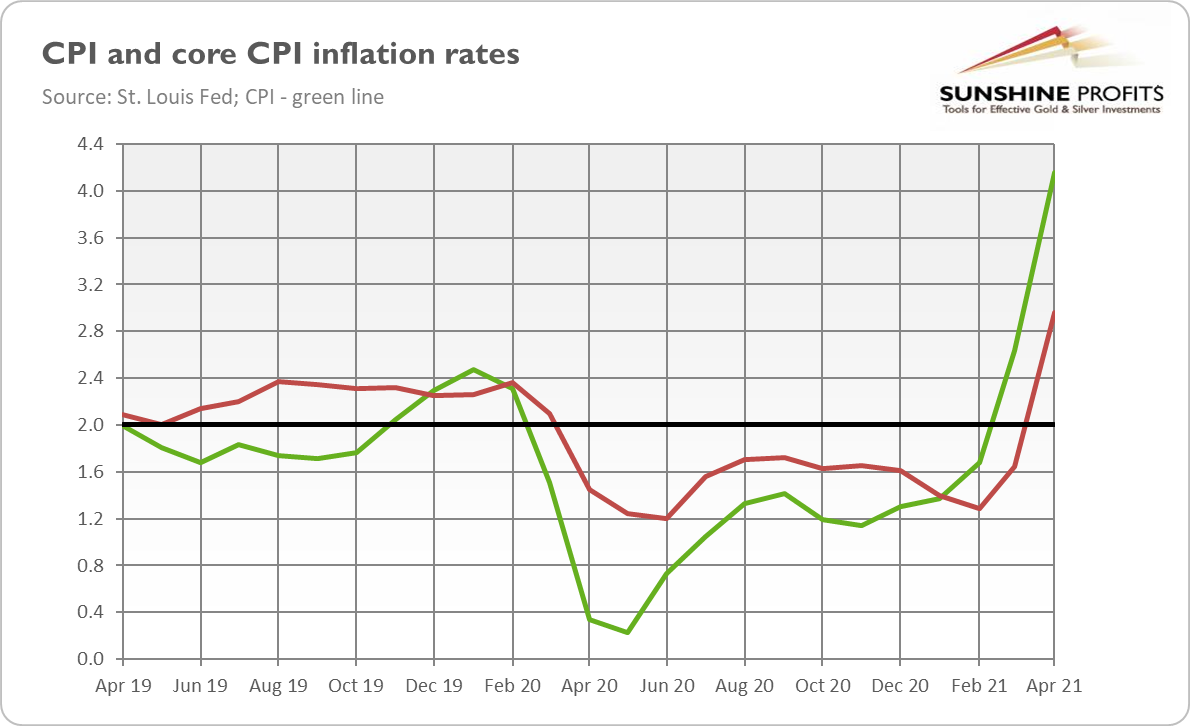
Last month, I wrote that “inflation is knock, knock, knockin’ on golden door”. I was wrong. Inflation didn’t knock, it broke down the door! Indeed, as the chart below shows, the core CPI surged 3%, while the overall CPI annual rate soared 4.2% in April – this is twice the Fed’s target!
Now, the question is whether this elevated inflation will turn out to be just “transitory”, as the Fed and the pundits claim, or become more permanent. On the one hand, given that April-May 2020 was the worst phase of the pandemic with the deepest price declines, the current high inflation readings are perfectly understandable, and we could see lower numbers later this year.
On the other hand, inflation may be higher and/or more persistent than many analysts believe. After all, the April reading came as a shock for them and even for the top US central bankers. For example, Richard Clarida, the Fed Vice-Chair, said: “I was surprised”. It shows that there is more in high inflation than just the base effect. Indeed, the CPI index with February 2020, i.e., the last pre-pandemic month as a base, has jumped 3.1% so far – lower but still significantly above the Fed’s target.
It shouldn’t be surprising given the surge in the broad money supply and increase in fiscal transfers to citizens. Incomes are higher and people are ready to spend their money. Stronger demand met with supply shortages, so the prices rose. And what is important, the increases are widespread: from commodities to used cars and houses.
However, there are a few important upside risks to inflation. First, a rise in wages. Although employment is far from the pre-epidemic level, entrepreneurs struggle to find workers. Therefore, they could be forced to increase wages to pull employees away from generous government benefits. If passed on, higher input costs would translate into higher consumer prices.
Second, a housing boom. Rising housing prices show that inflationary pressure is something more than just CPI inflation, and all this could drive shelter inflation higher. More importantly, though, as shelter dominates in the CPI basket, the official inflation would rise as a result.
Third, an increase in inflationary expectations. In May, the University of Michigan index that gauges near-term inflation expectations surged to 4.6%from 3.4%in April. What’s important, the index that measures inflation expectations for the next five years also rose – from 2.7% in April to 3.1% in May, which is the highest level in a decade. As the chart below shows, the market-based inflation expectations have also been surging recently.
This is a very important development, potentially even a game-changer. You see, inflation remained low for years partially because Americans didn’t expect high inflation. They used to see persistent inflation as a thing of the past. They had strong confidence in the Fed, believing that the US central bank would quickly intervene to prevent inflation.
However, that belief could go away now. The Fed’s new monetary framework and officials’ speeches clearly indicate that the US central bank has become more tolerant of higher inflation. The Fed has returned – just like in the 1970s – to focus on full employment and its “shortfalls” instead of deviations, forgetting that economies can become too hot as well as too cold. Given the dominance of doves in the Fed – but also in the Treasury with Yellen as a Secretary – one can reasonably doubt whether or not the US central bank is ready to hike the federal funds rate in response to higher inflation. Just like in the years before the Great Stagflation, the Fed could decide that it’s better to live with inflation than bear the pain of combating it.
More importantly, such a fight would be challenging now, as the public debt is a few times higher.
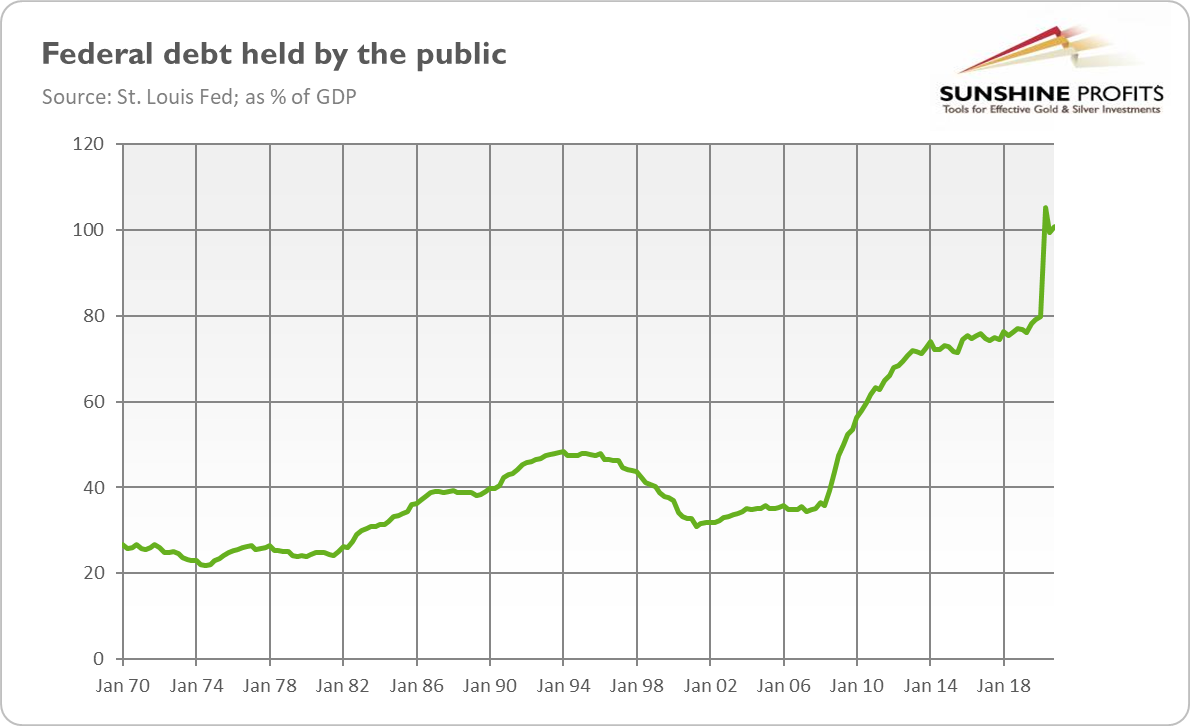
As the chart below shows, the federal debt held by the public is now 100% of the GDP, four times larger than throughout the 1970s. Hence, the increase in interest rates would amplify fiscal deficits even more. To paint the perspective, April’s core CPI was the highest since 1982, when the Fed was trying to control inflation, and interest rates were double-digit. So, the government would be obliged to cut its expenditures, while the climate is rather to spend as much money as possible. Therefore, the Fed is under strong pressure not to tighten its monetary policy.
What does all this mean for the gold market? Well, when people question the willingness or ability of the government and central bank to tame inflation, they expect it to go higher, which increases the actual inflation and make it more persistent. Such a negative surprise, with inflation expectations unanchored, would make prices rise abruptly – but also the demand for gold as an inflation hedge would increase. Given the widespread economic repercussions and elevated uncertainty triggered by higher inflation – which is one of the biggest threats to this economic cycle – gold could gain as a safe-haven asset.
Of course, gold is not a perfect inflation hedge in the short term. If interest rates increase or the Fed tightens monetary conditions in response to inflation, gold may struggle. Actually, a start of normalization of the monetary policy could push gold downward, just as it happened in 2011.
However, given the current pretending that “there is no inflation” by the Fed, it’s likely that the US central bank won’t react promptly, remaining behind the curve. The delay in tightening could de-anchor inflationary expectations and trigger an inflationary spiral, pushing real interest rates down but also gold prices up.
Thank you for reading today’s free analysis. If you enjoyed it, and would you like to know more about the links between the economic outlook, the current (past?) crisis and the gold market, we invite you to read the June Gold Market Overview report. Please note that in addition to the above-mentioned free fundamental gold reports, and we provide premium daily Gold & Silver Trading Alerts with clear buy and sell signals. We provide these premium analyses also on a weekly basis in the form of Gold Investment Updates. In order to enjoy our gold analyses in their full scope, we invite you to subscribe today. If you’re not ready to subscribe yet though and are not on our gold mailing list yet, we urge you to sign up. It’s free and if you don’t like it, you can easily unsubscribe. Sign up today!
Arkadiusz Sieron, PhD
Sunshine Profits: Effective Investment through Diligence & Care.-----
Disclaimer: Please note that the aim of the above analysis is to discuss the likely long-term impact of the featured phenomenon on the price of gold and this analysis does not indicate (nor does it aim to do so) whether gold is likely to move higher or lower in the short- or medium term. In order to determine the latter, many additional factors need to be considered (i.e. sentiment, chart patterns, cycles, indicators, ratios, self-similar patterns and more) and we are taking them into account (and discussing the short- and medium-term outlook) in our Gold & Silver Trading Alerts.
-
Will Gold Shine Under Bidenomics?
May 28, 2021, 11:21 AMBidenomics is a big departure from sound economics. But when reason sleeps, gold fortunes are born.
Biden’s triumph in the presidential election does not just mean that a new man lives in the White House. It actually implies a fundamental shift in economic policy. Some analysts even see Biden’s agenda as a decisive break with neoliberalism or “Washington consensus”.
You see, in the old orthodoxy, most economists trusted in markets, argued for privatization, deregulation, and liberalization. Taxes and social benefits should be low and don’t discourage work and investments. The governments should run balanced budgets, avoiding large and permanent fiscal deficits, while central banks should hike interest rates to prevent inflation from running out of control.
The focus was on scarcity and limited supply. The economy was believed to operate generally at potential, so the key factors to fast economic growth were structural reforms and adequate supply-side policy to strengthen incentives to work and invest. Governments shouldn’t run fiscal deficits as they could crowd out private investments, and they shouldn’t stimulate the demand as it would misallocate resources and could overheat the economy, leading to inflation. The monetary policy was better suited to occasionally fight economic crises.
How much has changed! Now, the focus is on slack and the demand side of the economy. The growth is held by chronic lack of demand – this is the key tenet of Keynesian economics, the hypothesis of secular stagnation, and the Modern Monetary Theory – so, governments and central banks should continuously stimulate the economy through easy monetary and fiscal policies. As real interest rates are low and demand is weak, rising public debt is not a problem. Inflation is not a problem either; after all, if there is always slack in the economy which operates below its full potential, there is practically no risk of inflation.
Indeed, Biden has pushed the American Rescue Plan Act of $1.9 trillion (or about 9%of the GDP) without presenting any plan of longer-term deficit reduction. And additional huge government expenditures are coming with Biden’s infrastructure plan. It seems that no one is interested any longer in how the government is going to pay for its spending and obligations, or in long-term consequences of practically unprecedentedly large fiscal deficits (see the chart below). Interest rates are low, so let’s live like there’s no tomorrow!
Another notable example is, of course, the Fed’s new monetary framework. The US central bank has ultimately disregarded the idea of the Philips curve and the natural rate of unemployment. There is no level of employment that could boost the inflation rate, so there is no need for any preventive actions. What really counts is the actual inflation rate, not the expected one. The central bank shouldn’t fight with symmetrical deviations from the economy’s long-term path determined by technological progress and other supply-side factors any longer, but only with shortfalls from the full employment.
So, what does Bidenomics (and Powellomics) imply for the gold market? Well, Biden is not the first politician who thinks that there are no economic limits to his ideas. But the pandemic and the economic crisis, the environment of ultra-low interest rates, and the fact that the Democratic base has shifted further to the left implies that Bidenomics may become a radical departure from sound economics. However, a crazy idea that “borrow & spend without a limit” is the key to prosperity is positive for the gold market, as the yellow metal is a safe-haven asset and a hedge against insane economic policies.
What is important here is the fact that we have actually tested this approach. In 1960, just like today, the Keynesian economists who dominated in the mainstream (and politicians who trusted them) thought that the main task of economic policy is to actively and permanently stimulate aggregate demand. The result was stagflation in the 1970s, as it turned out that economies may overheat as well. Gold shined then, so it should also benefit today from similarly unsound economic ideas and policies.
So far, the pace of economic recovery has been fast, while the inflation rate has remained limited. But this may change quickly when people stop trusting that the Fed and the government will swiftly take action to contain inflation if it breaks out. However, given the current mindset and macroeconomic ideas, how probable is it that the policymakers will accept substantial interest rate hikes, cuts in spending, and probably also a recession when faced with 1970s-style inflation? Not very likely, indeed. Hence, if inflation continues to rise, while the Fed remains ultra-dovish, inflationary expectations may become unanchored, and inflation may get out of control taking gold with it on a wild journey north.
Thank you for reading today’s free analysis. If you enjoyed it, and would you like to know more about the links between the economic outlook, the current (past?) crisis and the gold market, we invite you to read the May Gold Market Overview report. Please note that in addition to the above-mentioned free fundamental gold reports, and we provide premium daily Gold & Silver Trading Alerts with clear buy and sell signals. We provide these premium analyses also on a weekly basis in the form of Gold Investment Updates. In order to enjoy our gold analyses in their full scope, we invite you to subscribe today. If you’re not ready to subscribe yet though and are not on our gold mailing list yet, we urge you to sign up. It’s free and if you don’t like it, you can easily unsubscribe. Sign up today!
Arkadiusz Sieron, PhD
Sunshine Profits: Effective Investment through Diligence & Care.-----
Disclaimer: Please note that the aim of the above analysis is to discuss the likely long-term impact of the featured phenomenon on the price of gold and this analysis does not indicate (nor does it aim to do so) whether gold is likely to move higher or lower in the short- or medium term. In order to determine the latter, many additional factors need to be considered (i.e. sentiment, chart patterns, cycles, indicators, ratios, self-similar patterns and more) and we are taking them into account (and discussing the short- and medium-term outlook) in our Gold & Silver Trading Alerts.
-
Will Bitcoin Replace Gold?
May 21, 2021, 7:21 AMNote: This article was written just before this week’s most recent plunge in cryptocurrencies, however, the general principle still applies. Cryptos can still play a parallel role to precious metals, but are not necessarily their substitute. Furthermore, the most recent exodus in cryptos and subsequent price drop is most likely just a temporary dip. The general trend still points to the upside.
Bitcoin’s popularity and price are rising. However, cryptocurrencies could be seen as complementary, not substitutive to gold.
What a rally! Unfortunately, I’m not referring to gold, but to Bitcoin. As the chart below shows, the price of the first and the biggest of cryptocurrencies rose to above $60,000 in April 2021 from scratch (or $124) in October 2013 when the chart starts. I wish I had bought more coins in these early years of cryptocurrencies and held them for longer! More recently, Bitcoin has skyrocketed almost 1200% from its bottom of $4,945 during the asset sell-off in March 2020.
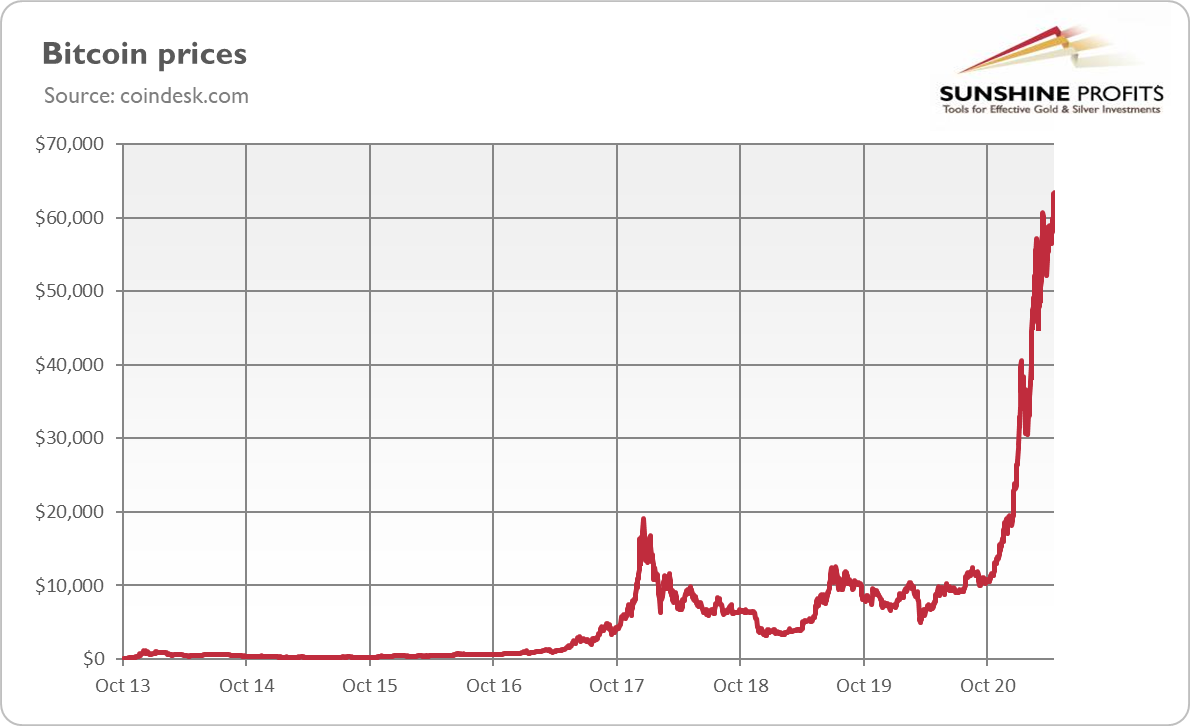
OK, but why am I writing about Bitcoin in the Gold Market Overview? The reason is the narrative that the cryptocurrency has already become or will become soon the substitute for gold. Some people even call Bitcoin “new gold” or “millennial gold”. And this is what Jerome Powell has recently said about cryptocurrencies:
Crypto assets are highly volatile and therefore not useful as a store of value. They are not backed by anything. It is a speculative asset that is essentially a substitute for gold rather than for the dollar.
Others echo Powell’s remarks, claiming that Bitcoin is displacing gold as an inflation hedge, or that it could supplant gold as a safe-haven asset. Are they right?
Well, there are, of course, some similarities between Bitcoin and gold which make these two assets substitutes to some extent. It would be surprising if that wasn’t the case, given the fact that Bitcoin’s system was designed to mimic the gold standard. In particular, there is a cap on the number of bitcoins to make this cryptocurrency rare just like the yellow metal. In other words, the idea is to make its supply inflexible, just as – or even more – in the gold standard. So, both Bitcoin and gold are anti-inflationary currencies whose supply cannot be arbitrarily changed like in the case of national fiat currencies. And both these assets have a libertarian, anti-government flavor – in the sense that demand for them stems from the lack of confidence in the government monies.
However, there are also important differences between Bitcoin and gold. First of all, although Bitcoin is believed to be an alternative anti-fiat asset, it’s actually also fiat money. It’s a private, decentralized, non-governmental currency, but it doesn’t change the fact that Bitcoin is not backed by anything, and it has no intrinsic value. Of course, value is subjective, but gold has some non-monetary use (in jewelry or technology), which implies that its price is not likely to drop to zero in a worst-case scenario in which people cease to see gold as a monetary asset. Unlike the shiny metal, Bitcoin has only monetary value – i.e., you cannot use it either as a consumer good or as an input in a production process – so there is no floor below its price (if the officials try to ban Bitcoin, its price could plunge really deeply).
Second, Bitcoin is much more volatile than gold. Sure, it might be just a problem of Bitcoin’s young age. But it doesn’t change the fact that price declines in the cryptocurrency are a few times bigger than in the gold market. Hence, although – thanks to the network effects and speculative appeal – Bitcoin offers potential for quicker and larger gains, it’s also associated with higher downward risks. It makes the cryptocurrency an inferior store of value and a safe haven. So, Bitcoin could be seen rather as a risky asset, not necessarily a safe haven that goes up together with risk appetite. This may explain the recent divergence in cryptocurrencies and gold.
What does it all mean for the gold market? Well, it’s true that some money has flowed from gold into Bitcoin and that some investors may prefer now to treat Bitcoin as a major alternative asset in their investment portfolios. However, such flows and rebalancing of portfolios as we’ve seen recently are perfectly normal, especially given that Bitcoin is still benefiting from the network effects, i.e., the accelerating institutional interest and mainstream acceptance.
More importantly, there are important differences between gold and Bitcoin, which imply that the latter won’t replace the yellow metal. The correlation coefficient between the weekly prices of these two assets is only 0.38 percent, so they are really far away from being perfect substitutes. Also, please take a look at the chart below which shows their prices in 2019-2021.
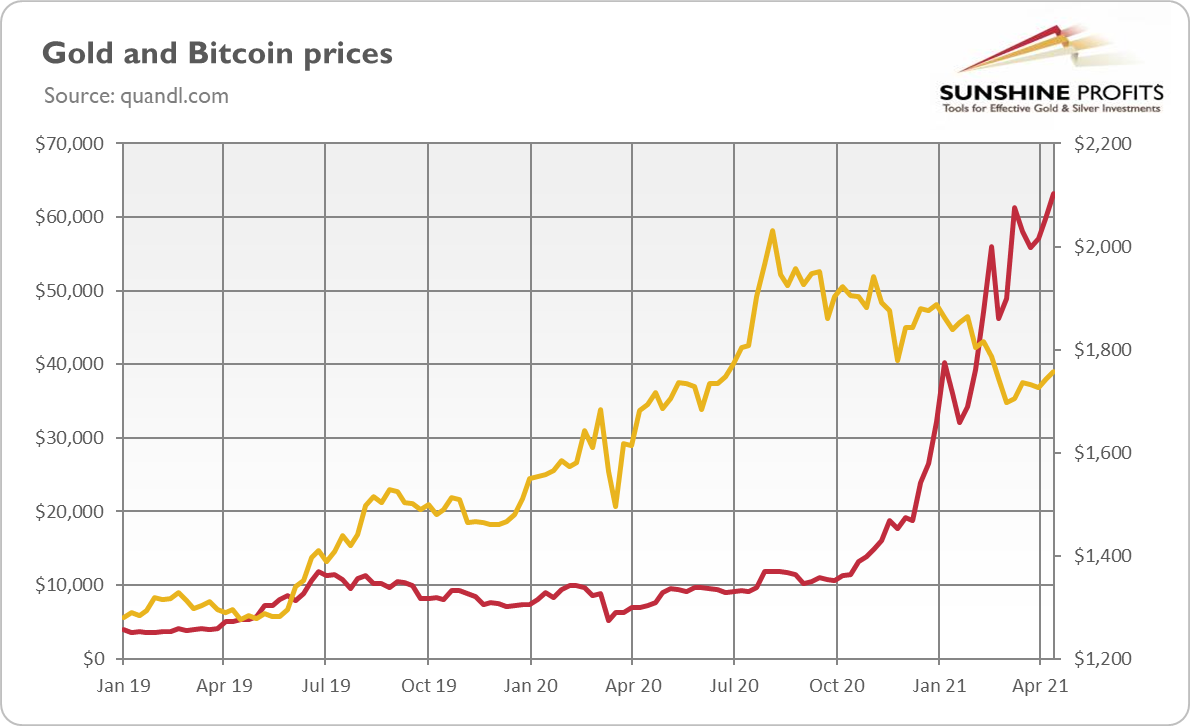
As you can see, gold reached its peak in early August, while the rally in the cryptocurrency started in October, two months later. Hence, it should be clear that Bitcoin didn’t cause the plunge in gold prices. We could even hypothesize that gold has undergone (or is undergoing) a healthy correction, which is still ahead of Bitcoin. After all, its price chart looks parabolic, which brings to mind the possibility of a bubble (although network effects can be partially responsible for this shape).
Anyway, for us, these two assets are rather distinct despite all the similarities. And they both can coexist together as hedges against national fiat currencies, as they complement each other. Bitcoin can be used in instant payments, cross-border payments and as a highly risky speculative asset, while gold has non-monetary value and provides long-term stability. But Bitcoin’s rise in popularity doesn’t pose an existential threat to gold. After all, the yellow metal has an exceptional track record of being the ultimate money, proving its value over millennia.
Thank you for reading today’s free analysis. If you enjoyed it, and would you like to know more about the links between the economic outlook, the current (past?) crisis and the gold market, we invite you to read the May Gold Market Overview report. Please note that in addition to the above-mentioned free fundamental gold reports, and we provide premium daily Gold & Silver Trading Alerts with clear buy and sell signals. We provide these premium analyses also on a weekly basis in the form of Gold Investment Updates. In order to enjoy our gold analyses in their full scope, we invite you to subscribe today. If you’re not ready to subscribe yet though and are not on our gold mailing list yet, we urge you to sign up. It’s free and if you don’t like it, you can easily unsubscribe. Sign up today!
Arkadiusz Sieron, PhD
Sunshine Profits: Effective Investment through Diligence & Care.-----
Disclaimer: Please note that the aim of the above analysis is to discuss the likely long-term impact of the featured phenomenon on the price of gold and this analysis does not indicate (nor does it aim to do so) whether gold is likely to move higher or lower in the short- or medium term. In order to determine the latter, many additional factors need to be considered (i.e. sentiment, chart patterns, cycles, indicators, ratios, self-similar patterns and more) and we are taking them into account (and discussing the short- and medium-term outlook) in our Gold & Silver Trading Alerts.
-
When Euphoria Ends, Gold Bulls Enter the Scene
May 14, 2021, 9:34 AMMarket participants are very optimistic about an economic recovery, but these positive expectations may be exaggerated. The end of this euphoria should be good for gold.
The optimism about the pace of economic recovery from the 2020 recession is growing. The analysts race in upward revisions of GDP growth in the coming quarters. For example, the IMF – in the April 2021 edition of the World Economic Outlook – expects at the moment that the US economic output will increase by 6.4% this year, compared to the 5.1% growth forecasted in January.
The euphoric mood has some justification, of course. The vaccination is progressing, entrepreneurs are used to operating under sanitary restrictions, economies are reopening and governments are spending like crazy. At the same time, central banks are maintaining ultra-easy monetary policy, keeping financial conditions loose.
Furthermore, some economic data is consistent with strong rebounding, especially in manufacturing. For instance, the IHS Markit U.S. Manufacturing PMI Index posted 59.1 in March, up from 58.6 in February – being the second-highest value on record since May 2007 when data collection began. Services are also recovering vigorously, as the IHS Markit US Services PMI Index registered 60.4 in March, up from 59.8 in February. It’s the fastest rate of growth since July 2014.
Now, the question is how strong the current boom is and how long it is going to last. Well, there is no need to argue that we will see a few strong quarters of GDP growth in the US and other countries. But for me, the euphoria is exaggerated. You see, the current recovery is not surprising at all. As the Great Lockdown plunged the world into a deep economic crisis, the Great Unlocking is boosting the global economy.
And there is the base effect. There was a low base in 2020, so the seemingly impressive recovery in 2020 is partially merely a statistical phenomenon. Let’s illustrate this effect. In Q2 2020, the real GDP plunged from $19,020 to $17,302 trillion or 9.03%year-over-year, as the chart below shows.
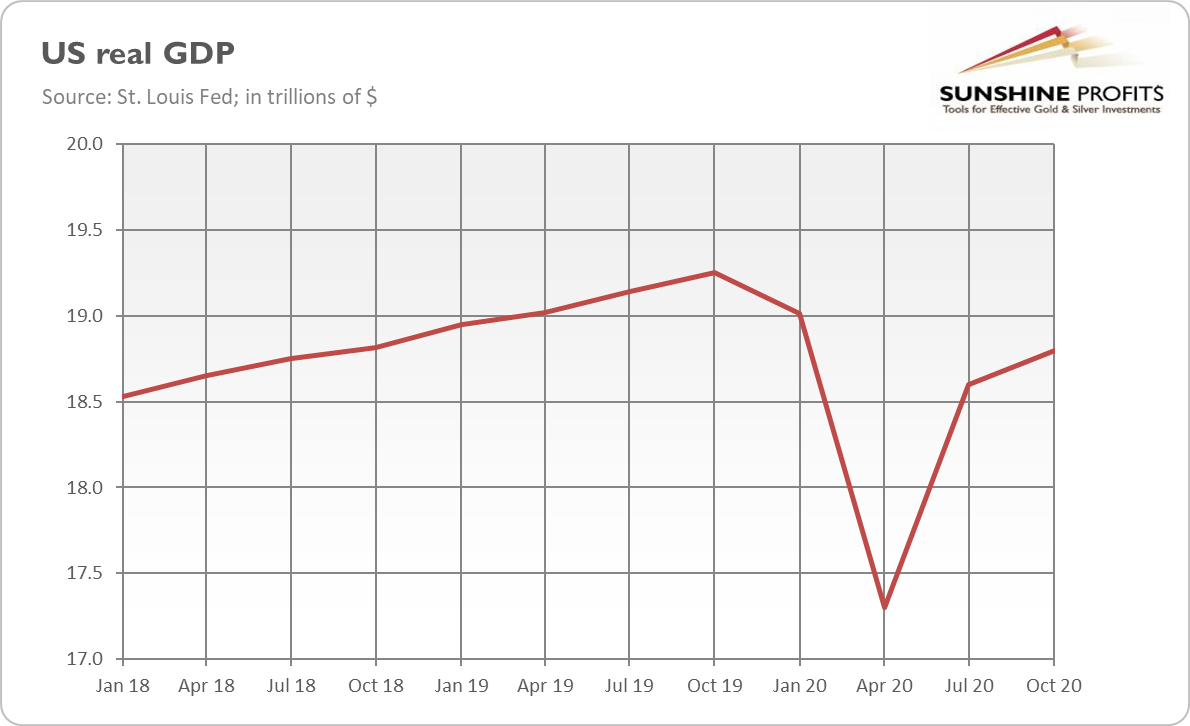
However, the rebound to the pre-recession level would imply the jump of 9.93%, almost one percentage higher! This is how the math works: when you divide a numerator by a smaller denominator, you get a greater percentage. So, it would be alarming if the recovery were not strong after one of the deepest crises in history.
Another issue that makes me more skeptical than most pundits is the fact that the main reason behind economic growth upgrades is massive fiscal stimulus. Uncle Sam injected more than 13 percent of the GDP in government spending (only in 2020) that ballooned the fiscal deficits. Meanwhile, the Fed widened its balance sheet by almost $4 trillion. So, it would be quite strange if we didn’t see impressive numbers in light of such unprecedented inflows of monetary and fiscal liquidity. But it means that the impressive recovery in statistics is driven, at least partially, by soaring money supply and public debt (see the chart below).
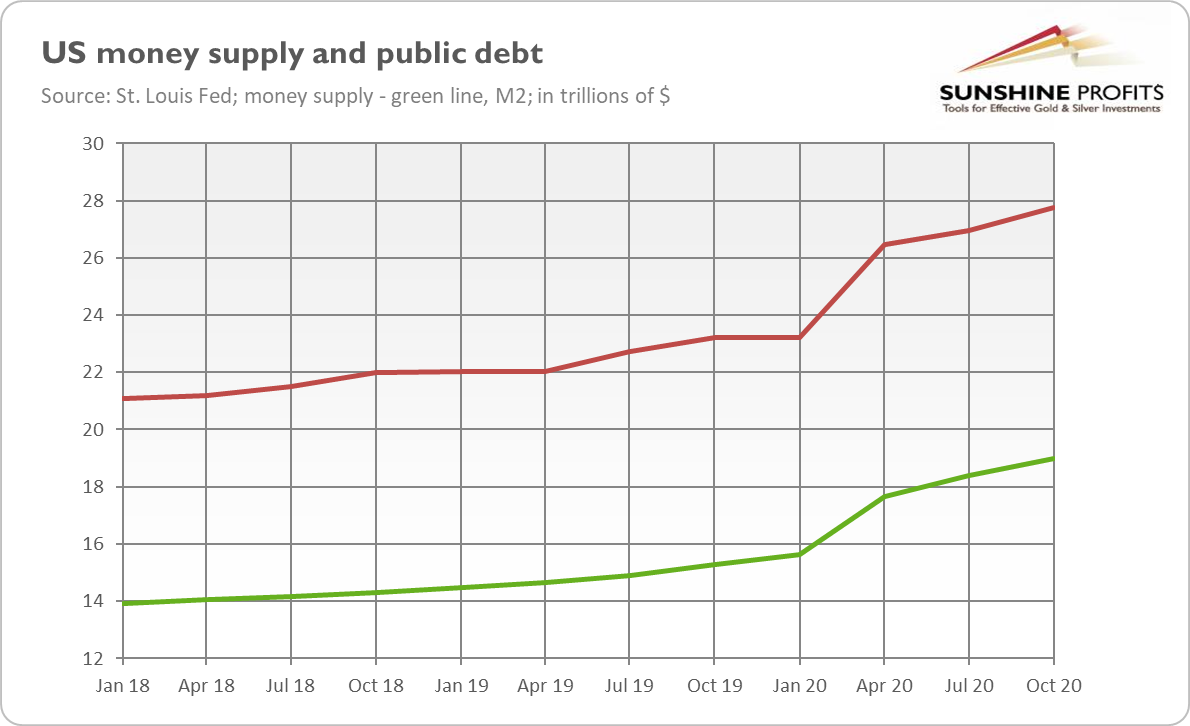
And my three last concerns. First, the job recovery is more sluggish than the GDP recovery. The unemployment rate is still above the pre-pandemic level, while the labor force participation stands significantly below the level seen in February 2020. Second, a full return to normal life will occur if vaccines remain effective. But there is a tail risk of new variants of the virus, which could even be vaccine-resistant. Third, history teaches us that when the pandemic ends, social unrest may reemerge. After all, the epidemic left us with deepening inequalities and rising living costs.
What does it all mean for the gold market? Well, the market euphoria about the economic rebound is negative for gold. We have already seen how these optimistic expectations freed the risk appetite and boosted economic confidence, sending bond yields higher, but gold prices lower.
However, just as the doomsday scenarios created in the midst of the epidemic were excessively negative, the current ones seem to be too optimistic. I expect that with the year progressing, these expectations will soften or shift to the medium-term, which could be more challenging. After all, the low base effect will disappear, and both the monetary and fiscal policies will have declining marginal utility. At the same time, there will be an increased risk of high inflation, debt crisis, stock market correction or even financial crisis. After all, the current levels of stock indices are partially caused not by fundamentals, but by the elevating risk tolerance thanks to the central banks standing behind most asset classes ready to intervene in case of problems.
It seems that this process has already begun and the reopening trade is waning. Economic confidence is very high, so the room for further increases is limited. The low-hanging fruits have been collected, and when economies reopen fully, the structural problems will become more important than the cyclical ones. Investors have started to worry about higher inflation, especially because the Fed remains unmoved by rising prices. A jobless recovery would prolong the Fed’s very dovish stance, as the US central bank focuses now on full employment rather than on stable prices. All these factors explain why the price of gold has been rebounding recently, and why it can rise even further later this year, although the fact that the US enjoys a stronger recovery than the EU or Japan could support the interest rates and the greenback, creating some downward pressure on the yellow metal.
Thank you for reading today’s free analysis. If you enjoyed it, and would you like to know more about the links between the economic outlook, the current (past?) crisis and the gold market, we invite you to read the May Gold Market Overview report. Please note that in addition to the above-mentioned free fundamental gold reports, and we provide premium daily Gold & Silver Trading Alerts with clear buy and sell signals. We provide these premium analyses also on a weekly basis in the form of Gold Investment Updates. In order to enjoy our gold analyses in their full scope, we invite you to subscribe today. If you’re not ready to subscribe yet though and are not on our gold mailing list yet, we urge you to sign up. It’s free and if you don’t like it, you can easily unsubscribe. Sign up today!
Arkadiusz Sieron, PhD
Sunshine Profits: Effective Investment through Diligence & Care.-----
Disclaimer: Please note that the aim of the above analysis is to discuss the likely long-term impact of the featured phenomenon on the price of gold and this analysis does not indicate (nor does it aim to do so) whether gold is likely to move higher or lower in the short- or medium term. In order to determine the latter, many additional factors need to be considered (i.e. sentiment, chart patterns, cycles, indicators, ratios, self-similar patterns and more) and we are taking them into account (and discussing the short- and medium-term outlook) in our Gold & Silver Trading Alerts.
-
Inflation Knock-knock-knockin’ On Golden Door
May 7, 2021, 10:06 AMInflation is not coming. It is already here! Gold should benefit, given that it could be higher and more lasting than the pundits believe.
“Knock, knock, knockin’ on heaven’s door”, so sing Bob Dylan and Guns N’ Roses. Now, inflation is knocking on the golden door. According to the BLS, the U.S. CPI inflation rate recorded a monthly jump of 0.6% in March, while soaring 2.6% on an annual basis. And the core inflation has also accelerated. So, inflation has significantly surpassed the Fed’s target of 2%, as one can see in the chart below.
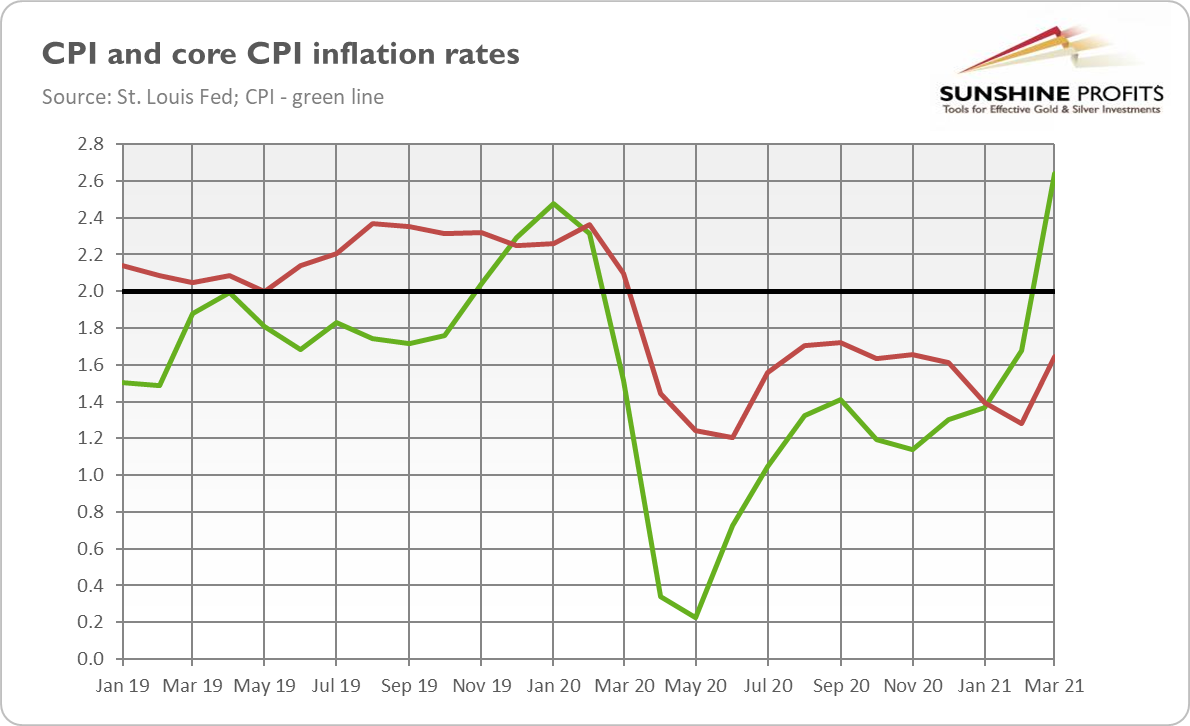
And remember that this is what the official data shows, which rather underestimates the true inflation. This is because of several issues, including hedonic quality adjustments, shifts in the composition of the consumer baskets and methodological changes. It is enough to say that the rate of inflation calculated by the John Williams’ Shadow Government Statistics that uses methodology from the 1980s is over 10% right now.
There are some controversies about this alternate data, but I would like to focus on something else. The CPI doesn’t include houses (or other assets) into the consumer baskets, as they are treated as investments. The index only takes rents into account. But homeowners don’t pay rents, so for them, the cost of shelter, which accounts for about one-fourth of the overall CPI, is the implicit rent that owner-occupants would have to pay if they were renting their homes. And this component rose just 2 percent in March, while the Case-Shiller Home Price Index, which measures the actual house prices, soared more than 11% in January (the latest available data). According to Wolf Street, if we had replaced the owners’ equivalent rent of primary residence with the Case-Shiller Index, the CPI would have jumped 5.1 instead of 2.6%. The chart below shows the difference between these two measures.
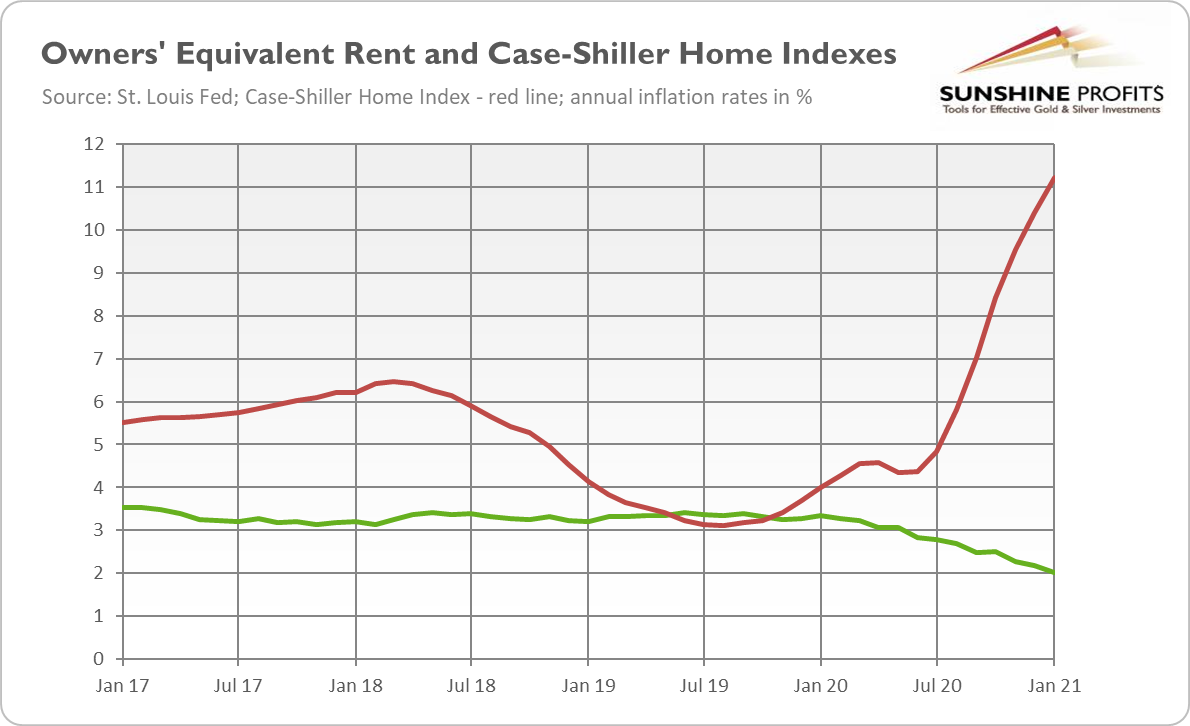
Hence, inflation has come, and even the official data – which can underestimate the level of inflation that ordinary people deal with in their daily lives – confirms this. If you’ve been buying food lately, you know what I mean. Now, the question is whether this inflation will be temporary or more lasting.
Powell, his colleagues and the pundits claim that higher inflation will only be a temporary phenomenon caused by the base effect. The story goes like this: the CPI plunged in March 2020, which created a lower base for today’s annual inflation rate. There is, of course, a grain of truth here. But let’s take a look at the chart below. It shows the CPI, with both March 2020 (red line) and February 2020 (green line) as a base. As you can see, in the latter case the index jumped 2.3%. Yes, lower, but not significantly lower than 2.6% when compared to March 2020. So, the Fed shouldn’t blame the base effects for accelerating inflation (and funny thing: have you heard the pundits talking about the base effect when they were talking about vigorous GDP recovery?).
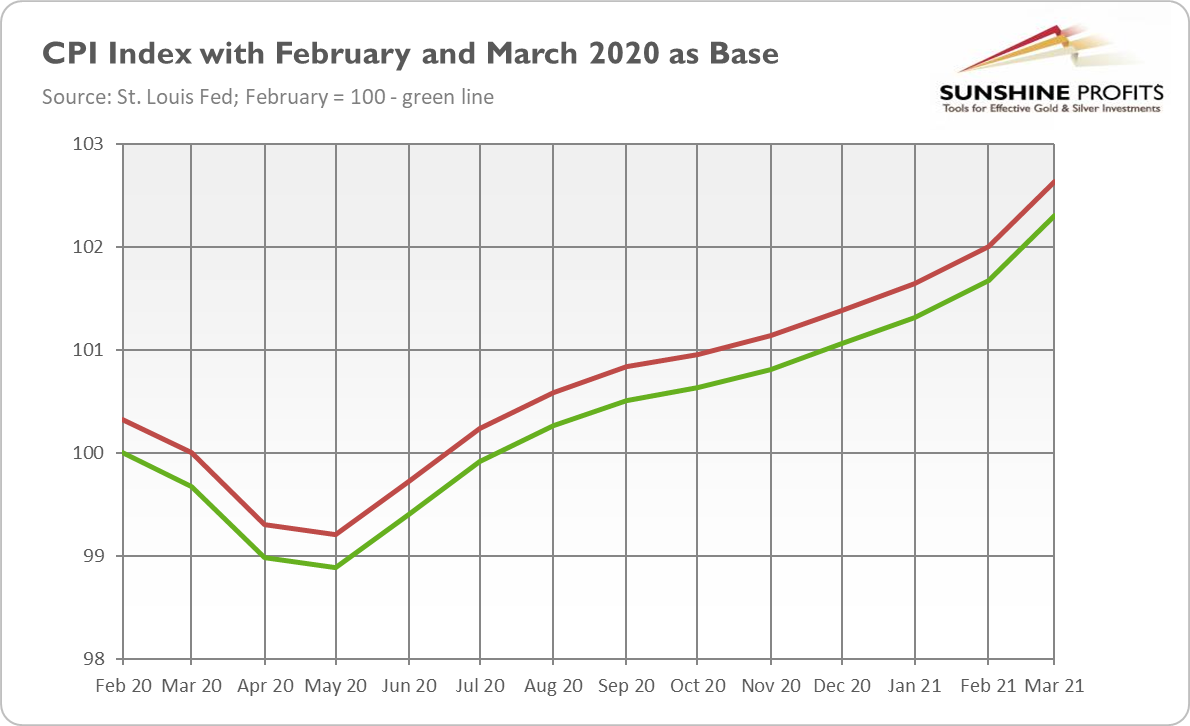
Instead, central bankers should blame themselves and their insane monetary policy. After all, as the chart below shows, the Fed’s balance sheet has soared $3.4 trillion (or 81%), while the broad money supply (measured by M2) has increased more than $4 trillion (or 26%) from February to date.
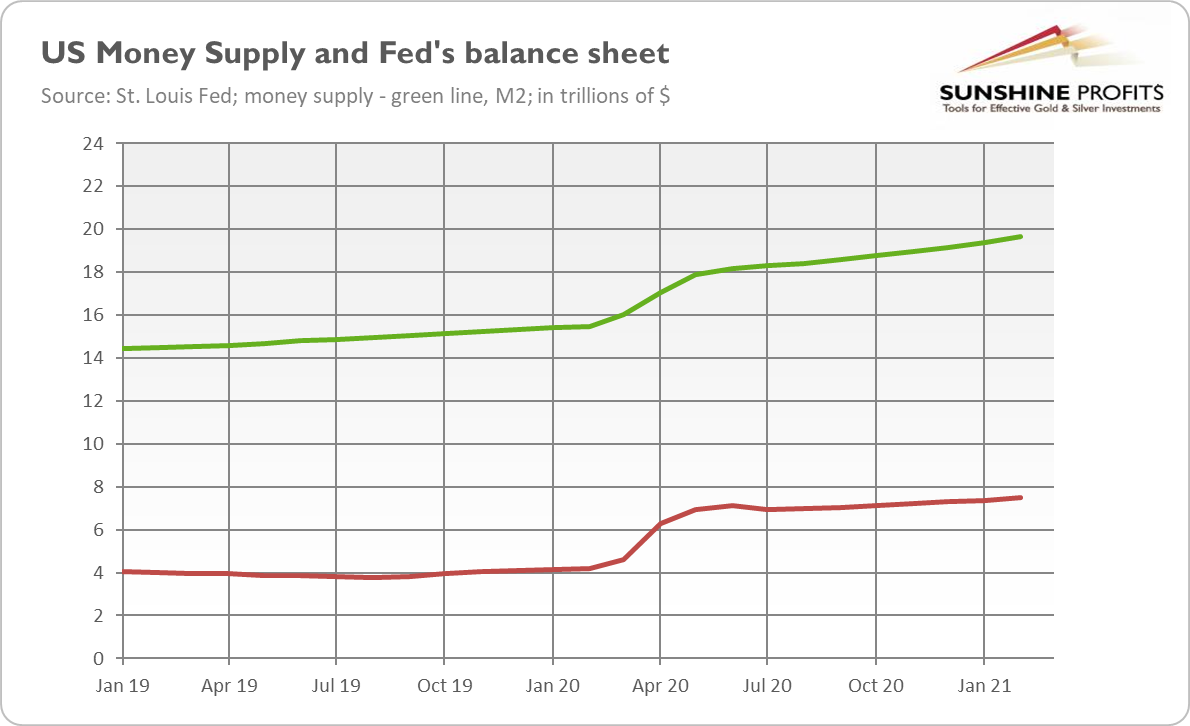
They could also blame reckless fiscal policy. Growing government spending, enabled by a rising pile of debts monetized indirectly by the Fed, has headed for Main Street. This, combined with a jump in the broad money supply, is the key change compared to the Great Recession when almost all stimuli flowed into Wall Street and big corporations. Sure, some people use the received money to increase savings and repay debts. But with the reopening economy, some of the pent-up demand will be realized. Actually, many Americans have already started spending free time traveling like crazy after being locked in homes for so long.
And this is very important: consumers are therefore more eager to accept higher prices. It shouldn’t be surprising given all the checks they got and how hungry for normal life they are. As I reported last month, companies are reporting rising prices of commodities and inputs (partially because of the supply disruptions too), but so far their power to pass the producer price inflation to consumers has been limited. However, this is changing. The April report IHS Markit U.S. Services PMI observes that
Rates of input cost and output charge inflation reached fresh record peaks, as firms sought to pass on steep rises in input prices to clients (…) A number of companies also stated that stronger client demand allowed a greater proportion of the hike in costs to be passed through. The resulting rate of charge inflation was the quickest on record.
All these reasons suggest that higher inflation could be more lasting than most of the so-called experts believe (although the officially reported inflation doesn’t have to show it). This is good news for the yellow metal. Higher inflation implies lower real interest rates and stronger demand for gold as an inflation hedge. What is important here is that we have more inflationary pressure in the pipeline exactly at the time when the Fed has become more tolerant of inflation. So, the combination of higher inflation with a passive central bank position sounds bullish for gold. The key issue here is whether the markets believe that the Fed will allow for higher inflation. So far, they have been skeptical, so the expectations of interest rates hikes accumulated and the bond yields rallied. But it seems that the Fed has managed to convince the markets that it’s even more incompetent than it is widely believed. If the distrust in the Fed strengthens, gold should return to its upward trajectory from the last year.
Thank you for reading today’s free analysis. If you enjoyed it, and would you like to know more about the links between the economic outlook, the current (past?) crisis and the gold market, we invite you to read the May Gold Market Overview report. Please note that in addition to the above-mentioned free fundamental gold reports, and we provide premium daily Gold & Silver Trading Alerts with clear buy and sell signals. We provide these premium analyses also on a weekly basis in the form of Gold Investment Updates. In order to enjoy our gold analyses in their full scope, we invite you to subscribe today. If you’re not ready to subscribe yet though and are not on our gold mailing list yet, we urge you to sign up. It’s free and if you don’t like it, you can easily unsubscribe. Sign up today!
Arkadiusz Sieron, PhD
Sunshine Profits: Effective Investment through Diligence & Care.-----
Disclaimer: Please note that the aim of the above analysis is to discuss the likely long-term impact of the featured phenomenon on the price of gold and this analysis does not indicate (nor does it aim to do so) whether gold is likely to move higher or lower in the short- or medium term. In order to determine the latter, many additional factors need to be considered (i.e. sentiment, chart patterns, cycles, indicators, ratios, self-similar patterns and more) and we are taking them into account (and discussing the short- and medium-term outlook) in our Gold & Silver Trading Alerts.
-
Gold Sings a “Hot N Cold” Song
April 30, 2021, 11:15 AMAlthough spring has begun, we can still find ourselves in winter, or even summer. Gold may benefit from such a seasonal aberration.
Oh, how wonderful, spring has finally started, hasn’t it? We have April, after all. Well, in calendar terms, it’s indeed spring, but economically it can be summer already or still the beginning of winter. How so? I refer here to Kondratiev cycles (also known as Kondratieff cycles or Kondratyev cycles).
As a reminder, Nikolai Kondratiev was a Russian economist who noted in the 1920s that capitalist economies experience long super-cycles, lasting 40-60 years (yup, it’s not a very precise concept). His idea was that capitalism was not on an inevitable path to destruction, but that it was rather sustainable and cyclical in nature. Stalin didn’t like this conclusion and ordered a prison sentence and, later, an execution for Kondratiev. And you thought that being an economist is a boring and safe profession!
The Kondratiev cycles, also called waves, are composed of a few phases, similar to the seasons of the year. In 2018, I defined them as follows:
- Spring: economic upswing, technological innovation which drives productivity, low inflation, bull market in stocks, low level of confidence (winter’s legacy).
- Summer: economic slowdowns combined with high inflation and bear market in stocks, this phase often ends in conflicts.
- Autumn: the plateau phase characterized by speculative fever, economic growth fueled by debt, disinflation and high level of confidence.
- Winter: a phase when the excess capacity is reduced by deflation and economic depression, debt is repaid or repudiated. There is a stock market crash and high unemployment rate, social conflicts arise.
However, other economists define these phases in a slightly different manner. For them, spring is an inflationary growth phase, summer is a period of stagflation (inflationary recession), autumn a deflationary growth period, while winter is a time of deflationary depression.
So, which phase are we in? That’s a very good question. After all, the whole concept of Kondratiev cycles is somewhat vague, so it’s not easy to be precise. But some experts believe that we are likely in the very early part of the winter after a very long autumn. Indeed, there are some important arguments supporting such a view.
First, we have been experiencing a long period of disinflation (and later just low inflation), a decline in the bond yields, and economic growth fueled by debt. I refer here to the time from the end of the Great Recession until the Covid-19 pandemic, but one can argue that autumn lasted since the early 1980s, when both interest rates and inflation peaked, as the chart below shows.
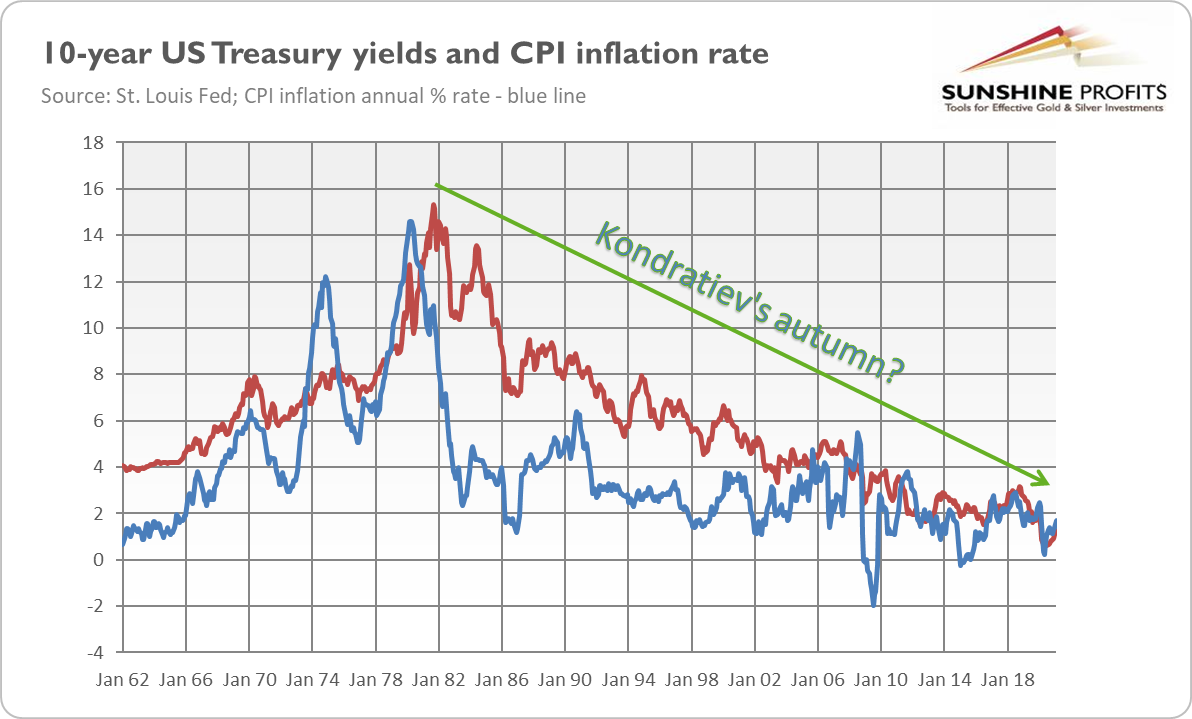
Second, winter is believed to be a depression phase with stock and debt markets collapsing, but with commodity prices increasing. And this is exactly what we are observing right now. I refer here to the rally in several commodity prices. This is at least partially caused by the disruption in the supply chains amid the epidemic in the U.S. and worldwide pandemic, but if the bull market in commodities sets in for good, this could be a negative harbinger for the stock market. After all, more expensive raw materials eat into corporate profits.
Third, winter is thought of as a period that tears the social fabric of society and deepens the inequalities. The data is limited, but the coronavirus crisis has been one of the most unequal in modern U.S. history, as its costs have been borne disproportionately by the poorer parts of society that have been unable to work online.
So, “winter is coming” may be a belated warning, as winter could have already begun. Later during this period, we could see bankruptcies of firms and financial institutions, and even some governments, as a delayed consequences of the coronavirus crisis. This is bad news for the whole of Westeros and its economy, but good for gold. Investors who don’t like the cold should grab a golden blanket to hedge them from the winter.
However, in 2018, I expressed the opinion that summer may come in the 2020s, as the debts are rising and the inflationary pressure is growing:
As the global economy recovered and now expands, inflation is low, while stocks still rally, we enjoy spring. This is why gold has remained in a broad sideways trend in the last few years. However, as we are on the edge of the next technological revolution, confidence is finally rising and there are worries about higher prices, and we could enter the summer phase in the not-so-distant future.
And I still believe that my opinion makes sense. Indeed, after the global financial crisis of 2007-9, we have seen several spring features: low inflation, a bull market in stocks, and a low level of confidence (after all, there was “the most hated rally in the stock market”), which was a legacy of winter, i.e., the collapse of Lehman Brothers and the following economic crisis.
And summer is generally a period of stagflation, which is exactly what I’m expecting. You see, after a strong economic recovery in the nearest quarters, the U.S. economy is likely to return to a mediocre pace of economic growth, but with much higher inflation. After all, there is strong monetary and fiscal stimulation ongoing right now, another feature of summer. Meanwhile, winter is generally a deflationary period, so the specter of inflation rather suggests that summer may be coming and investors should hedge themselves against waves of gold.
Luckily, gold offers its protection not only against winters, but also against summers. Indeed, gold performs the worst during autumns, when there is disinflation, like in the 1980s and the 1990s, and the best during winters (due to the economic crisis – remember the 2000s?) and the summers (due to high inflation – remember the 1970s?).
Thank you for reading today’s free analysis. If you enjoyed it, and would you like to know more about the links between the economic outlook, the current (past?) crisis and the gold market, we invite you to read the April Gold Market Overview report. Please note that in addition to the above-mentioned free fundamental gold reports, we provide premium daily Gold & Silver Trading Alerts with clear buy and sell signals. We provide these premium analyses also on a weekly basis in the form of Gold Investment Updates. In order to enjoy our gold analyses in their full scope, we invite you to subscribe today. If you’re not ready to subscribe though, and are not on our gold mailing list yet, we urge you to sign up. It’s free and if you don’t like it, you can easily unsubscribe. Sign up today!
Arkadiusz Sieron, PhD
Sunshine Profits: Effective Investment through Diligence & Care.-----
Disclaimer: Please note that the aim of the above analysis is to discuss the likely long-term impact of the featured phenomenon on the price of gold and this analysis does not indicate (nor does it aim to do so) whether gold is likely to move higher or lower in the short or medium term. In order to determine the latter, many additional factors need to be considered (i.e., sentiment, chart patterns, cycles, indicators, ratios, self-similar patterns and more) and we are taking them into account (and discussing the short- and medium-term outlook) in our Gold & Silver Trading Alerts.
-
Will a Fiscal Revolution Raise Gold to the Throne?
April 23, 2021, 10:00 AMRevolution, baby! There is growing acceptance for an aggressive fiscal policy, which could be supportive for gold prices from the fundamental, long-term point of view.
We live in turbulent times. The pandemic is still raging and will most likely have lost lasting effects on our society. But a revolution is also happening right before our eyes. And I don’t mean another storming of the U.S. Capitol or the clash of individual investors with big fish on Wall Street. I have in mind something less spectacular but potentially more influential: a macroeconomic revolution.
I refer here to the growing acceptance of easy fiscal policy. In the aftermath of the Great Recession, the central banks adopted an aggressive monetary policy, slashing interest rates to almost zero and introducing quantitative easing. It has become a new norm since then.
But fiscal policy was another kettle of fish. Although almost nobody cared about balanced government budgets, people at least pretended to worry about overly large fiscal deficits and an overly quick accumulation of public debt. For example, while Obama wanted $1.8 trillion in fiscal stimulus in a response to the global financial crisis of 2007-09, Congress passed a package of about $800 billion, as Republicans opposed larger spending. But in March 2020, Congress passed the CARES act worth about $2 trillion (and additional significant stimulus in December 2020), with the full support of Republicans.
Even Germany – the country famous for its fiscal conservatism – ran a fiscal deficit in 2020 and – what’s more – agreed to issue bonds jointly with other EU countries, although it was previously a taboo. The International Monetary Fund (IMF), another bastion of economic orthodoxy, which advocated for austerity and balanced budgets for years, gave up during the epidemic and started to call for more fiscal stimulus to fight the economic crisis.
And this fiscal revolution is already seen in data. As the chart below shows, the U.S. fiscal deficit has increased from 4.6 percent of GDP in 2019 (which was already at an elevated level) to 15 percent of GDP in 2020, the highest level in the post-war era.
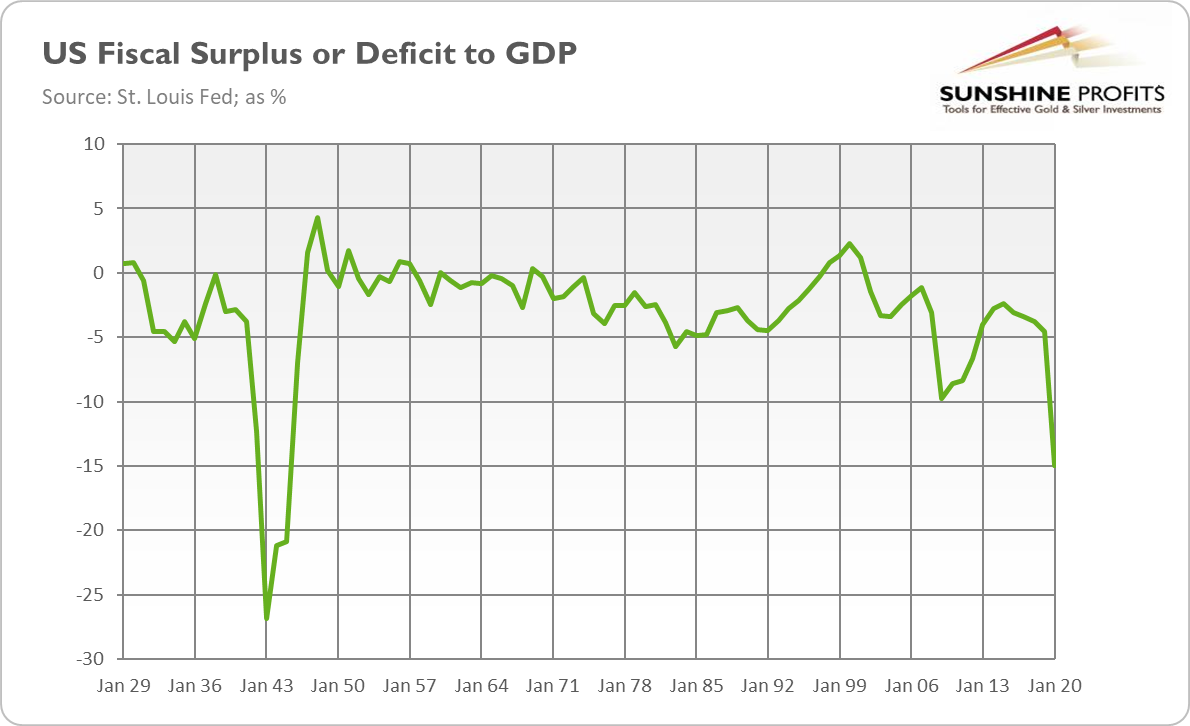
According to the IMF’s Fiscal Monitor Update from January 2021, fiscal deficits amounted to 13.3 percent of GDP, on average, in advanced economies, in 2021, a spike from 3.3 percent seen in 2019. As a consequence, the gross global debt approached 98 percent in 2020 and it’s projected to reach 99.5 percent of the world’s GDP by the end of this year.
What is important to note here is that government support wasn’t limited mainly to the financial institutions and big companies (such as automakers), as was the case in 2009, but it was distributed more widely. There was a huge direct money transfer to Main Street, including checks for practically all citizens. This is important for two reasons.
First, money flowing into the economy through nonfinancial institutions and people’s accounts may be more inflationary. This is because money doesn’t stay in the financial market where it mainly raises asset prices, but it’s more likely to be spent on consumer goods, boosting the CPI inflation rate. Higher officially reported inflation (and relatively lower asset prices) should support gold, which is seen by investors as an inflation hedge.
Second, the direct cash transfer to the people creates a dangerous precedent. From now, each time the economy falls into crisis, people will demand checks. It means that fiscal responses would have to be increasingly larger to meet the inflated expectations of the public. It also implies that we are approaching a universal basic income, with its mammoth fiscal costs and all related negative economic and social consequences.
Summing up, we live in revolutionary times. The old paradigm that “central banks are the only game in town” has been replaced by the idea that fiscal policy should be more aggressively used. Maintaining balanced budgets is also a dead concept – who would care about deficits when interest rates are so low?
However, assigning a greater role to fiscal policy in achieving macroeconomic goals increases the risk of higher inflation and macroeconomic instability, as politicians tend to be pro-cyclical and reckless. After all, the economic orthodoxy that monetary policy is better suited to achieve macroeconomic stability didn’t come out from nowhere, but from awful experiences of the fiscal follies of the past. I’m not a fan of central bankers, but they are at least less short-sighted than politicians who think mainly about how to win the next election and stay in power.
Hence, the growing acceptance of easy fiscal policy should be positive for gold prices, especially considering that it will be accompanied by an accommodative monetary policy. Such a policy mix should increase the public debt and inflation, which could support gold prices. The caveat is that investors have so far welcomed more stimulus flowing from both the Fed and the Treasury. But this “go big” approach of Powell and Yellen increases the longer-term risk for the economy, which could materialize – similar to the pandemic – sooner than anyone thought.
Thank you for reading today’s free analysis. If you enjoyed it, and would you like to know more about the links between the economic outlook, the current (past?) crisis and the gold market, we invite you to read the April Gold Market Overview report. Please note that in addition to the above-mentioned free fundamental gold reports, we provide premium daily Gold & Silver Trading Alerts with clear buy and sell signals. We provide these premium analyses also on a weekly basis in the form of Gold Investment Updates. In order to enjoy our gold analyses in their full scope, we invite you to subscribe today. If you’re not ready to subscribe though, and are not on our gold mailing list yet, we urge you to sign up. It’s free and if you don’t like it, you can easily unsubscribe. Sign up today!
Arkadiusz Sieron, PhD
Sunshine Profits: Effective Investment through Diligence & Care.-----
Disclaimer: Please note that the aim of the above analysis is to discuss the likely long-term impact of the featured phenomenon on the price of gold and this analysis does not indicate (nor does it aim to do so) whether gold is likely to move higher or lower in the short or medium term. In order to determine the latter, many additional factors need to be considered (i.e., sentiment, chart patterns, cycles, indicators, ratios, self-similar patterns and more) and we are taking them into account (and discussing the short- and medium-term outlook) in our Gold & Silver Trading Alerts.
-
Will Rates Rally Further, Pushing Gold Down?
April 16, 2021, 10:23 AMThe recent rally in the bond yields pushed gold prices down, but this trend won’t continue forever, as the Fed will likely be forced to step in.
In March, we saw a continuation of the rally in bond yields that started in February. As the chart below shows, the 10-year real interest rates have soared from -1.06 on February 10 to -0.66 percent on March 23.
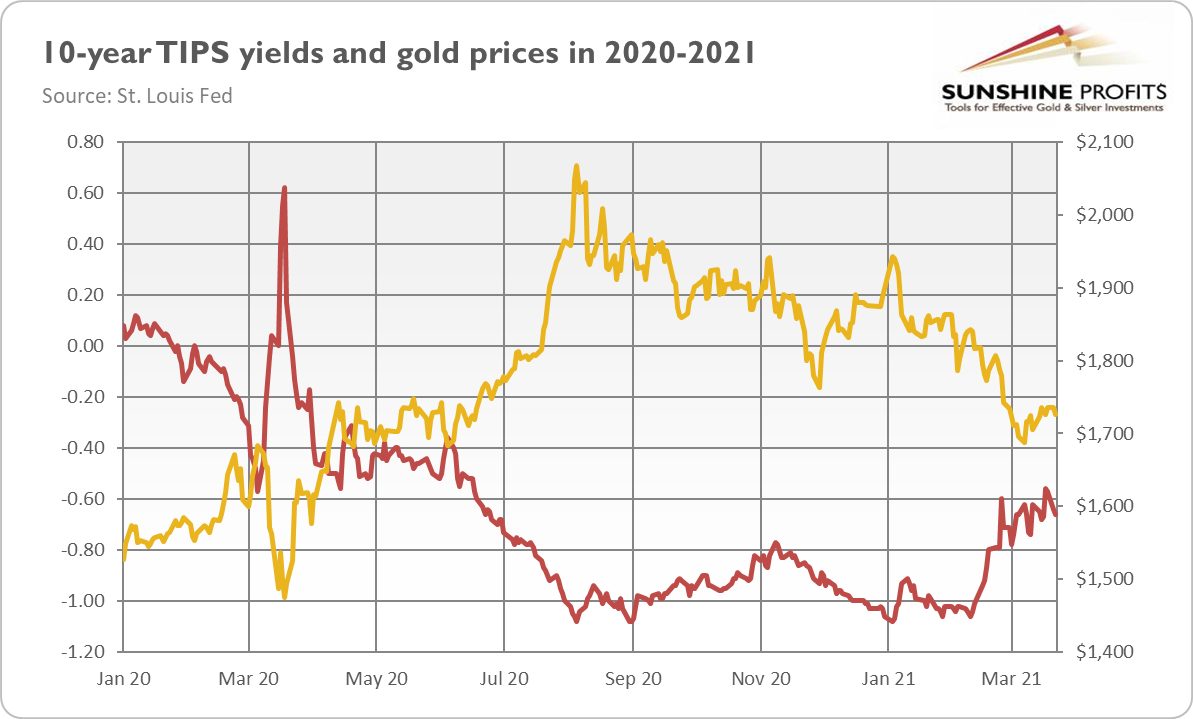
What is clear from the chart is the strong correlation between the 10-year TIPS yields and the gold prices. As a consequence, the rising bond yields made gold struggle. However, in March, the real interest rates were much more choppy compared to February, when they surged decisively. It may signal a lack of fuel for the further rally, at least for a while.
Now, what is important here is that despite the recent jump in the real yields, they remain extremely low from the historical point of view. And they remain well below zero! This is good news for the gold market, as the yellow metal shines the most when real interest rates are negative.
Of course, the direction of change is also very important, not just the absolute level. So, the question is, will the rates increase further? Well, it’s unfortunately possible, as the improving economic outlook and risk appetite are encouraging investors to buy stocks rather than bonds.
On the other hand, the rising inflation expectations suggest that real yields may struggle to increase further, or they actually may go down. As the chart below shows, the market expectations of inflation in the next 10 years, derived from the Treasuries, have risen from 0.50 at the bottom in March 2020 to 2.31 on March 24, 2021.
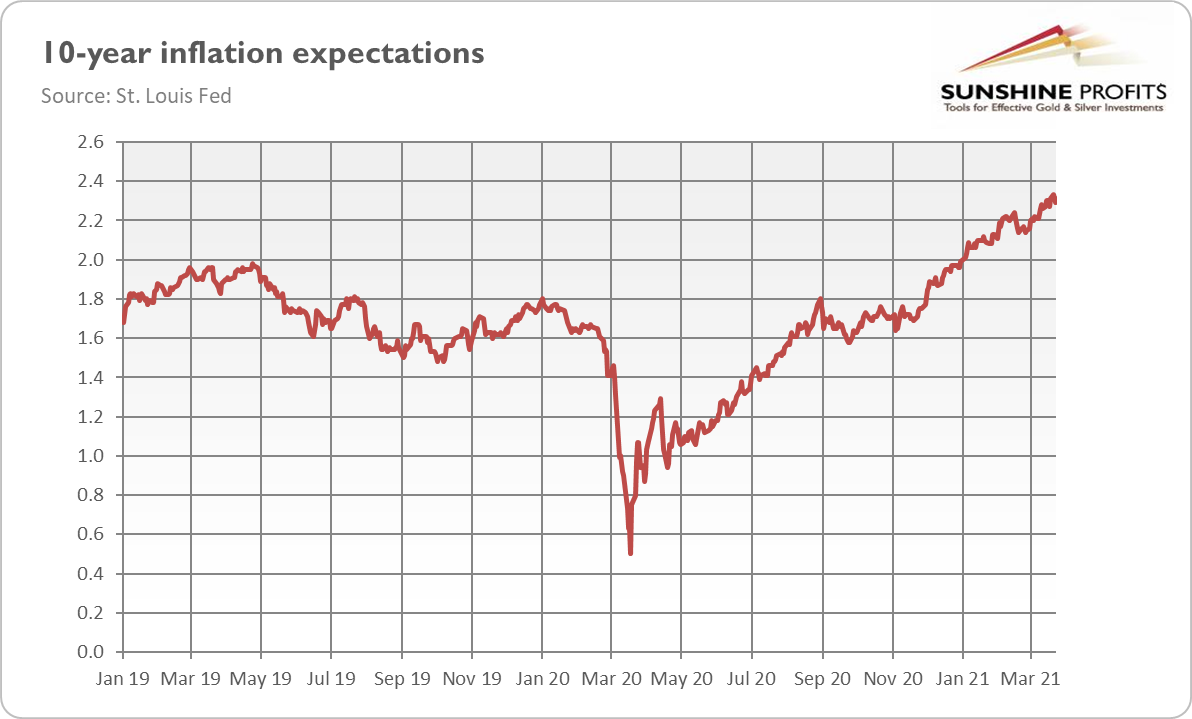
Given the increase that has already taken place, the further rise may be limited. But the broad money supply is still rising at an accelerating pace, and investors still don’t believe that the Fed will not hike the federal funds rate to combat rising inflation. They don’t buy the new monetary framework and all the talking about letting inflation overshoot the Fed’s target. Of course, the promise to be irresponsible in the future is not very credible, but investors shouldn’t underestimate the recklessness of central bankers.
You see, we live in an era of weak policymakers unable to make serious commitments, or take unpopular actions, contrary to the needs of Wall Street and the government. For example, Janet Yellen, as a Treasury Secretary, should stress fiscal discipline – instead, she praised the “go big” approach of the new administration. Congress has already passed the $1.9 trillion fiscal stimulus and the next additional spending is coming. The legislative proposal of new government expenditures on infrastructure and other priorities (such as climate change and the labor market) could collectively cost more than $3 trillion.
It’s true that the additional government spending and the necessary borrowing could push up the yields (this is an important downward risk for gold). But rising interest rates could hamper the economic recovery and make government financing more costly, further ballooning already mammoth fiscal deficits. So, the Fed will likely have to step in and expand its quantitative easing program or introduce other measures, such as the yield curve control, to curb the long-term interest rates. It will weaken the dollar, thus supporting gold prices.
As a reminder, the Bank of Japan has started to target the yield on 10-year government bonds at around zero percent in 2016, as it decided that the rapid monetary base expansion via large-scale asset purchases was unsustainable. More recently, the European Central Bank has announced in March the acceleration in the pace of its QE in a response to the rally in bond yields.
So, do you really think that the Fed won’t follow suit? That Powell will not help Yellen, his former boss from the Fed? The sharp increase in yields would be inconsistent with the Fed’s dovish policy and the overall debt-driven economic growth. Hence, if the interest rates increase too much, be sure that the Fed will do something, providing a long-awaited support for the price of gold.
What is “too much”? Not so much, at least not in the debt-trap we live in. Some analysts believe that this could occur if nominal 10-year Treasury yields rise over 2 percent, not too far from the current levels, as one can see in the chart below.
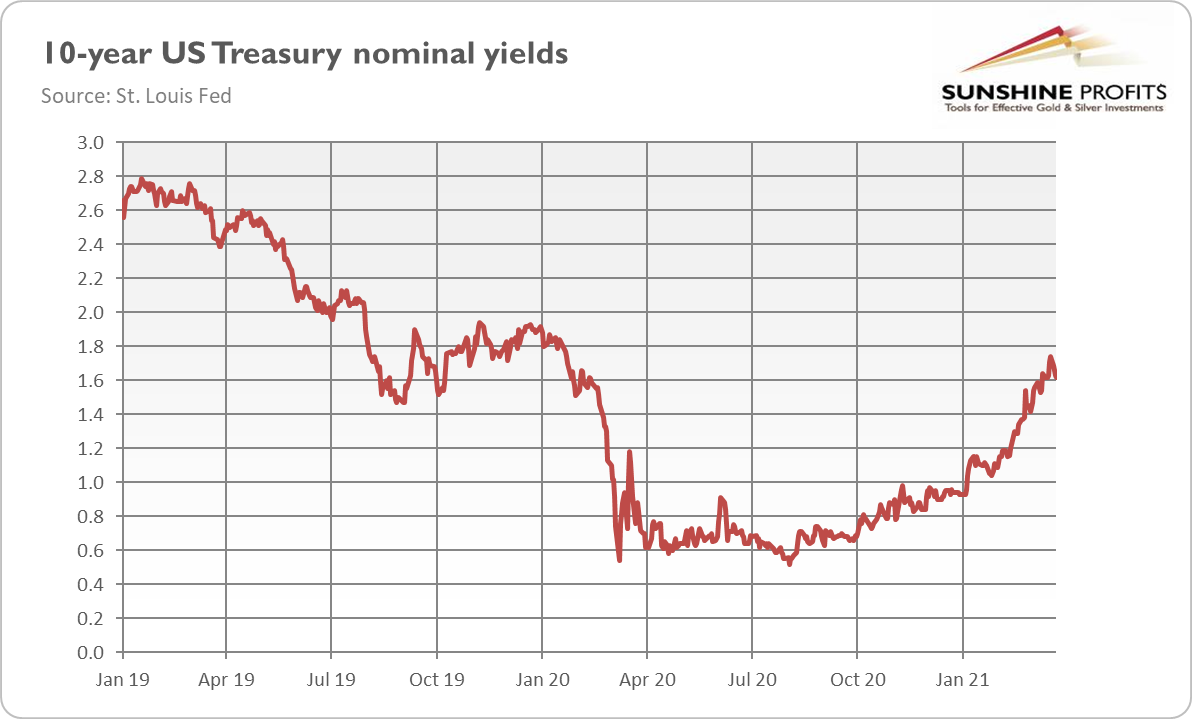
Should we be surprised, given the bond bubble created by the central banks? They have kept the bond yields artificially depressed for years, so even a modest normalization – perfectly justified by the expectations of economic recovery and rising inflation – could collapse the house of cards and cause a financial crisis. Hence, although markets have become more optimistic recently, I’m afraid that bears and black swans haven’t said the last word yet. And neither has gold.
Thank you for reading today’s free analysis. If you enjoyed it, and would you like to know more about the links between the economic outlook, the current (past?) crisis and the gold market, we invite you to read the April Gold Market Overview report. Please note that in addition to the above-mentioned free fundamental gold reports, we provide premium daily Gold & Silver Trading Alerts with clear buy and sell signals. We provide these premium analyses also on a weekly basis in the form of Gold Investment Updates. In order to enjoy our gold analyses in their full scope, we invite you to subscribe today. If you’re not ready to subscribe though, and are not on our gold mailing list yet, we urge you to sign up. It’s free and if you don’t like it, you can easily unsubscribe. Sign up today!
Arkadiusz Sieron, PhD
Sunshine Profits: Effective Investment through Diligence & Care.-----
Disclaimer: Please note that the aim of the above analysis is to discuss the likely long-term impact of the featured phenomenon on the price of gold and this analysis does not indicate (nor does it aim to do so) whether gold is likely to move higher or lower in the short or medium term. In order to determine the latter, many additional factors need to be considered (i.e., sentiment, chart patterns, cycles, indicators, ratios, self-similar patterns and more) and we are taking them into account (and discussing the short- and medium-term outlook) in our Gold & Silver Trading Alerts.
-
Will Upcoming Inflation Take Gold With It?
April 9, 2021, 9:48 AMInflation is coming. Gold may benefit from it, especially if inflation turns out to be more long-lasting than central bankers and markets believe.
Brace yourselves, inflation is coming! Importantly, not only grumblers such as myself are talking about rising prices right now, but even the Fed officials themselves admitted that inflation will jump this year. Indeed, in the latest dot plot, the Federal Open Market Committee (FOMC) expects that the PCE annual percent change will soar from 1.3 percent in December 2020 to 2.4 percent at the end of this year. Importantly, their projections increased significantly in the last three months when they amounted to 1.8 percent.
And remember, we are talking here about the official inflation figures. The real inflationary pressure, which also affects asset prices, is much stronger. Furthermore, the pandemic changed the composition of consumption, as people are buying more goods and less services. And guess what, the prices of goods are rising more than the prices of services, so many people’s actual consumption baskets have become more expensive than official ones, implying that true inflation is higher than the officially reported one, as the IMF has recently admitted.
Does this mean that the FOMC members have all suddenly become monetary hawks worried about higher inflation? Not at all. The Fed believes that inflation will be temporary, caused by the base effects (very low inflation readings in the second quarter of 2020) and by the reopening of the economy that will trigger higher consumer spending and some increases in prices.
The U.S. central bank might be right. After all, there will be some temporary forces at play. There always are, but – oh, what a funny thing! – the Fed always cites “transient effects on inflation” when it’s increasing, but not when it’s declining. The problem is, however, that the markets don’t believe the U.S. central bank. Please take a look at the chart below, which displays inflation expectations over the next five and ten upcoming years.
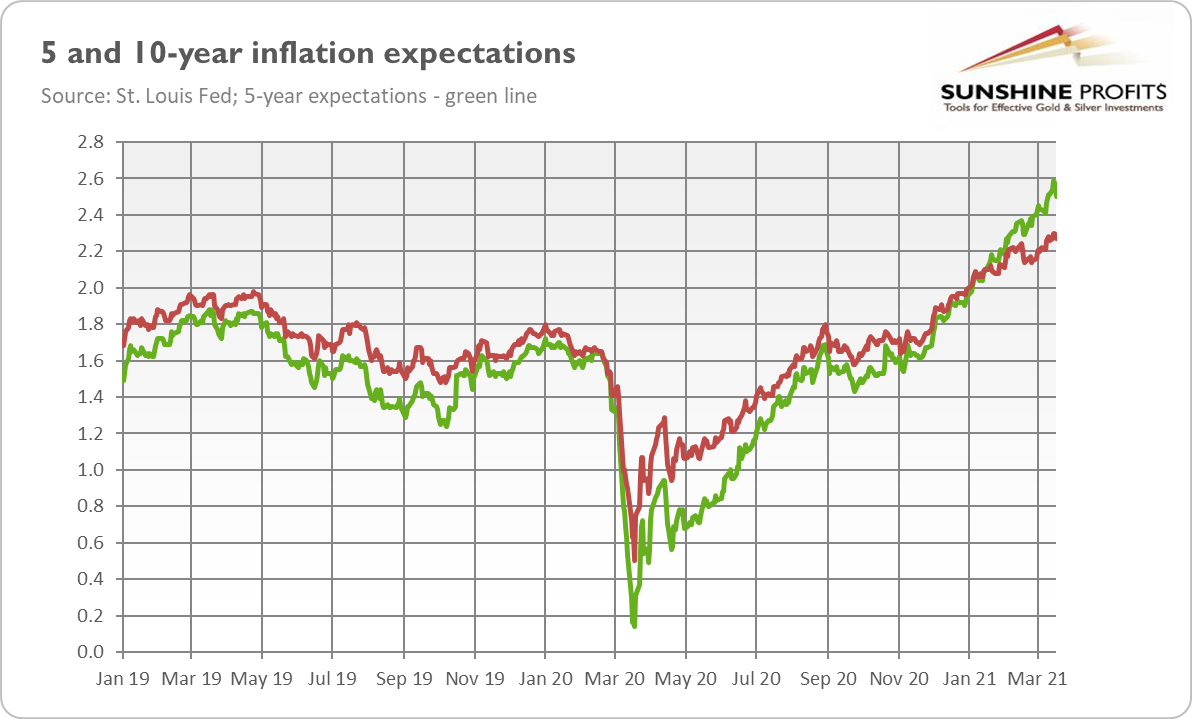
As you can see, both medium-term and long-term inflation expectations have significantly increased in the last few months. It means that investors don’t only expect a temporary rise in inflation – on the contrary, they forecast a more persistent increases in prices. Indeed, Mr. Market believes that inflation will be, on average, 2.5 percent in the next 5 years and almost 2.3 percent in the next 10 years, significantly above the Fed’s target of 2 percent.
Of course, it might be the case that Mr. Market is wrong, and Mr. Powell is right. But what is disturbing is the Fed’s confidence – or, rather overconfidence – that it can contain inflation if it turns out to be something more than only a temporary phenomenon. Such a conceit led to stagflation in the 1970s. Gold shined at that time.
Then, as today, the central bank focused more on the maximum employment than inflation, believing that it can always control the latter by raising the federal funds rate if necessary. But, as Robert J. Barro, from Harvard University, points out, “the problem is that hiking short-term rates will have little impact on inflation once high long-term expected inflation has taken root.”
And the recent Fed’s actions, including the new monetary framework, according to which the U.S. central bank tries to overshoot its target for some time, may easily waste the reputational capital that was created by Paul Volcker and de-anchor inflation expectations.
In other words, a negative shock can be accommodated by the central bank without long-lasting effects, as people understand that it’s a unique one-off event, after which everything will return to normalcy. But the Fed is far from normalizing its monetary policy. On the contrary, it has recently signaled that it wouldn’t raise interest rates preemptively to prevent inflation, as it could hamper the economic recovery. The risk here is that if people start to view exceptional as the new normal, their inflation expectations could shift, and become unanchored.
To sum up, it might be the case that markets are overstating short-term inflation risks. But it’s also possible that politicians and central bankers understate the longer-term inflationary dangers, as Kenneth Rogoff, also from Harvard University, argues. After all, unlike in the aftermath of the Great Recession, when only the monetary base skyrocketed, the pace of growth of the broad money supply also soared this time – and it’s still increasing, as the chart below shows.
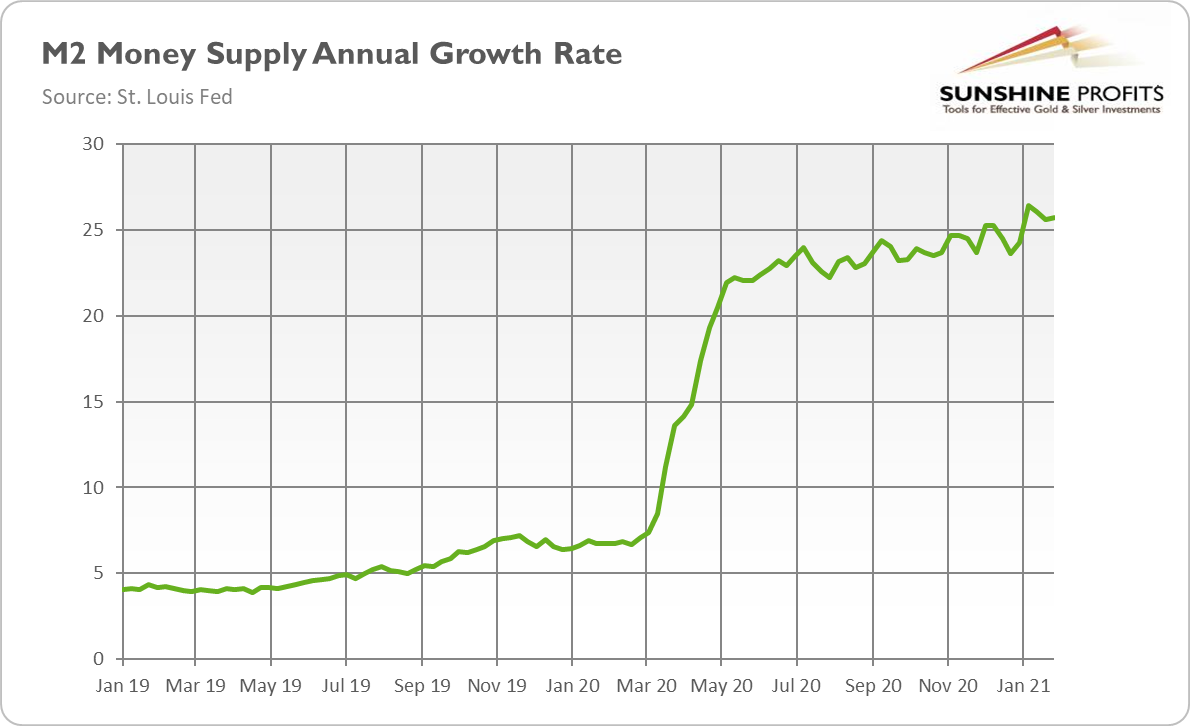
In other words, while all the created liquidity after the global financial crisis of 2007-2009 flowed mainly into the financial markets, during the pandemic, it flowed into the real economy to a much larger extent, which can create more inflationary pressure.
What’s more, the easy monetary policy is now accompanied by a very loose fiscal policy and the unprecedentedly large fiscal deficits, which could push the economy deeper into the debt trap. This could undermine the central-bank independence and prevent a timely normalization of interest rates, not to mention the weakening of globalization’s downside impact on inflation, caused partially by demographic factors and reshuffling in supply chains. Last but not least, the rising commodity prices and international transport costs, accompanied by the weakening U.S. dollar, may be harbingers of an approaching inflation monster.
What does it all mean for the gold market? Well, the jump in inflation in 2021 should be positive for the yellow metal, which could gain as an inflation hedge. The downward pressure on the real interest rates should also be supportive for gold prices, although the rally in the bond yields may counteract this effect. But if Powell is right and inflation turns out to be only temporary, then gold may be hard hit, and we could see a goldilocks economy again (i.e., fast economic growth with low inflation). However, if markets are right, or if the long-term inflationary risks materialize, which even investors may understate, gold should shine.
Thank you for reading today’s free analysis. If you enjoyed it, and would you like to know more about the links between the economic outlook, the current (past?) crisis and the gold market, we invite you to read the April Gold Market Overview report. Please note that in addition to the above-mentioned free fundamental gold reports, we provide premium daily Gold & Silver Trading Alerts with clear buy and sell signals. We provide these premium analyses also on a weekly basis in the form of Gold Investment Updates. In order to enjoy our gold analyses in their full scope, we invite you to subscribe today. If you’re not ready to subscribe though, and are not on our gold mailing list yet, we urge you to sign up. It’s free and if you don’t like it, you can easily unsubscribe. Sign up today!
Arkadiusz Sieron, PhD
Sunshine Profits: Effective Investment through Diligence & Care.-----
Disclaimer: Please note that the aim of the above analysis is to discuss the likely long-term impact of the featured phenomenon on the price of gold and this analysis does not indicate (nor does it aim to do so) whether gold is likely to move higher or lower in the short or medium term. In order to determine the latter, many additional factors need to be considered (i.e., sentiment, chart patterns, cycles, indicators, ratios, self-similar patterns and more) and we are taking them into account (and discussing the short- and medium-term outlook) in our Gold & Silver Trading Alerts.
-
Is Silver the New Gold?
March 26, 2021, 8:56 AMMany analysts expect silver to outperform gold this year. It’s possible, but investors shouldn’t count on improving economic conditions and industrial demand.
Silver has recently become a hot investment theme. For months, if not years, some analysts claimed that silver is undervalued relative to gold. Then, at the beginning of 2021, Reddit revolutionaries tried to trigger a short squeeze in silver. Although that attempt failed, silver has, so far, clearly been outperforming gold this year, as the chart below shows. So, is silver now a better investment than gold?
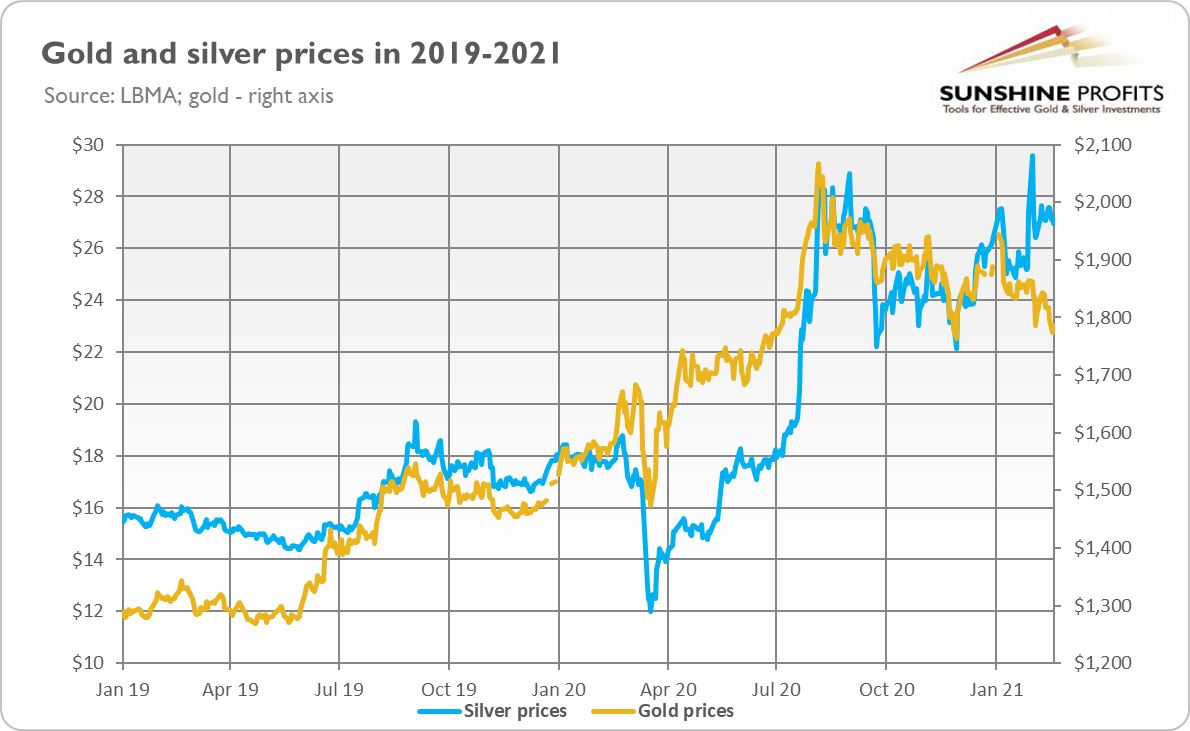
Well, why would it be? After all, many investors buy silver for the same reasons that they purchase gold – it’s a rare, monetary metal which may be used as an inflation hedge, a safe-haven asset against tail risks, or a portfolio diversifier. It’s just cheaper than gold – and this is why it’s often called the poor man’s gold.
Indeed, silver has a very high positive correlation with gold. Just take a look at the chart below, which illustrates the movement of gold and silver prices since April 1968. The shapes of the lines are very similar and the correlation coefficient is as high as 0.90!
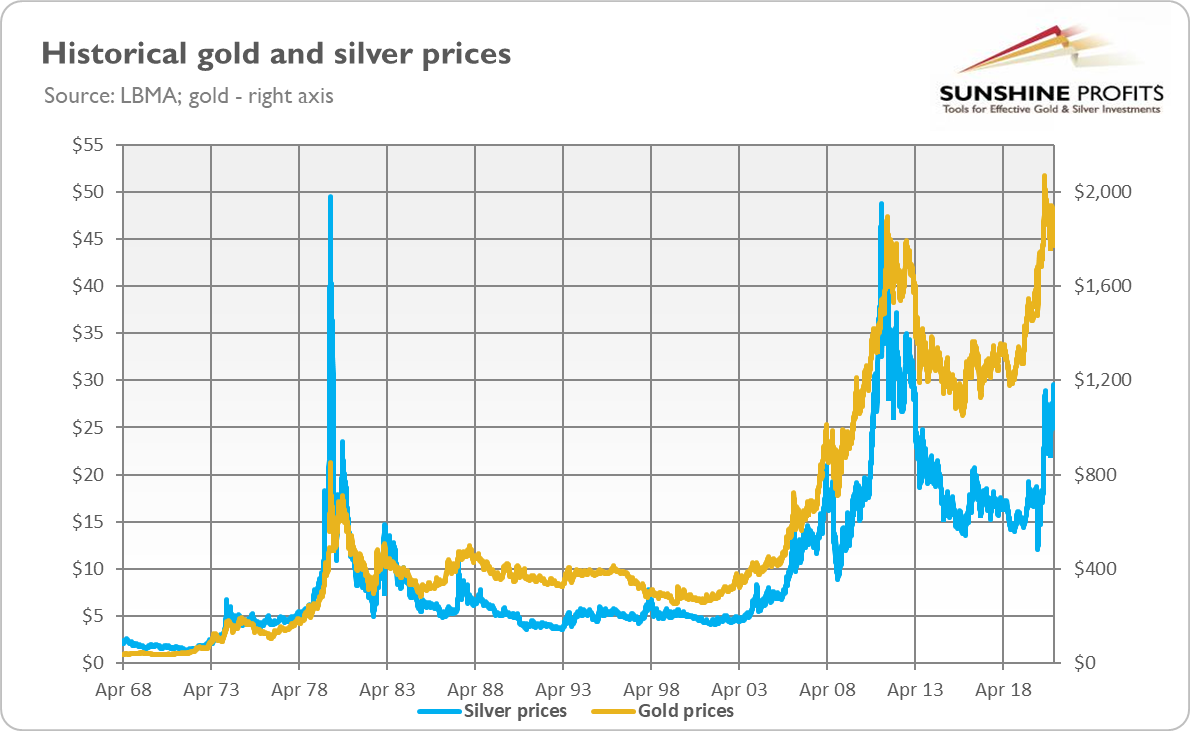
On the other hand, silver may indeed outperform gold. After all, silver has a dual nature. It is not only a monetary asset – like gold – but also an industrial commodity. This implies that silver is more business cycle-sensitive than gold. Therefore, given that the global economy is recovering from the deep recession caused by the coronavirus pandemic and the Great Lockdown, silver may outperform gold. In other words, although both gold and silver could benefit from reflation during the recovery, improving economic conditions could support the latter metal more.
Another argument for silver shining brighter than gold in 2021 is the historical pattern according to which silver prices tend to follow gold prices with some lag, just to catch up with them later – often overreacting compared with gold’s behavior.
So much for theory. Let’s move on to the data now and analyze the previous economic crisis, i.e., the Great Recession, and the following recovery. As the chart below shows, both metals moved generally in tandem, however, silver was more volatile than gold.
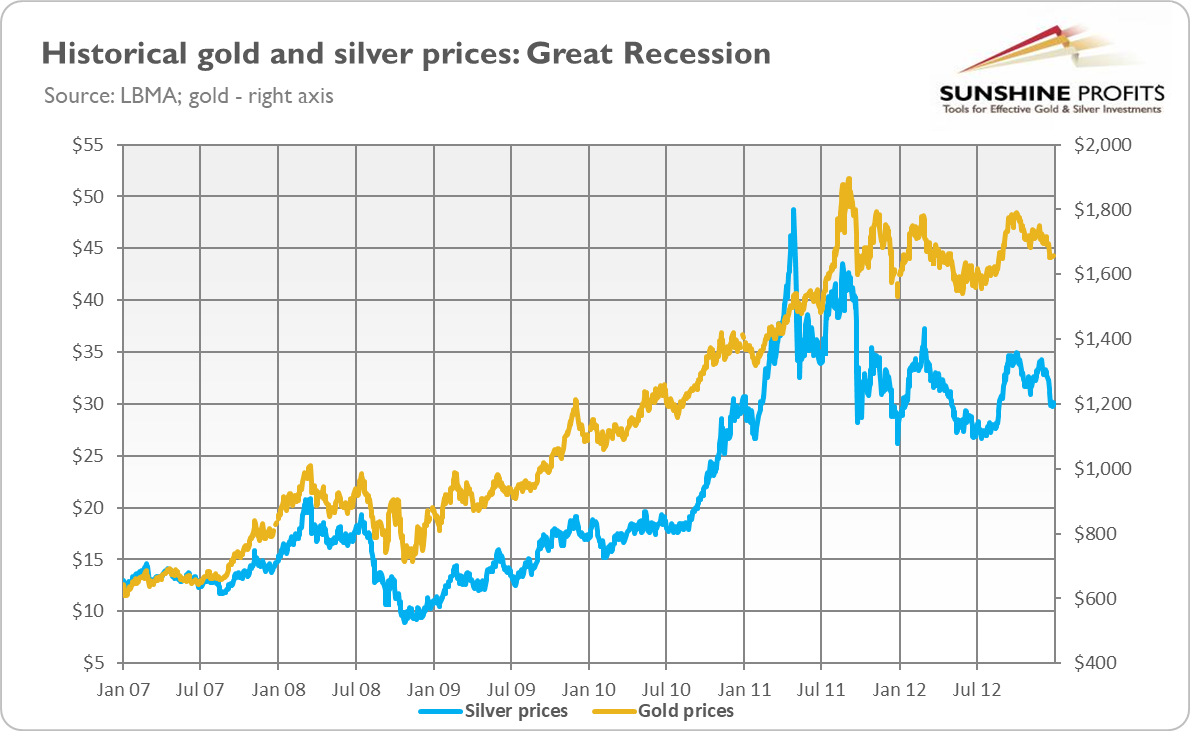
For example, from its local bottom in mid-2007 to its local peak in early 2008, silver rose 79 percent, while gold “only” 57 percent. Then, in the first phase of the global financial crisis, silver plunged 58 percent (from $20.92 to $8.88), while gold slid 30 percent (from $1011.25 to $712.5). Subsequently, silver skyrocketed 448 percent, reaching a peak of $48.7 in April 2011. Meanwhile, the price of gold reached its peak of $1875 a little bit later, in September 2011, gaining 166 percent. Finally, silver plunged 46 percent by the end of 2011, while gold dropped only 19 percent. This shows that the economic recovery and industrial revival that followed the Great Recession didn’t help silver to shine. Actually, the bluish metal underperformed gold.
Similarly, silver plunged more than gold (25 versus 17 percent) in the run-up to the burst of the dot-com bubble, as one can see in the chart below. It also gained less than gold in the aftermath of the 2001 recession (25.4 versus 27.5 percent), and then it plunged in the third quarter of 2002, significantly underperforming gold.
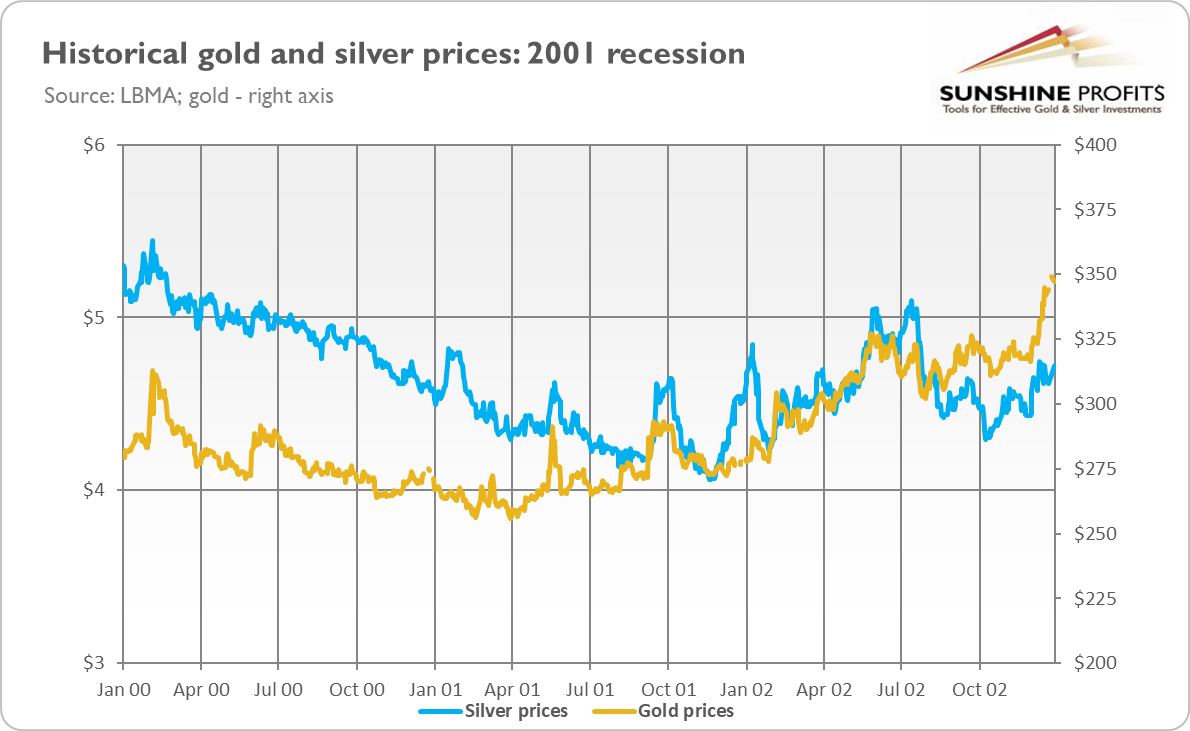
Therefore, the recent history doesn’t confirm the view that silver should be outperforming gold in the early stages of a recovery, because it’s an industrial commodity that benefits from improving economic conditions. Silver was never in a bullish mode when gold was in a bear market, and it rather tends to rally rapidly in the late stage of the commodity cycle, like in the 2000s.
Actually, one can argue that silver has the best period behind itself. After all, it soared 141 percent from late March to September 2020, while gold rallied “only” 40 percent. So, it might be the case that the catch-up period, in which silver outperforms gold, is already behind us. Indeed, as the chart below shows, the gold-to-silver ratio has recently declined to a more traditional range of 60-70.
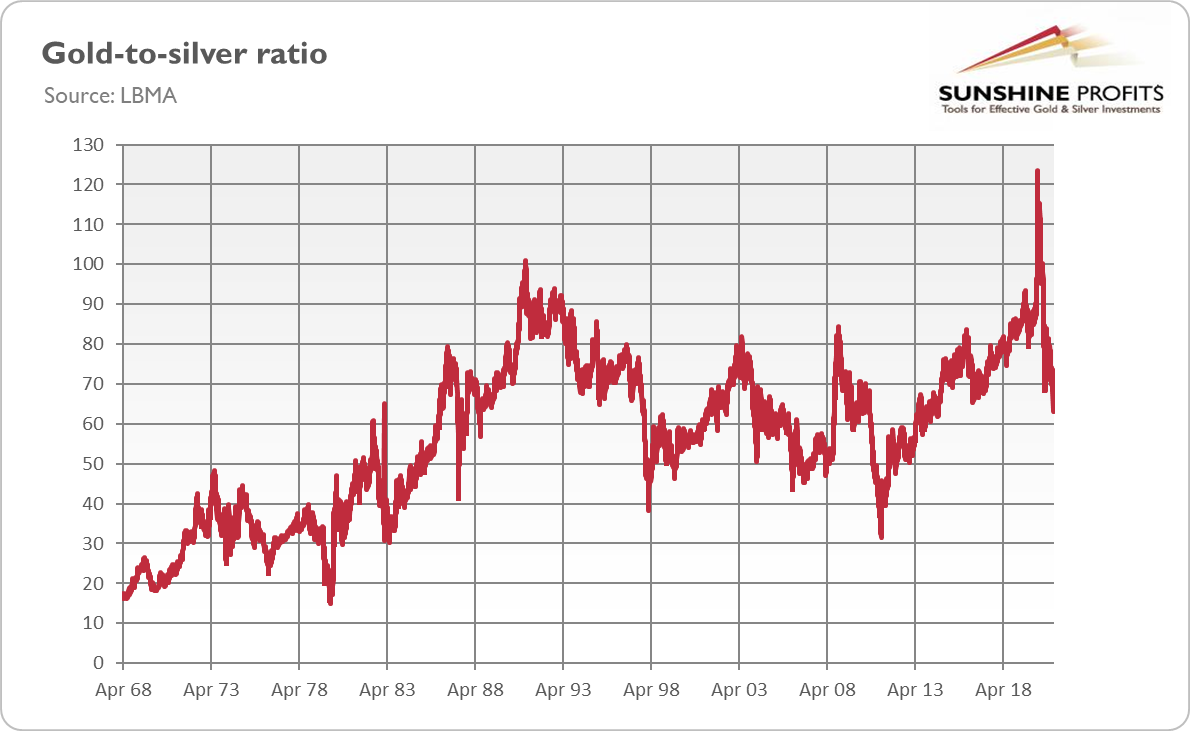
This, of course, doesn’t mean that silver cannot rise further. However, it seems that the metal has already caught up somewhat with its more precious cousin. So, it’s possible that silver can outperform gold in 2021, as Biden’s focus on renewable energy may help silver – as a major part of the metal used in industry is now linked to solar panels and electronics, but history teaches us that investors shouldn’t count on industrial demand. Silver didn’t outperform gold during recoveries from the previous recessions. Although silver has a dual nature, its price is highly correlated with gold prices. Therefore, macroeconomic factors, such as the U.S. dollar, real interest rates, risk appetite, inflation, public debt, monetary policy, fiscal policy, etc., should have a stronger impact on silver than industrial demand. As always, those entering the silver market should remember that silver price movements are more violent than in the gold market.
Thank you for reading today’s free analysis. If you enjoyed it, and would you like to know more about the links between the economic outlook, the current (past?) crisis and the gold market, we invite you to read the March Gold Market Overview report. Please note that in addition to the above-mentioned free fundamental gold reports, and we provide premium daily Gold & Silver Trading Alerts with clear buy and sell signals. We provide these premium analyses also on a weekly basis in the form of Gold Investment Updates. In order to enjoy our gold analyses in their full scope, we invite you to subscribe today. If you’re not ready to subscribe yet though and are not on our gold mailing list yet, we urge you to sign up. It’s free and if you don’t like it, you can easily unsubscribe. Sign up today!
Arkadiusz Sieron, PhD
Sunshine Profits: Effective Investment through Diligence & Care.-----
Disclaimer: Please note that the aim of the above analysis is to discuss the likely long-term impact of the featured phenomenon on the price of gold and this analysis does not indicate (nor does it aim to do so) whether gold is likely to move higher or lower in the short- or medium term. In order to determine the latter, many additional factors need to be considered (i.e. sentiment, chart patterns, cycles, indicators, ratios, self-similar patterns and more) and we are taking them into account (and discussing the short- and medium-term outlook) in our Gold & Silver Trading Alerts.
-
Will Trump-Biden Twin Deficit Support Gold?
March 22, 2021, 12:23 PMTwin deficits could negatively affect the U.S. economy, thereby supporting the yellow metal.
Twins. Many parents will tell you that they double the blessing. But economists would disagree, claiming that twins – i.e., twin deficits – could be negative for the economy. The recent deterioration in the U.S. current account and fiscal balance has sparked renewed debate over the twin deficit and its impact on the exchange rate – and the price of gold.
A twin deficit occurs when large fiscal deficits coexist with big trade deficits. The former happens when the government spends more money than it raises with taxes, while the latter is the result of imports exceeding exports. A historical example of the U.S. twin deficit occurred in the 1980s, when a significant expansion in the federal budget deficit accompanied a sharp deterioration in the nation’s current account balance. According to the Institute for International Economics’ report, “from 1980 to 1986, the federal budget deficit increased from 2.7 percent of GDP to 5 percent of GDP ($220 billion) and the current account deficit increased from 0 to 3.5 percent of GDP ($153 billion).”
Another example might be the 2000s. According to the New York Fed’s research paper, from 2001 to 2005, the U.S. current account and fiscal balances plunged by 3 and 4 percent of GDP, respectively. So, there is some correlation between these two. And some economists even believe that there is a causal relationship, i.e., that increases in budget deficits cause an increase in current account deficits. The link is believed to work as follows: higher deficits increase consumption, so imports expand and the trade deficit widens. However, both deficits actually have a common root: the increase in the money supply. When the Fed creates money ex nihilo to monetize the federal debt, it enables America to both borrow and consume more goods from abroad.
Regardless, in absolute terms, these old twin deficits were miniscule compared to the current one. As the chart below shows, the U.S. current account deficit (green line) has expanded significantly under Trump (despite all the trade wars!) and is approaching the historical record of $800 billion seen in 2006.
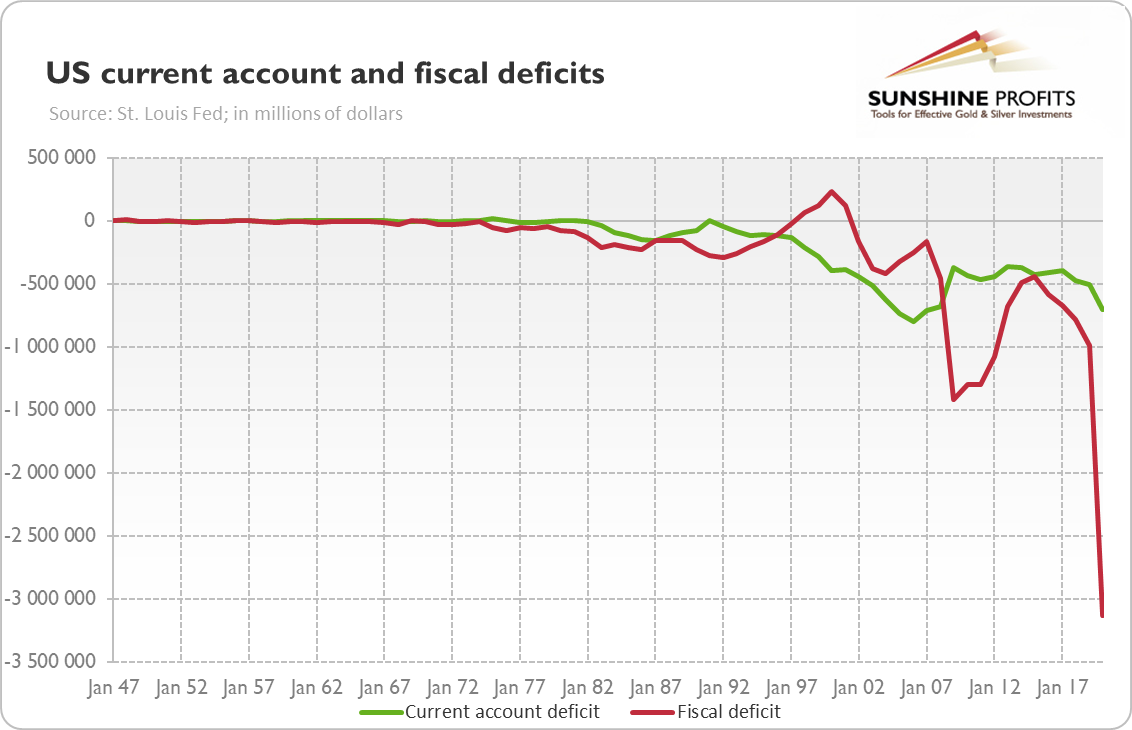
But what happened to the U.S. trade deficit is nothing compared to the fiscal deficit! As you can see in the chart above, it ballooned from $984 billion in fiscal year of 2019 to $3.1 trillion in 2020!
So, if we simply add these two deficits together, we will see that that the U.S. twin deficits have reached a record level. As the chart below shows, it has expended from $850 billion in 2014 to $3.8 trillion in 2020!
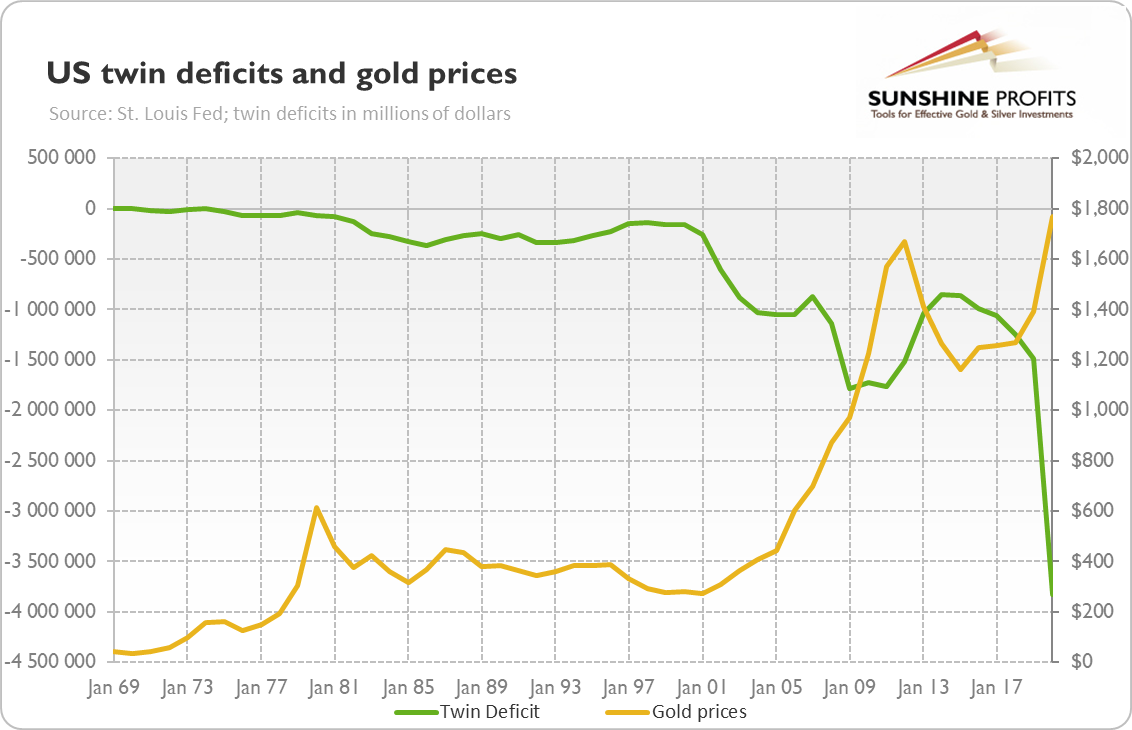
Now, the question is how the twin deficits could affect the price of gold. Well, from looking at the chart above, it’s hard to tell. Gold rallied in the 1970s, when the twin deficit was miniscule, while it entered a bear phase when the twin deficit started to increase. However, the yellow metal skyrocketed both in the 2000s and in the 2020s, when the twin deficit ballooned.
The key issue is what distinguishes the 1980s from the 2000s (and 2020)? I’ll tell you. In the former period, expansionary fiscal policy coincided with tight monetary policy. In consequence, the real interest rates increased, which encouraged capital inflows and strengthened the U.S. dollar. So, gold was melting.
Luckily for the yellow metal, this time, the easy fiscal policy is accompanied by the accommodative monetary policy. The Fed has already slashed the federal funds rate and it’s conducting quantitative easing to suppress the bond yields. Actually, some analysts believe that the U.S. central bank will implement the yield curve control to prevent any significant increases in the interest rates.
Hence, the combination of American monetary drunkenness and fiscal irresponsibility that largely contributed to the great expansion in the twin deficits should result in the weakening of the greenback. This, at least, is what we observed in the 2000s, as the chart below shows.
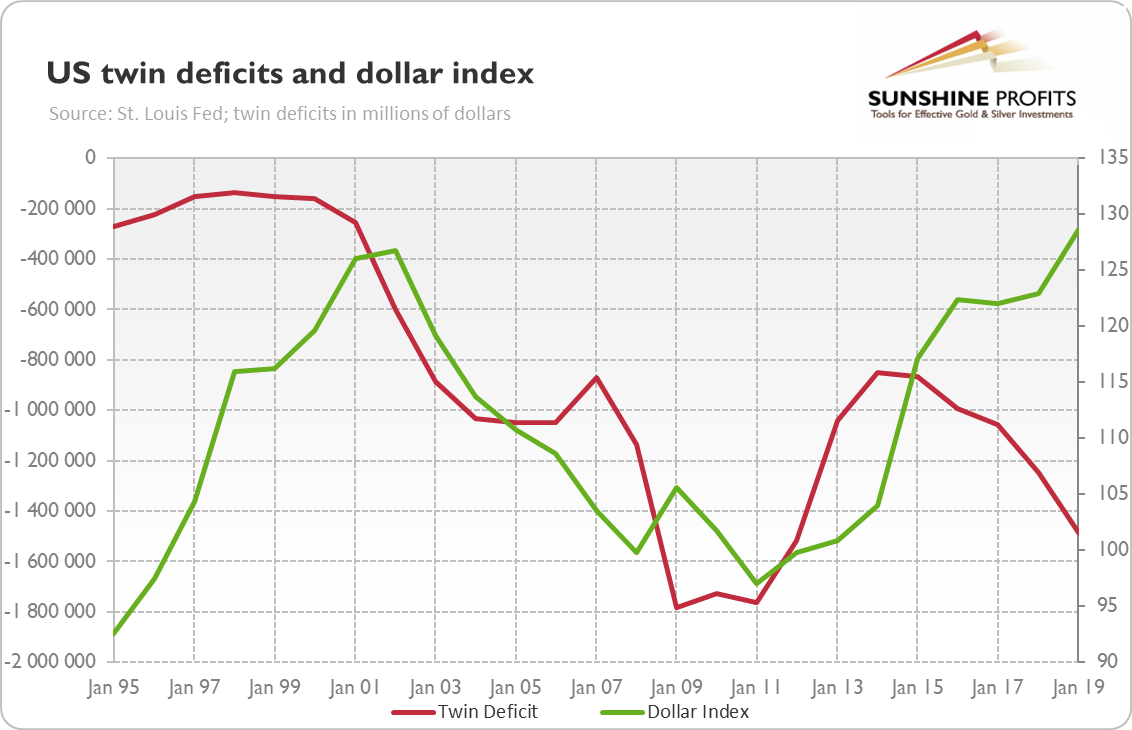
And this depreciation of the U.S. dollar should ultimately support gold prices, especially if we see reflation and the next commodity boom. It’s true that since its peak in August 2020, gold has been positively correlated with the greenback, but the inverse relationship can be restored one day. Investors shouldn’t forget that the dollar is not the only driver of gold prices – other factors also play a role. In the second half of the past year, both the real yields and the risk appetite increased, which outweighed the impact of the weakening dollar. Luckily, the Fed is ready to prevent any significant upward pressure on the Treasury yields coming from the twin deficits. That’s good for gold.
Thank you for reading today’s free analysis. If you enjoyed it, and would you like to know more about the links between the economic outlook, the current (past?) crisis and the gold market, we invite you to read the March Gold Market Overview report. Please note that in addition to the above-mentioned free fundamental gold reports, and we provide premium daily Gold & Silver Trading Alerts with clear buy and sell signals. We provide these premium analyses also on a weekly basis in the form of Gold Investment Updates. In order to enjoy our gold analyses in their full scope, we invite you to subscribe today. If you’re not ready to subscribe yet though and are not on our gold mailing list yet, we urge you to sign up. It’s free and if you don’t like it, you can easily unsubscribe. Sign up today!
Arkadiusz Sieron, PhD
Sunshine Profits: Effective Investment through Diligence & Care.-----
Disclaimer: Please note that the aim of the above analysis is to discuss the likely long-term impact of the featured phenomenon on the price of gold and this analysis does not indicate (nor does it aim to do so) whether gold is likely to move higher or lower in the short- or medium term. In order to determine the latter, many additional factors need to be considered (i.e. sentiment, chart patterns, cycles, indicators, ratios, self-similar patterns and more) and we are taking them into account (and discussing the short- and medium-term outlook) in our Gold & Silver Trading Alerts.
-
Is Dollar’s Weakness Giving Way to Gold?
March 12, 2021, 11:09 AMSince its peak in the spring of 2020, the U.S. dollar index has lost almost 12 percent, and it could decline even further, thus supporting gold prices.
There is a weakness in the U.S. dollar. Let’s start off by taking a look at the chart below. As you can see, the broad trade-weighted dollar index has been declining recently. Since its peak in late March 2020, the greenback has lost almost 12 percent.
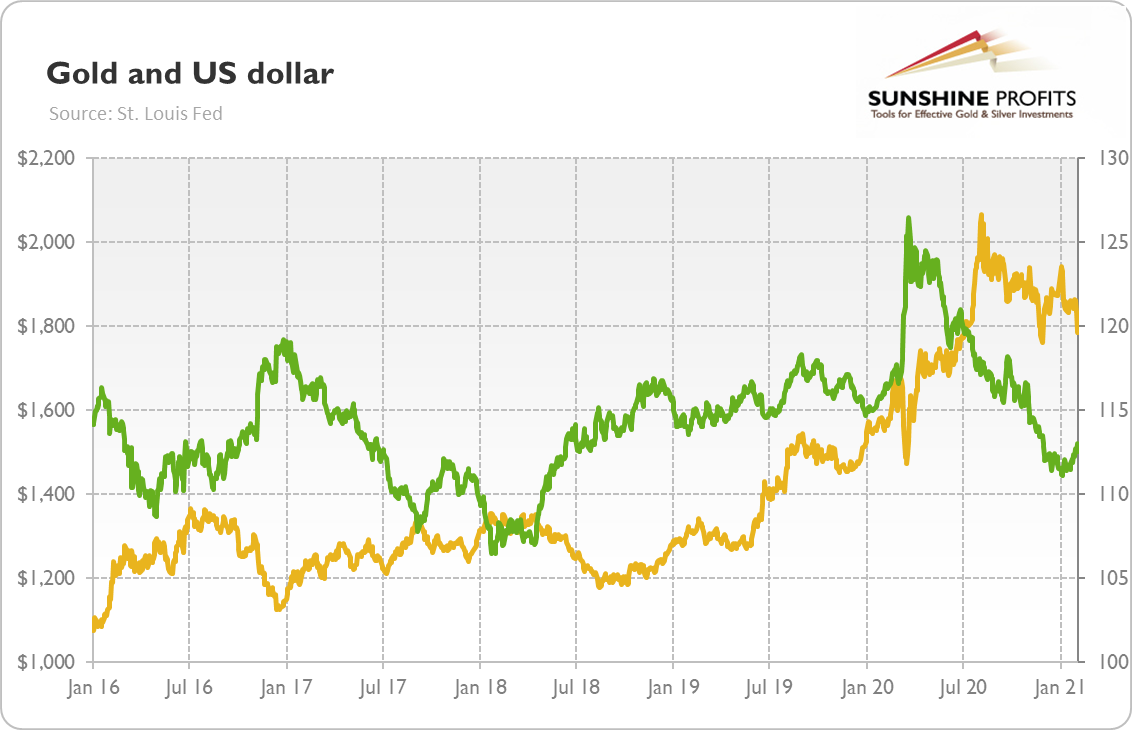
Not surprisingly, some analysts argue that the American currency has entered a multi-year bear market, with more declines on the horizon. Are they right? And what would that imply for gold?
Well, there are strong arguments for the bearish performance of the greenback. The confidence in the U.S. dollar is waning. To be clear, I don’t predict the collapse in the greenback anytime soon. I’ve been hearing the rumors about the dollar’s death for years – and they are often exaggerated. The truth is that the greenback remains the least ugly sister of the fiat currencies. And it’s dominance is overwhelming: the U.S. dollar’s share of currency reserves reported to the IMF was 60.4 percent in Q3 of 2020, while the share of the euro, the second most important reserve currency, was only 20.5 percent.
However, the share of the U.S. dollar has declined from 64.7 percent in the first quarter of 2017. It seems that Trump’s trade sanctions and ambiguous stance towards U.S. allies have pushed them to reduce their exposure to the American currency. No one wins trade and currency wars. In addition, in October 2020, the greenback ceased to be the world’s most used global payments currency, falling behind the euro for the first time since August 2013.
And the recent update to Tesla’s investment policy, which enables Musk’s firm to hold part of its cash holdings in cryptocurrencies and gold, is a clear sign the big companies are losing some confidence they previously had in the U.S. dollar. Indeed, sentiment is clearly bearish, as bets against the dollar have recently risen to nearly their highest level in a decade.
The negative sentiment may of course, be excessive, especially given the fact that the American economy would probably, as always, recover quicker than its European and Japanese peers. However, there are important headwinds against the buck. First of all, the Fed aggressively slashed interest rates and expanded its balance sheet, thus having its monetary policy resemble the ridiculously dovish stance of the ECB and the Bank of Japan. The U.S. central bank also become more tolerant toward higher inflation, so it’s going to leave the federal funds rate at or near zero for years.
Second, the Fed’s recent dovishness is accompanied with the expansion of the fiscal deficits. The explosion in the U.S. debt and in the broad money supply has significantly increased the supply of dollars, making their value decline. The lavish fiscal policy not only ballooned the public debt, but it also contributed to the large twin deficits, i.e., the simultaneous fiscal deficits and the nation’s current account deficits. As a reminder, the twin deficit that President Bush triggered in the 2000s reduced investors’ confidence in the American economy and its currency. Hence, it contributed to the bull market in gold.
And the same may occur this time. After all, a twin deficit means that more dollars are being printed and moved abroad. In contrast, the EU runs a huge current account surplus, so there is an inflow to the euro through foreign trade.
Third, with an economic recovery from the pandemic, the risk appetite has been increasing. Such a “risk on” environment has been historically negative for the greenback, as capital flows into more risky emerging markets.
So, the black clouds over the dollar should be fundamentally positive for gold prices, as the yellow metal is often negatively correlated with the greenback. This is an important difference between 2011 and 2020. As the chart below shows, the American currency bottomed out in the summer of 2011, starting its multi-year bull market.
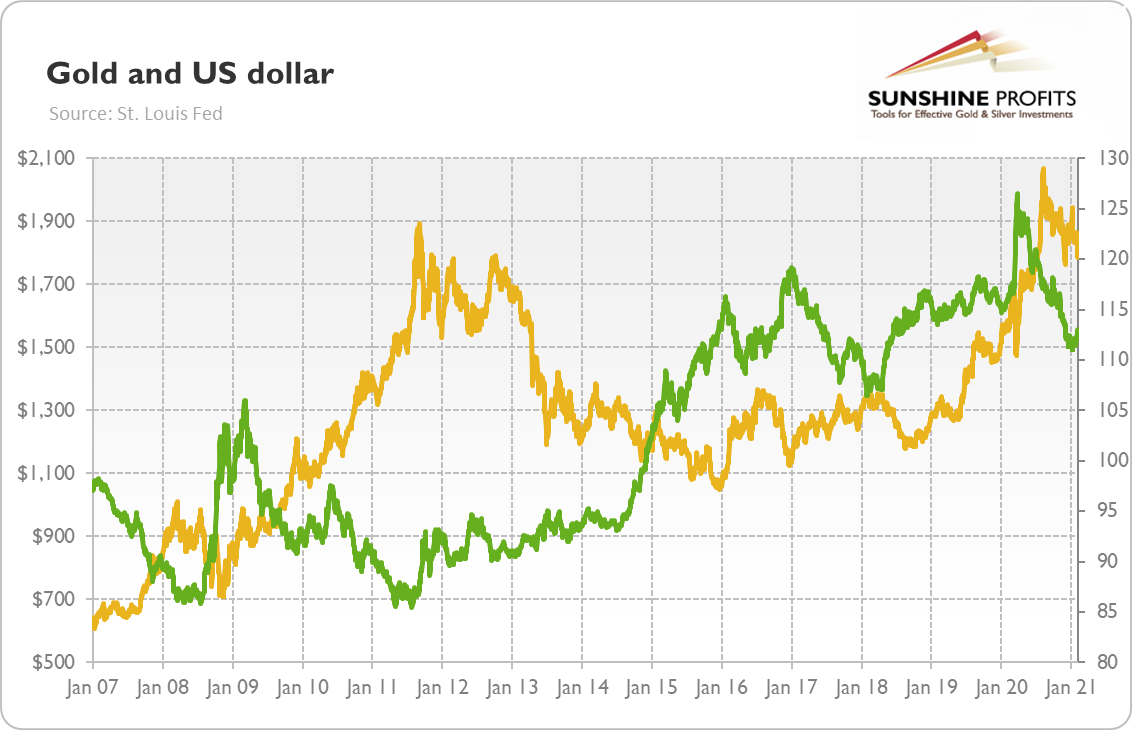
If this scenario replays, it would be, of course, bad for gold. But the above presented arguments show that the bull market in the U.S. dollar being similar to that of 2011-2020 is unlikely. And the euro doesn’t suffer from a similar crisis as it did in 2010-2012.
The bearish case for a dollar is also supported by the The Economist’s Big Mac Index, as only three currencies are now overvalued against the U.S. dollar, which suggests that there is more room for declines in the greenback’s value. Indeed, in 2009-2011, the American currency weakened more than 19 percent, while now it hasn’t weakened by even 12 percent! The continuation of the bear market in the U.S. dollar should be supportive for the yellow metal, especially if the weaker greenback will be accompanied by a slide in real interest rates.
Thank you for reading today’s free analysis. If you enjoyed it, and would you like to know more about the links between the economic outlook, the current (past?) crisis and the gold market, we invite you to read the March Gold Market Overview report. Please note that in addition to the above-mentioned free fundamental gold reports, and we provide premium daily Gold & Silver Trading Alerts with clear buy and sell signals. We provide these premium analyses also on a weekly basis in the form of Gold Investment Updates. In order to enjoy our gold analyses in their full scope, we invite you to subscribe today. If you’re not ready to subscribe yet though and are not on our gold mailing list yet, we urge you to sign up. It’s free and if you don’t like it, you can easily unsubscribe. Sign up today!
Arkadiusz Sieron, PhD
Sunshine Profits: Effective Investment through Diligence & Care.-----
Disclaimer: Please note that the aim of the above analysis is to discuss the likely long-term impact of the featured phenomenon on the price of gold and this analysis does not indicate (nor does it aim to do so) whether gold is likely to move higher or lower in the short- or medium term. In order to determine the latter, many additional factors need to be considered (i.e. sentiment, chart patterns, cycles, indicators, ratios, self-similar patterns and more) and we are taking them into account (and discussing the short- and medium-term outlook) in our Gold & Silver Trading Alerts.
-
Is Gold Now Replaying 2010-2012?
March 9, 2021, 8:37 AMThe 2019-2021 gold chart is disturbingly similar to that of 2010-2012, but it does not have to be the harbinger of a bear market.
Many ancient cultures saw history as cyclical. According to this view, society passes through repeated cycles. Can this apply to gold as well? I’m not referring here to the simple fact that we have both bull and bear markets in the precious metals – I refer here to the observation that gold’s price pattern seen in 2019-2021 mirrors that of 2010-2012. Please take a look at the chart below.
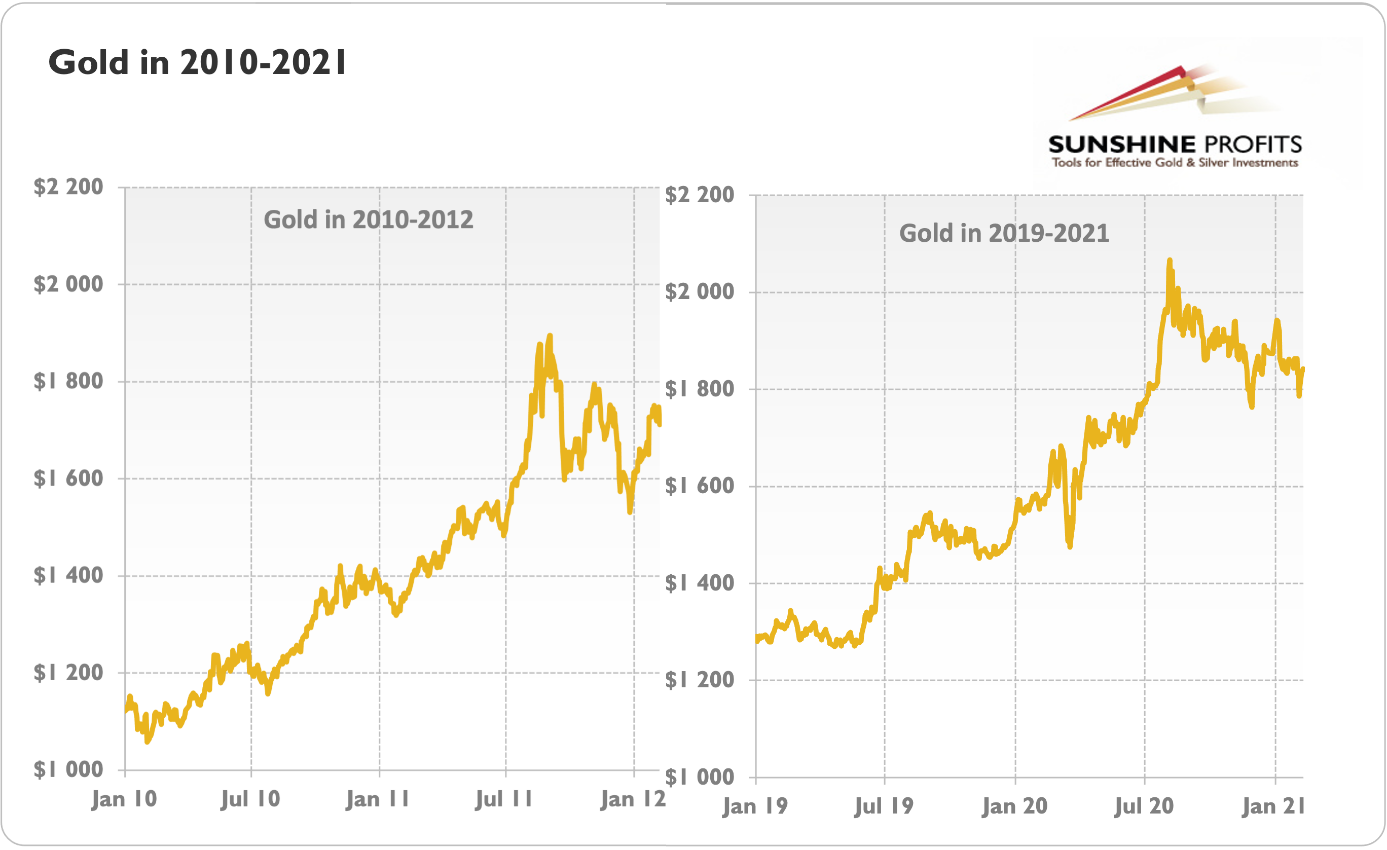
As you can see, in both periods, gold was steadily rising to a peak in the third quarter of the second year. A decade ago, the yellow metal gained 29 percent in 2010 and 74 percent as it hit the top. Then, it declined 19 percent by the end of 2011. Fast forward to more recent times. Gold gained 18.4 percent in 2019 and 62 percent at the peak. Afterwards, it declined 9 percent by the end of 2020.
So, although the magnitude has now been weaker than in the aftermath of the Great Recession, the pattern is quite similar. The next chart – which presents the normalized gold prices in both periods to indices (when the starting point equals 100) – nicely illustrates how gold in 2019-2021 closely resembles gold from 2010-2012.
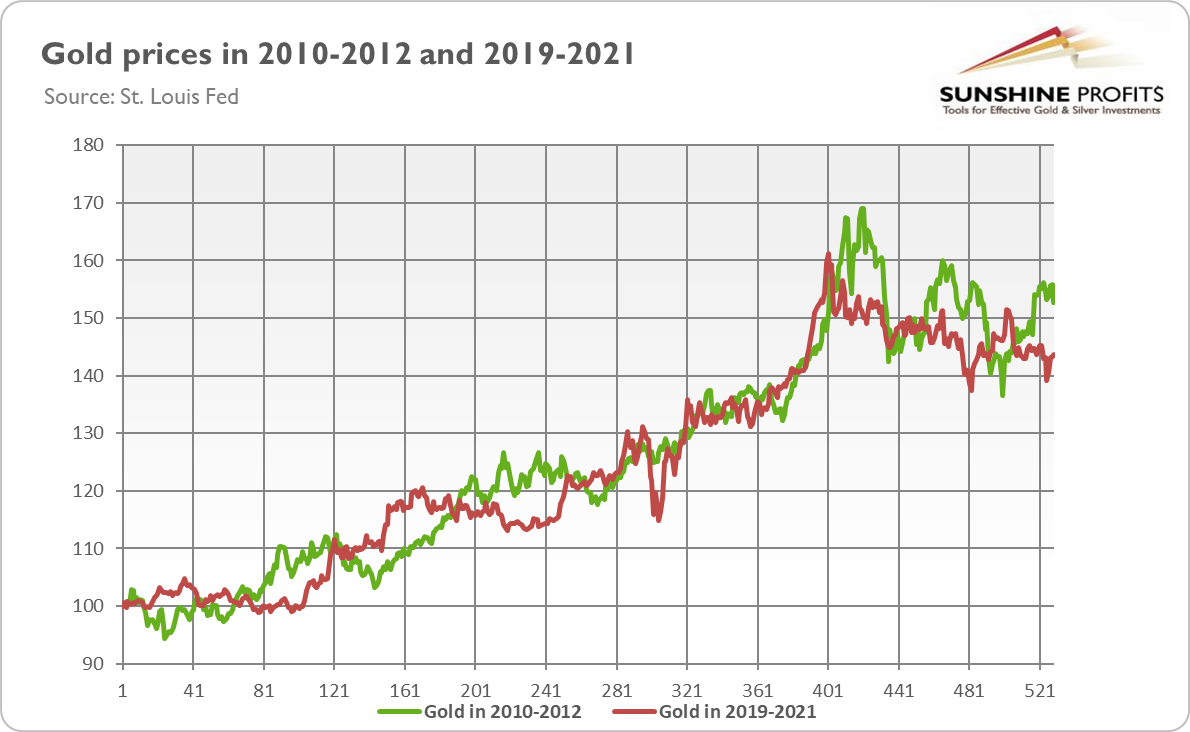
This similarity may be disturbing. Should the pattern hold, then gold could go down significantly and stay in a sideways trend for years. As a reminder, this is what happened a decade ago. Gold bulls fought until the end of 2012, when they gave up and the yellow metal entered a full bear market, plunging 45 percent from the top to the bottom in December 2015. Then, it stayed generally flat till the end of 2018. If this cycle replays, we could see the price of gold go below $1,200 by the end of 2024.
To be clear, there are some arguments to support the bearish case. Just as in the 2010s, the world is recovering now from the global economic crisis. The recession is over and the prospects are only better. Perhaps they’re not rosy, but they’re certainly better than many previously expected, which is what matters for the financial markets. As the worst is behind us, the risk appetite is returning, which could put gold and other safe-haven assets into oblivion. Actually, some could even argue that gold may now plunge even earlier, as a decade ago it was supported by the European sovereign debt crisis, which peaked in 2011-2012.
However, there are also important reasons why gold could break the pattern and diverge from the 2010-2012 trend. First, we now have a much more dovish Fed. The U.S. central bank slashed the federal funds rate much quicker and expanded its balance sheet more decisively. Additionally, to avoid a taper tantrum caused by its announcement about tapering asset purchases, this time the Fed will normalize its monetary policy in a very, very gradual way, if at all. It means that interest rates will stay lower for longer. Lastly, the U.S. central bank changed its monetary policy framework, i.e., it prioritized the labor market over price stability and became more tolerant to higher inflation.
Second, we also have a much easier fiscal policy. Even before the global pandemic, Trump significantly expanded budget deficits, but the Great Lockdown made them even larger. As pundits believe that the fiscal response in the aftermath of the global financial crisis of 2007-2009 was too small, they now want to go big – indeed, Biden’s $1.9 trillion economic plan is waiting to be passed by Congress.
Third, this recovery might be more inflationary than a decade ago. This is because not only did the monetary base increase, but the broad money supply did as well. Last time, the Fed injected a lot of liquidity to the banking sector to bailout the banks. Now, the money has flowed much more through Main Street and the household sector, which could turn out to be more inflationary when all this money will be spent on goods and services. Also, last time we observed some deleveraging in the private sector, while now the supply of loans is continuously increasing at a positive rate. We are also already observing reflation in the form of a commodity boom, so gold may follow suit.
To sum up, the patterns seen in the gold market in 2010-2012 and 2019-2021 are remarkably similar. So, the recent gold’s weakness may be really disturbing. However, this resemblance does not have to be a harbinger of further problems coming for gold bulls. After all, as Mark Twain is reputed to have said, “history doesn’t repeat itself, but it often rhymes”. Indeed, the macroeconomic and political environment is now clearly different than a decade ago – it’s more fundamentally positive for the price of gold.
Thank you for reading today’s free analysis. If you enjoyed it, and would you like to know more about the links between the economic outlook, the current (past?) crisis and the gold market, we invite you to read the March Gold Market Overview report. Please note that in addition to the above-mentioned free fundamental gold reports, and we provide premium daily Gold & Silver Trading Alerts with clear buy and sell signals. We provide these premium analyses also on a weekly basis in the form of Gold Investment Updates. In order to enjoy our gold analyses in their full scope, we invite you to subscribe today. If you’re not ready to subscribe yet though and are not on our gold mailing list yet, we urge you to sign up. It’s free and if you don’t like it, you can easily unsubscribe. Sign up today!
Arkadiusz Sieron, PhD
Sunshine Profits: Effective Investment through Diligence & Care.-----
Disclaimer: Please note that the aim of the above analysis is to discuss the likely long-term impact of the featured phenomenon on the price of gold and this analysis does not indicate (nor does it aim to do so) whether gold is likely to move higher or lower in the short- or medium term. In order to determine the latter, many additional factors need to be considered (i.e. sentiment, chart patterns, cycles, indicators, ratios, self-similar patterns and more) and we are taking them into account (and discussing the short- and medium-term outlook) in our Gold & Silver Trading Alerts.
-
Will There Be Roaring Twenties for Gold?
February 26, 2021, 10:40 AMThe 2020s might be less roaring than the 1920s, which seems like good news for gold.
The United States is strongly polarized, with blue versus red, liberals versus conservatives, and so on. People are divided along many lines, but the biggest division line is between those who count decades from 0 to 9 and those who count them from 1 to 10. It is intuitive for many people to adopt the first method, especially that we think of decades as ‘the 20s’, ‘the 30s’, and so on. However, the catch is that there was no Year Zero, so the first decade of the common era was years 1 to 10. Following this logic, the current decade started on January 1, 2021, not January 1, 2020.
So, I feel fully entitled to investigate how gold will behave in the new decade. The issue is especially interesting as some analysts claim that we are entering the Roaring Twenties 2.0. Are they correct?
On the surface, there are some similarities. The 1920s were a decade that followed the nightmare of World War I and the Spanish Flu pandemic. It was a time of quick economic growth (the U.S. GDP grew more than 40 percent in that period) and rapid technological innovation fueled predominantly by the rising access to electricity and big improvements in transportation (automobiles and planes).
Fast forward one century and we land in the 2020s, which is a decade following the nightmare of the coronavirus pandemic. There are hopes for an acceleration in technological progress driven mainly by the rising scope of remote work, digital solutions, cloud computing, artificial intelligence, Internet of Things, 5G networks, robotization, super-batteries, electric vehicles, and so on. And given the pent-up demand and months spent in lockdowns, consumers are ready to congregate and spend!
However, there are good reasons to be skeptical about the narrative of the Roaring Twenties 2.0. The era of post-war prosperity was fueled by the return to the normalcy in the sphere of economic policy. I refer here to the fact that after WWI, there was a successful transition from a wartime economy to a peacetime economy. In contrast, in the aftermath of the Great Recession, there is a gradual transition from the peacetime economy to a wartime economy, that was only accelerated during the epidemic and the Great Lockdown.
In particular, both the government spending and the fiscal deficits were sharply reduced in the post-war era. In consequence, the U.S. public debt declined, especially in real terms. Similarly, the Fed reversed its monetary policy and allowed for monetary contraction (and quick recession) in 1919-20 to reverse wartime inflation.
In other words, the tighter monetary and fiscal policies led to an environment of economic prosperity. Also helpful for the U.S. were developments such as trustbusting and an economic recovery in Germany after its hyperinflation – all developments that will not replay in the 2020s.
In contrast, neither the fiscal policy nor the monetary policy are going to normalize anytime soon, even if the COVID-19 pandemic is brought under control. The national debt has risen by almost $7.8 trillion under Trump’s presidency – a level that rivals Italy’s. The debt-to-GDP ratio has soared, as the chart below shows. And Joe Biden doesn’t worry about deficits – instead, with his plan of $1.9 trillion economic stimulus, he is going to balloon the public debt even further by increasing government spending.
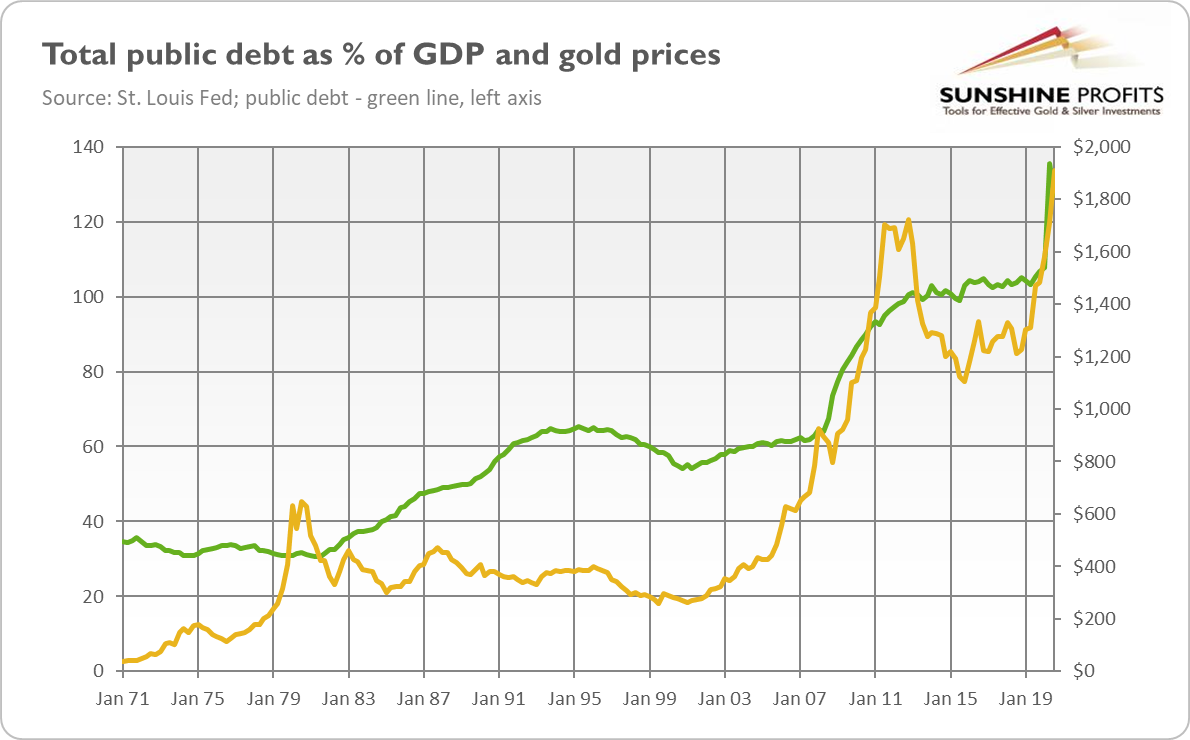
But maybe we shouldn’t worry about the debt? After all, after WW2, the public debt was even higher, but the economy didn’t collapse – actually, it grew so rapidly that the debt-to-GDP ratio diminished significantly. Yup, that’s correct, but after the pandemic, the economy will not recover as quickly as in the aftermath of WW2. Oh, and by the way, the economy grew its way out of debt only thanks to several years of high inflation.
Therefore, the current complacency and naïve belief in low-interest rates and debt-driven economic recovery makes the scenario of the Roaring Twenties 2.0 not very likely, despite all the fantastic technological progress we are observing. So, instead of acceleration, we could rather observe an economic slowdown due to the poor economic policy that hampers the expansion of the private sector. Indeed, the recent report by the World Bank warns about the lost decade: “If history is any guide, unless there are substantial and effective reforms, the global economy is heading for a decade of disappointing growth outcomes.” This is good news for the gold market.
But even if the Roaring Twenties 2.0 do happen, it wouldn’t have to be very bad for the yellow metal. It’s true that the 1920s was a period of wealth, prosperity, and decadence in which people didn’t think about preserving capital and investing in safe-haven assets such as gold. In contrast, there was a lot of risk-taking fueling the boom in the stock market. However, the Roaring Twenties were an inflationary period of debt-driven growth that ended in the systemic economic crisis called the Great Depression – and gold can shine in such an macroeconomic environment.
Thank you for reading today’s free analysis. If you enjoyed it, and would you like to know more about the links between the economic outlook, the current (past?) crisis and the gold market, we invite you to read the February Gold Market Overview report. Please note that in addition to the above-mentioned free fundamental gold reports, and we provide premium daily Gold & Silver Trading Alerts with clear buy and sell signals. We provide these premium analyses also on a weekly basis in the form of Gold Investment Updates. In order to enjoy our gold analyses in their full scope, we invite you to subscribe today. If you’re not ready to subscribe yet though and are not on our gold mailing list yet, we urge you to sign up. It’s free and if you don’t like it, you can easily unsubscribe. Sign up today!
Arkadiusz Sieron, PhD
Sunshine Profits: Effective Investment through Diligence & Care.-----
Disclaimer: Please note that the aim of the above analysis is to discuss the likely long-term impact of the featured phenomenon on the price of gold and this analysis does not indicate (nor does it aim to do so) whether gold is likely to move higher or lower in the short- or medium term. In order to determine the latter, many additional factors need to be considered (i.e. sentiment, chart patterns, cycles, indicators, ratios, self-similar patterns and more) and we are taking them into account (and discussing the short- and medium-term outlook) in our Gold & Silver Trading Alerts.
-
Will Biden Overheat the Economy and Gold?
February 19, 2021, 6:47 AMUnder the Biden administration the economy could overheat, thereby increasing inflation and the price of gold.
In January, Biden unveiled his plan for stimulating the economy, which is struggling as the epidemic in the U.S. continues to unfold. Pundits welcomed the bold proposal of spending almost $2 trillion. Some expenditures, especially on vaccines and healthcare, sound pretty reasonable. However, $1.9 trillion is a lot of money! And a lot of federal debt, as the stimulus would be debt-funded!
So, there is a risk that Biden’s package would overheat the economy and increase inflation. Surprisingly, even some mainstream economists who support the deficit spending, notice this possibility. For instance, former Treasury Secretary Larry Summers, said that Biden’s stimulus could lead the economy to overheat, and that the conventional wisdom is underestimating the risks of hitting capacity. Although he doesn’t oppose the idea of another stimulus, Summers noted that “if we get Covid behind us, we will have an economy that is on fire”.
Indeed, this is a real possibility for good reasons. First, the proposed package would not only be large in absolute terms (the nominal amount), but also relative to the GDP. According to The Economist, Biden’s proposal is worth about nine percent of pre-crisis GDP, nearly twice the size of Obama’s aid package in the aftermath of the Great Recession.
And the stimulus is also large relative to the likely shortfall in the aggregate demand. I’m referring here to the fact that the winter wave of the coronavirus would be less harmful for the economy – and that there have already been big economic stimuli added last year, including a $900 billion package passed no earlier than in December.
Oh yes, politicians were really spendthrift in 2020, and – without counting the aid passed in December – they injected into the economy almost $3 trillion, or about 14 percent of pre-crisis GDP, much more than the decline in the aggregate demand. In other words, the policymakers added to the economy more money that was destroyed by the pandemic.
But the tricky part is that Americans simply piled up most of this cash in bank accounts, or they used it for trading, for instance. Given the social-distancing measures and limited possibilities to spend money, this outcome shouldn’t actually be surprising. However, the hoarding of stimulus shows that it has not yet started to affect the economy – but that can change when the economy fully reopens and people unleash the hoarded money. If all this cash finally reaches the markets, prices should go up.
You see, the current economic downturn is unusual. It doesn’t result from the fact that Americans don’t have enough income and cannot finance their expenditures. The problem is rather that people cannot spend it even if they wanted to. Indeed, economic disruption and subdued consumer spending are concentrated in certain sectors that are most sensitive to social distancing – such as the leisure, transport and hospitality industries – rather than spread widely throughout the whole economy. So, when people will finally be able to spend, they will probably do so, possibly accelerating inflation.
As well, normally the Fed would tighten its monetary policy to prevent the rise in prices. But now the U.S. central bank wants to overshoot its inflation target, so it would not hike interest rates only because inflation raises to two percent or even moderately above it.
Another potential inflationary driver is dollar depreciation, which seems likely, given the zero-interest rates policy and the expansion in the U.S. twin deficit.
Hence, without the central bank neutralizing the fiscal exuberance, it’s possible that Biden’s plan would overheat the economy, at least temporarily. Of course, that’s not certain and given the small Democrats’ majority in Congress, the final stimulus could be lower than the proposed $1.9 trillion. But it would remain large and on top of previous aid packages and pent-up demand, which makes the overheating scenario quite likely.
Actually, investors have already started to expect higher inflation in the future – as the chart below shows, the inflationary expectations have already surpassed pre-pandemic levels.
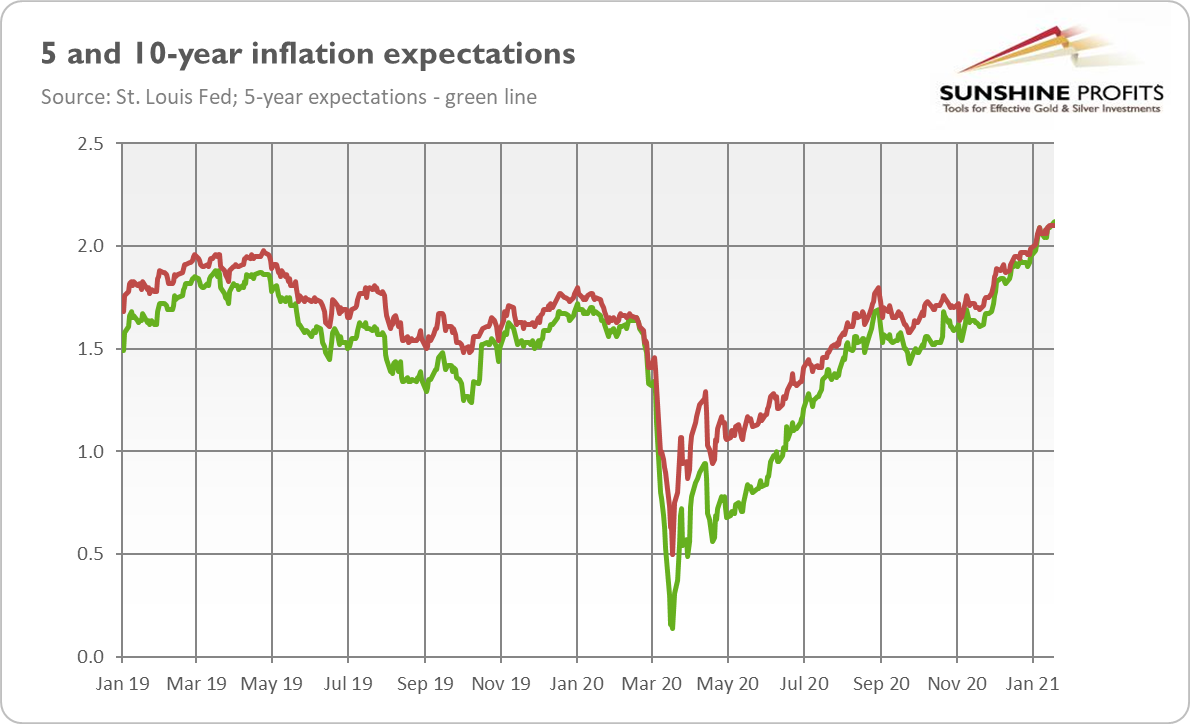
From the fundamental perspective, this is good news for the gold market. After all, gold is bought by some investors as an inflation hedge. Moreover, the acceleration of inflation would lower real interest rates, keeping them deeply in negative territory, which would also be positive for the yellow metal.
So, although the expectations of higher fiscal stimulus plunged gold prices in January, more government spending – and expansion in budget deficits and public debt – could ultimately turn out to be supportive factors for gold. Especially if easy fiscal policy will be accompanied by the accommodative monetary policy – in particular quantitative easing and a rising Fed’s balance sheet – and inflation.
Thank you for reading today’s free analysis. If you enjoyed it, and would you like to know more about the links between the economic outlook, the current (past?) crisis and the gold market, we invite you to read the February Gold Market Overview report. Please note that in addition to the above-mentioned free fundamental gold reports, and we provide premium daily Gold & Silver Trading Alerts with clear buy and sell signals. We provide these premium analyses also on a weekly basis in the form of Gold Investment Updates. In order to enjoy our gold analyses in their full scope, we invite you to subscribe today. If you’re not ready to subscribe yet though and are not on our gold mailing list yet, we urge you to sign up. It’s free and if you don’t like it, you can easily unsubscribe. Sign up today!
Arkadiusz Sieron, PhD
Sunshine Profits: Effective Investment through Diligence & Care.-----
Disclaimer: Please note that the aim of the above analysis is to discuss the likely long-term impact of the featured phenomenon on the price of gold and this analysis does not indicate (nor does it aim to do so) whether gold is likely to move higher or lower in the short- or medium term. In order to determine the latter, many additional factors need to be considered (i.e. sentiment, chart patterns, cycles, indicators, ratios, self-similar patterns and more) and we are taking them into account (and discussing the short- and medium-term outlook) in our Gold & Silver Trading Alerts.


Gold Market
Free Newsletter
with details not available
to 99% investors
+ 7 days of Gold Alerts
Gold Alerts
More-
Status
New 2024 Lows in Miners, New Highs in The USD Index
January 17, 2024, 12:19 PM -
Status
Soaring USD is SO Unsurprising – And SO Full of Implications
January 16, 2024, 8:40 AM -
Status
Rare Opportunity in Rare Earth Minerals?
January 15, 2024, 2:06 PM

