
tools spotlight

-
Fed’s Tightening Cycle: Bullish or Bearish for Gold?
March 4, 2022, 9:36 AMThis month, the Fed is expected to hike interest rates. Contrary to popular belief, the tightening doesn't have to be adverse for gold. What does history show?
March 2022 – the Fed is supposed to end its quantitative easing and hike the federal funds rate for the first time during recovery from a pandemic crisis . After the liftoff, the Fed will probably also start reducing the size of its mammoth balance sheet and raise interest rates a few more times. Thus, the tightening of monetary policy is slowly becoming a reality. The golden question is: how will the yellow metal behave under these conditions?
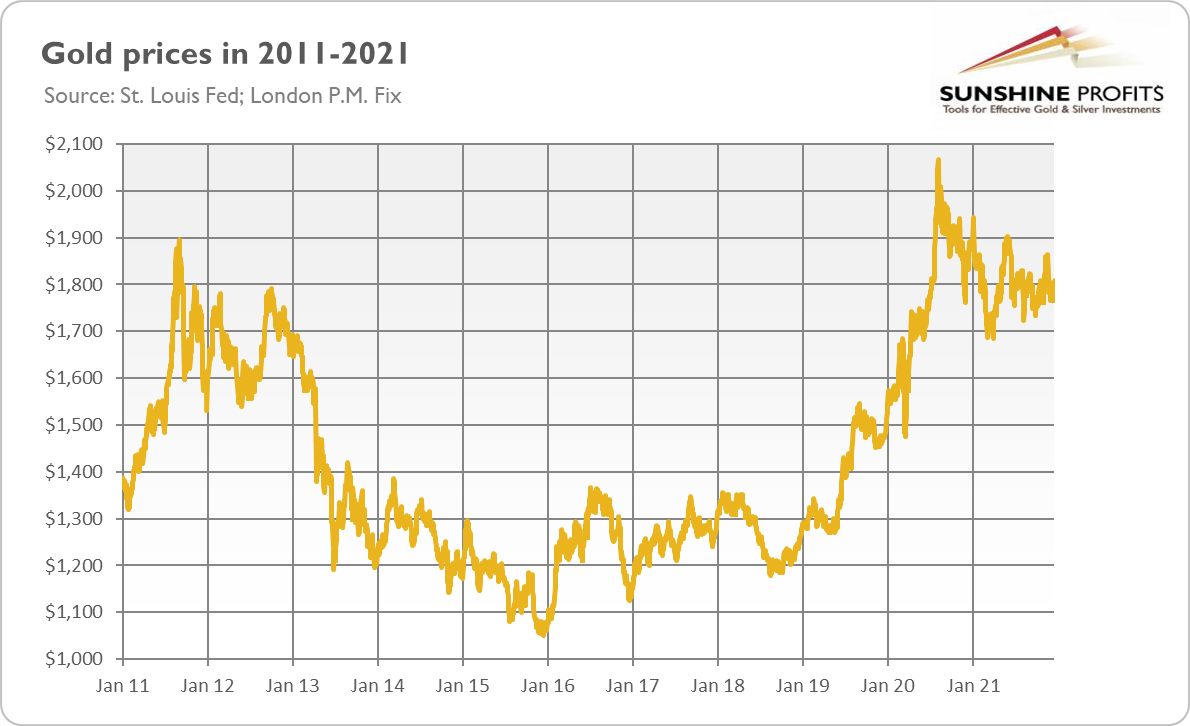
Let’s look into the past. The last tightening cycle of 2015-2019 was rather positive for gold prices. The yellow metal rallied in this period from $1,068 to $1,320 (I refer here to monthly averages), gaining about 24%, as the chart below shows.
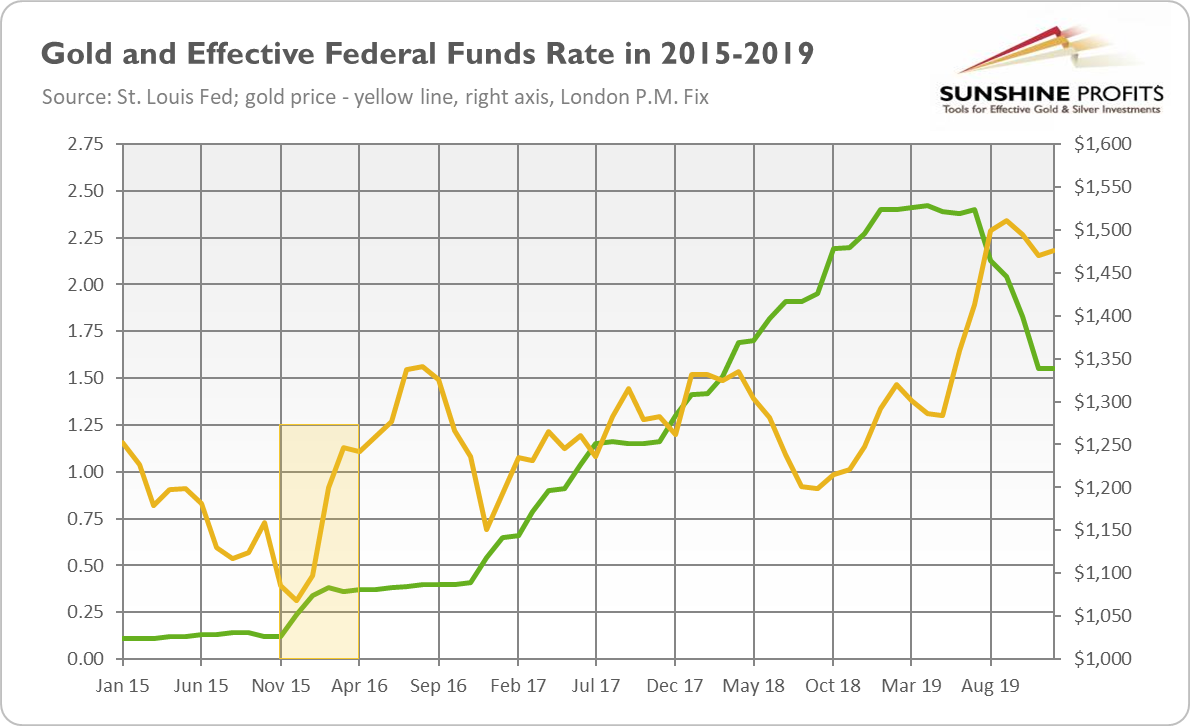
What’s really important is that gold bottomed out in December 2015, the month of the liftoff. Hence, if we see a replay of this episode, gold should detach from $1,800 and go north, into the heavenly land of bulls. However, in December 2015, real interest rates peaked, while in January 2016, the US dollar found its local top. These factors helped to catapult gold prices a few years ago, but they don’t have to reappear this time.
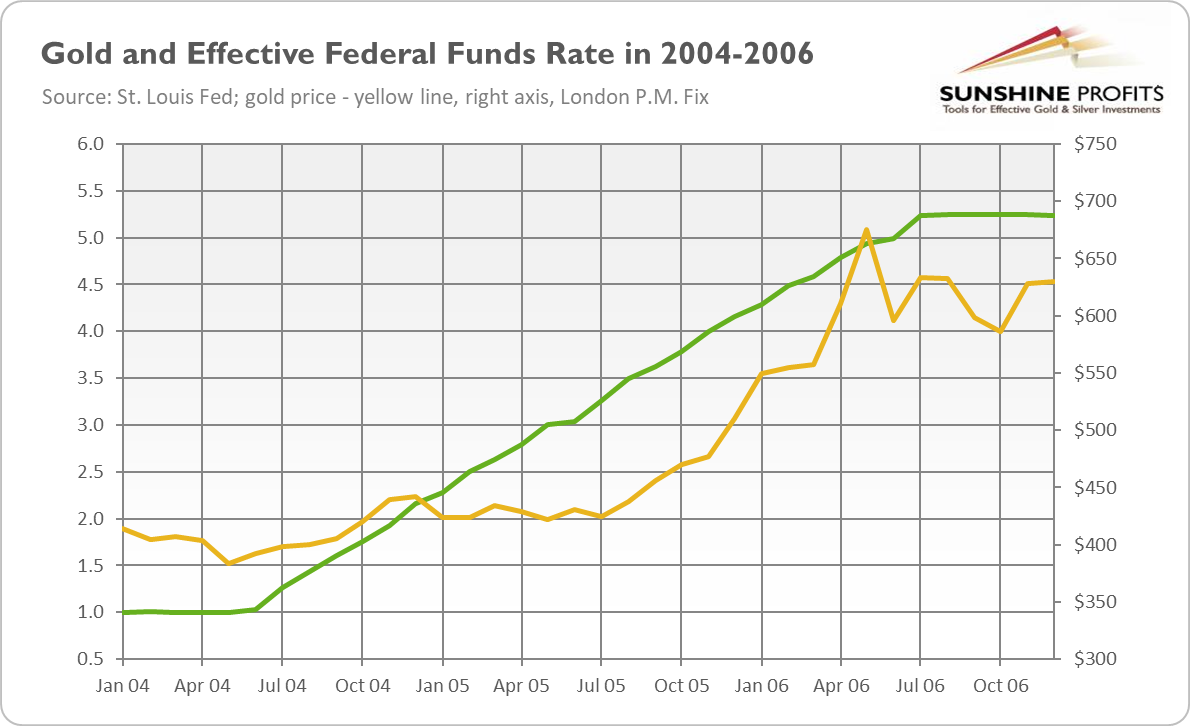
Let’s dig a bit deeper. The earlier tightening cycle occurred between 2004 and 2006, and it was also a great time for gold, despite the fact that the Fed raised interest rates by more than 400 basis points, something unthinkable today. As the chart below shows, the price of the yellow metal (monthly average) soared from $392 to $634, or more than 60%. Just as today, inflation was rising back then, but it was also a time of great weakness in the greenback, a factor that is currently absent.
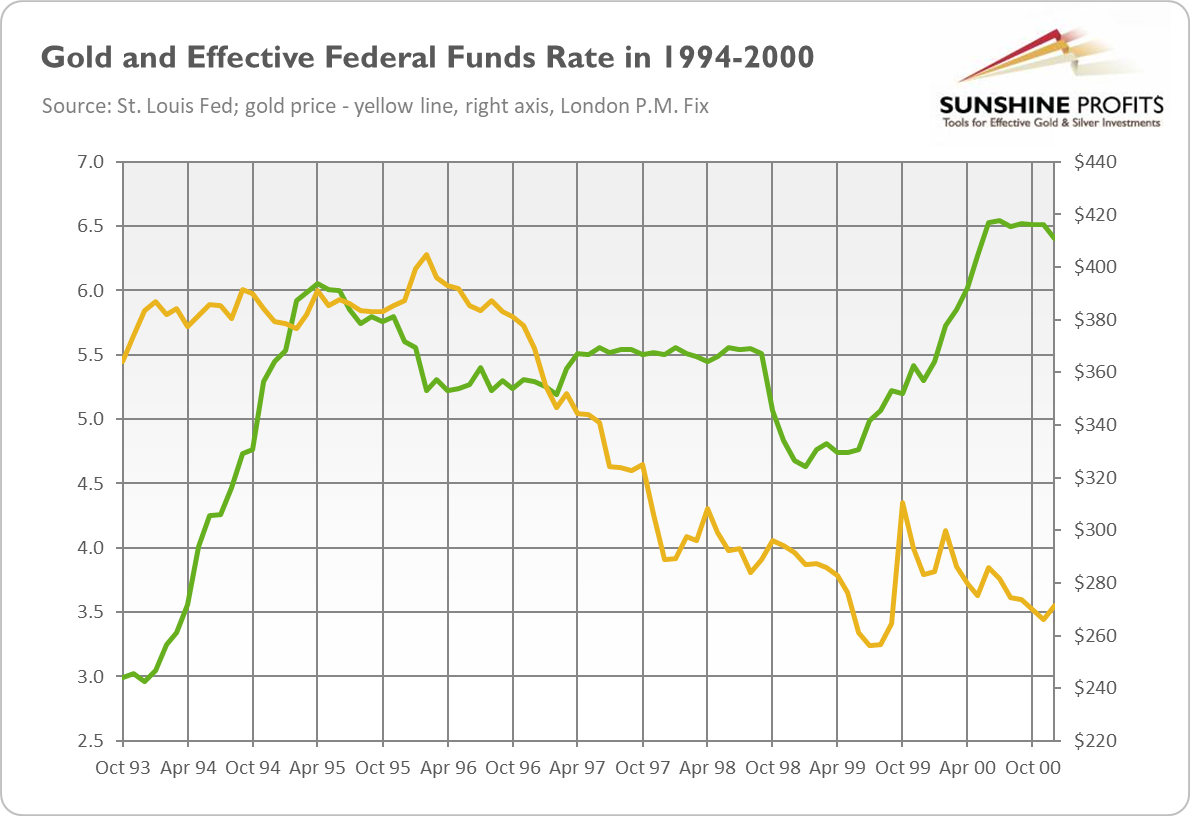
Let’s move even further back into the past. The Fed also raised the federal funds rate in the 1994-1995 and 1999-2000 periods. The chart below shows that these cases were rather neutral for gold prices. In the former, gold was traded sideways, while in the latter, it plunged, rallied, and returned to a decline. Importantly, just as in 2015, the yellow metal bottomed out soon after the liftoff in early 1999.
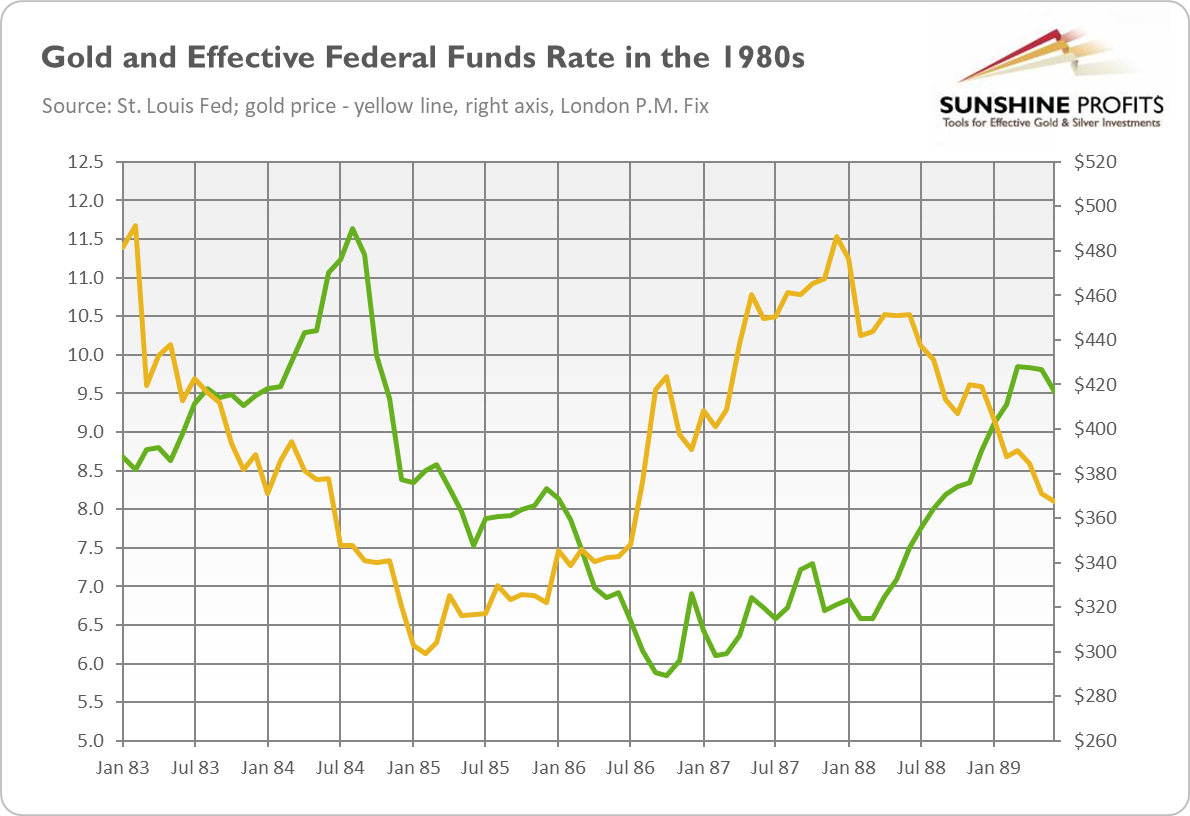
In the 1980s, there were two major tightening cycles – both clearly negative for the yellow metal. In 1983-1984, the price of gold plunged 29% from $491 to $348, despite rising inflation, while in 1988-1989, it dropped another 12%, as you can see in the chart below.
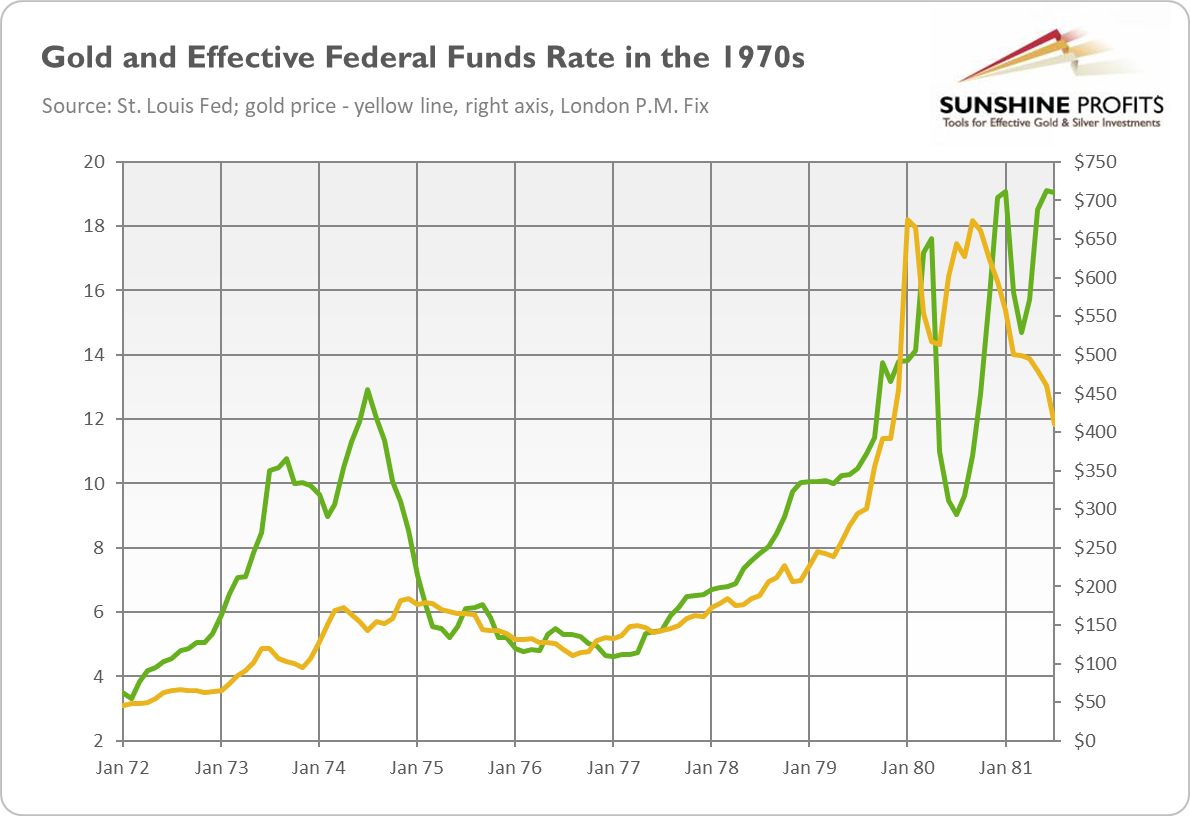
Finally, we have traveled back in time to the Great Stagflation period! In the 1970s, the Fed’s tightening cycles were generally positive for gold, as the chart below shows. In the period from 1972 to 1974, the average monthly price of the yellow metal soared from $48 to $172, or 257%. The tightening of 1977-1980 was an even better episode for gold. Its price skyrocketed from $132 to $675, or 411%. However, monetary tightening in 1980-1981 proved not very favorable , with the yellow metal plunging then to $409.
What are the implications of our historical analysis for the gold market in 2022? First, the Fed’s tightening cycle doesn’t have to be bad for gold. In this report, I’ve examined nine tightening cycles – of which four were bullish, two were neutral, and three were bearish for the gold market. Second, all the negative cases occurred in the 1980s, while the two most recent cycles from the 21st century were positive for gold prices. It bodes well for the 2022 tightening cycle.
Third, the key is, as always, the broader macroeconomic context – namely, what is happening with the US dollar, inflation, and real interest rates. For example, in the 1970s, the Fed was hiking rates amid soaring inflation. However, in March 1980, the CPI annul rate peaked, and a long era of disinflation started. This is why tightening cycles were generally positive in the 1970s, and negative in the 1980s.
Hence, it seems on the surface that the current tightening should be bullish for gold, as it is accompanied by high inflation. However, inflation is expected to peak this year. If this happens, real interest rates could increase even further, creating downward pressure on gold prices. Please remember that the real federal funds rate is at a record low level. If inflation peaks, gold bulls’ only hope will be either a bearish trend in the US dollar (amid global recovery and ECB’s monetary policy tightening) or a dovish shift in market expectations about the path of the interest rates, given that the Fed’s tightening cycle has historically been followed by an economic slowdown or recession.
Thank you for reading today’s free analysis. If you enjoyed it, and would you like to know more about the links between the economic outlook, and the gold market, we invite you to read the March Gold Market Overview report. Please note that in addition to the above-mentioned free fundamental gold reports, and we provide premium daily Gold & Silver Trading Alerts with clear buy and sell signals. We provide these premium analyses also on a weekly basis in the form of Gold Investment Updates. In order to enjoy our gold analyses in their full scope, we invite you to subscribe today. If you’re not ready to subscribe yet though and are not on our gold mailing list yet, we urge you to sign up. It’s free and if you don’t like it, you can easily unsubscribe. Sign up today!
Arkadiusz Sieron, PhD
Sunshine Profits: Effective Investment through Diligence & Care.-----
Disclaimer: Please note that the aim of the above analysis is to discuss the likely long-term impact of the featured phenomenon on the price of gold and this analysis does not indicate (nor does it aim to do so) whether gold is likely to move higher or lower in the short- or medium term. In order to determine the latter, many additional factors need to be considered (i.e. sentiment, chart patterns, cycles, indicators, ratios, self-similar patterns and more) and we are taking them into account (and discussing the short- and medium-term outlook) in our Gold & Silver Trading Alerts.
-
Should We Prepare For the Worst and Buy Some Gold?
February 25, 2022, 8:22 AMAs the COVID-19 pandemic has shown, it is worth being better prepared for a possible crisis. Does that mean it pays to have some gold up your sleeve?
I have to confess something. I always laughed at preppers (aka survivalists) – people who spend their entire lives stockpiling beans and ammo in preparation for the highly unlikely doomsday scenarios. C’mon, who would take these freaks seriously? Well, as the pandemic and supply crisis showed us, we all should.
When most people scrambled for masks and hand sanitizers, preppers laughed. When most people fought epic battles for toilet paper and something to eat to survive the Great Lockdown, preppers laughed. When most people were confronted with surging inflation and supply shortages of different products, preppers laughed. When most people panicked upon hearing about energy blackouts, preppers laughed. It seems that mocked preppers got the last laugh, after all.
Hence, the COVID-19 epidemic made it clear that the world is not a paradise flowing with milk and honey and that bad things do really happen, so we should be more prepared for possible calamities, even if they look like remote possibilities. For example, experts now point out the threat of cyberattacks, and just last month, Kazakhstan’s government turned off the internet nationwide, depriving its citizens of access to their bank accounts.
The problem is, of course, that crises always seem highly unlikely until they occur. Meanwhile, historical cases are too distant and abstract for us, and we tend to think that “this time is different”, or that “we’ll make it through somehow.” Perhaps you will, but it’s much easier when you are prepared. When other people panic, you don’t, because you have made your preparation and have a clear plan of action.
You see, the issue is not if the crisis hits, but when. It’s just a matter of time, even the government suggests storing at least a several-day supply of non-perishable food. However, the problem is that when things are going well, people don’t think about preparing. Why should we worry and spoil the fun? Let’s drink like tomorrow never comes! Maybe the problem will somehow disappear by itself, and if it doesn’t, we’ll deal with it later.
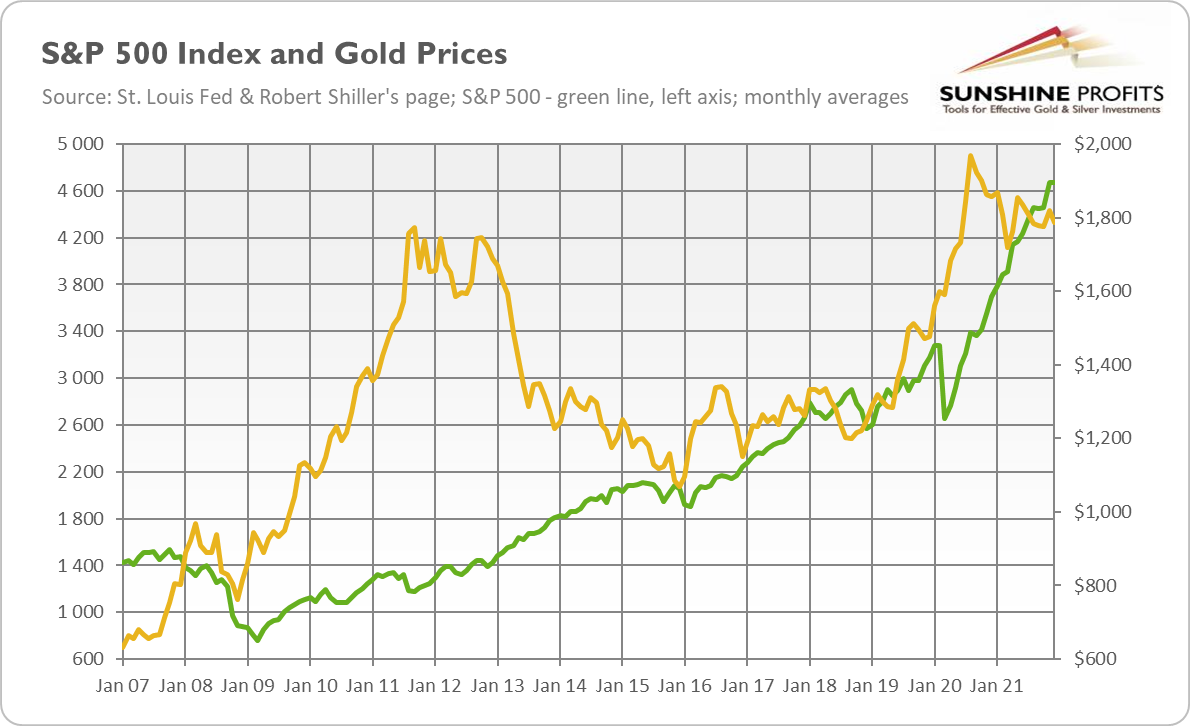
I got it, but how does it all relate to gold? Well, quite simply. Owning gold is a part of preparing for the worst. This is because gold is the store of value that appreciates when confidence in fiat money declines. It’s also a safe-haven asset, which shines during financial crises when asset prices generally decline. The best example may be the Great Recession or 2020 economic crisis when gold performed much better than the S&P 500 Index, as the chart below shows.
You can also think of gold as a portfolio insurance policy or a hedge against tail risks. A house fire is not very likely, but it’s generally smart to have insurance, you know, just in case. Similarly, the collapse of the financial markets and the great plunge of asset prices are not of great probability (although the Great Depression, late 2008, and early 2020 show that they are clearly possible), but it’s nice to have a portfolio diversifier that is not afraid of black swans.

In a sense, the whole issue boils down to individual responsibility. Do you take responsibility for your life and for being prepared for different scenarios, or do you count on other people, the government, or simply luck, magically thinking that everything always goes well? To be clear, being prepared doesn’t equal being pessimistic – it’s rather about being realistic and hoping for the best, but planning for the worst.
However, there are two important caveats to consider before exchanging all of your paper currency for gold coins. First, you shouldn’t conflate holding gold as insurance with gold as an investment asset. When you want protection, you’re not interested in price trends. There might be a bear market, but gold would still fulfill its hedging role. This is also why you shouldn’t own more than about 5-10% of your whole portfolio in precious metals (as insurance, you can invest more in gold as an investment or as a part of your trading strategy).
Second, don’t treat gold as a panacea for all possible disasters. It all depends on what you are preparing for. If you expect power outages, buy batteries, power banks, and think about alternate sources of energy. Precious metals won’t power your home. If you fear a zombie apocalypse (who doesn’t?), flamethrowers and rifles seem to be better weapons than gold bars (although large ones can serve quite well). If you can’t wait for a nuclear explosion (who can?), you will need a proper shelter with uncontaminated food rather than shiny metal (pun intended). It’s possible that in such a post-apocalyptic world, people would initially return to a commodity-based standard rather than the gold standard. It all depends on the particular conditions and how deeply the civilization would devolve.
Hence, don’t be scared by dodgy people and false advertising into buying gold because of imminent hyperinflation, the total collapse of the financial system, nuclear greetings from Kim Jong-Un, or another calamity. The role of gold is not to rescue you from all kinds of troubles, but to be insurance that pays off during economic crises.
Thank you for reading today’s free analysis. If you enjoyed it, and would you like to know more about the links between the economic outlook, and the gold market, we invite you to read the February Gold Market Overview report. Please note that in addition to the above-mentioned free fundamental gold reports, and we provide premium daily Gold & Silver Trading Alerts with clear buy and sell signals. We provide these premium analyses also on a weekly basis in the form of Gold Investment Updates. In order to enjoy our gold analyses in their full scope, we invite you to subscribe today. If you’re not ready to subscribe yet though and are not on our gold mailing list yet, we urge you to sign up. It’s free and if you don’t like it, you can easily unsubscribe. Sign up today!
Arkadiusz Sieron, PhD
Sunshine Profits: Effective Investment through Diligence & Care.-----
Disclaimer: Please note that the aim of the above analysis is to discuss the likely long-term impact of the featured phenomenon on the price of gold and this analysis does not indicate (nor does it aim to do so) whether gold is likely to move higher or lower in the short- or medium term. In order to determine the latter, many additional factors need to be considered (i.e. sentiment, chart patterns, cycles, indicators, ratios, self-similar patterns and more) and we are taking them into account (and discussing the short- and medium-term outlook) in our Gold & Silver Trading Alerts.
-
Inflation Peak – High Risk or Opportunity for Gold?
February 18, 2022, 9:38 AMNot only won’t inflation end soon, it’s likely to remain high. Whether gold will be able to take advantage of it will depend, among others, on the Fed.
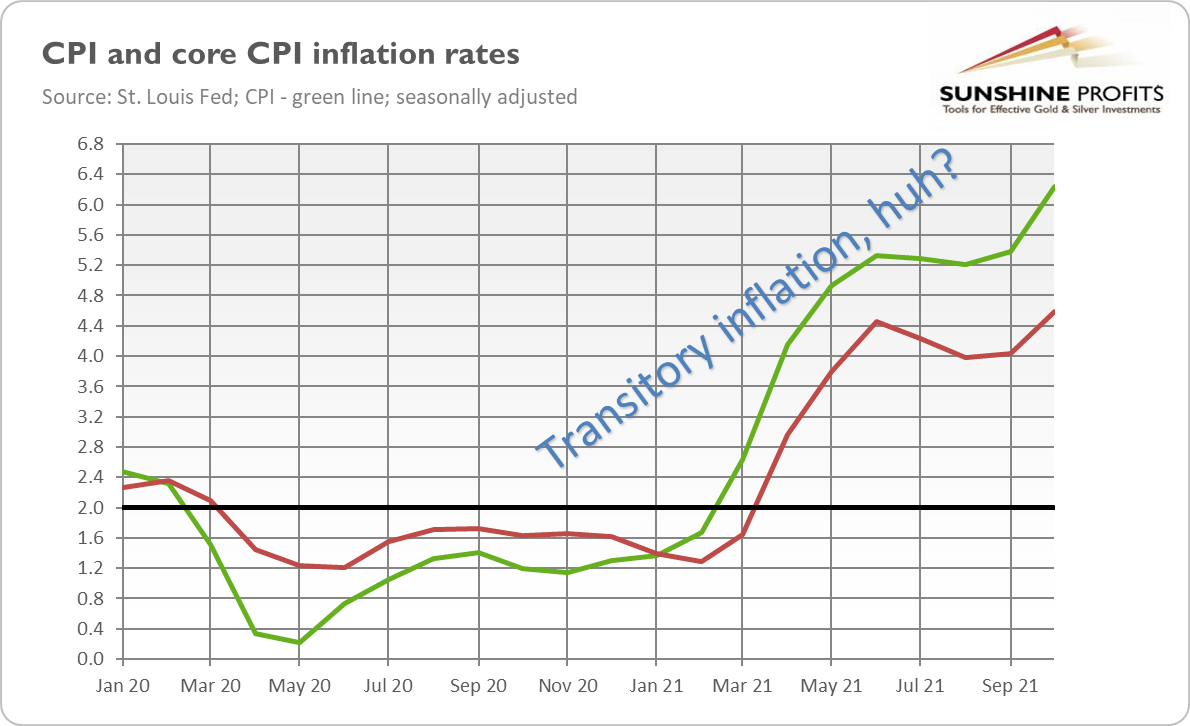
Do you sometimes ask yourself when this will all end? I don’t mean the universe, nor our lives, nor even this year (c’mon, guys, it has just started!). I mean, of course, inflation. If only you weren’t in a coma last year, you would have probably noticed that prices had been surging recently. For instance, America finished the year with a shocking CPI annual rate of 7.1%, the highest since June 1982, as the chart below shows.
Now, the key question is how much higher inflation could rise, or how persistent it could be. The consensus is that we will see a peak this year and subsequent cooling down, but to still elevated levels. This is the view I also hold. However, would I bet my collection of precious metals on it? I don’t know, as inflation could surprise us again, just as it did to most of the economists (but not me) last year. The risk is clearly to the upside.
As always in economics, it’s a matter of supply and demand. There is even a joke that all you need to turn a parrot into an economist is to teach it to say ‘supply’ and ‘demand’. Funny, huh? When it comes to the demand side, both the money supply growth and the evolution of personal saving rate implies some cooling down of inflation rate.
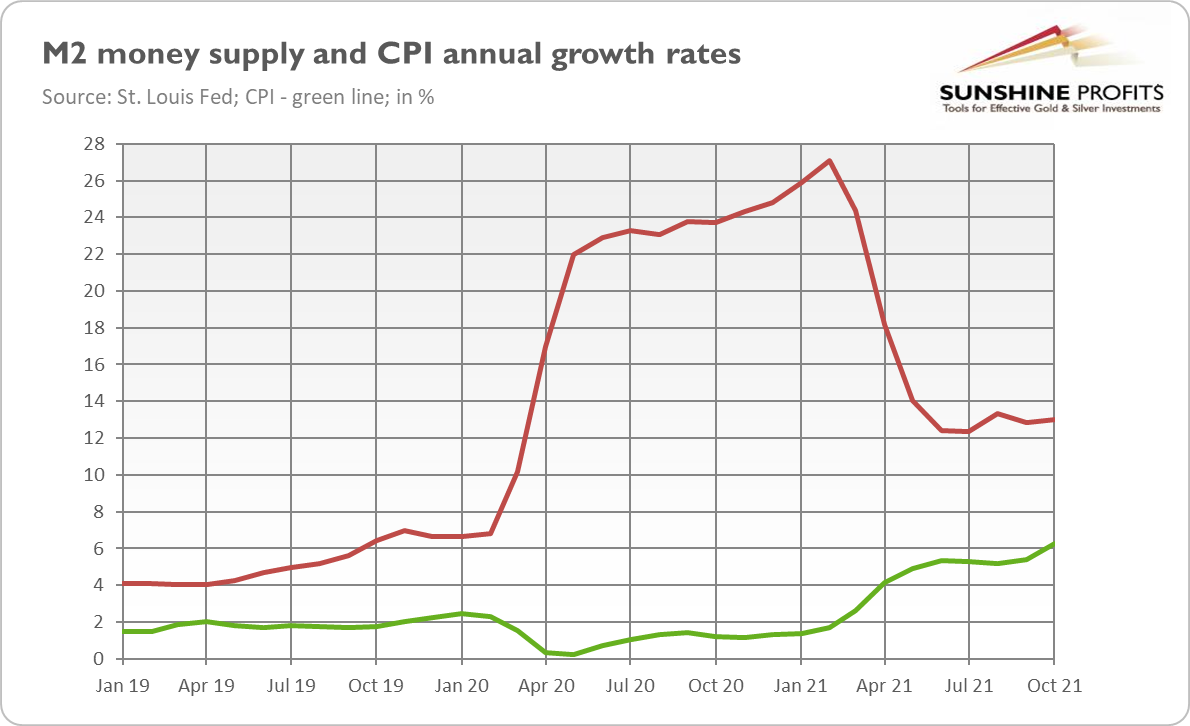
Please take a look at the chart below. As you can see, the broad money supply peaked in February 2021. Assuming a one-year lag between the money supply and price level, inflation rate should reach its peak somewhere in the first quarter of this year.
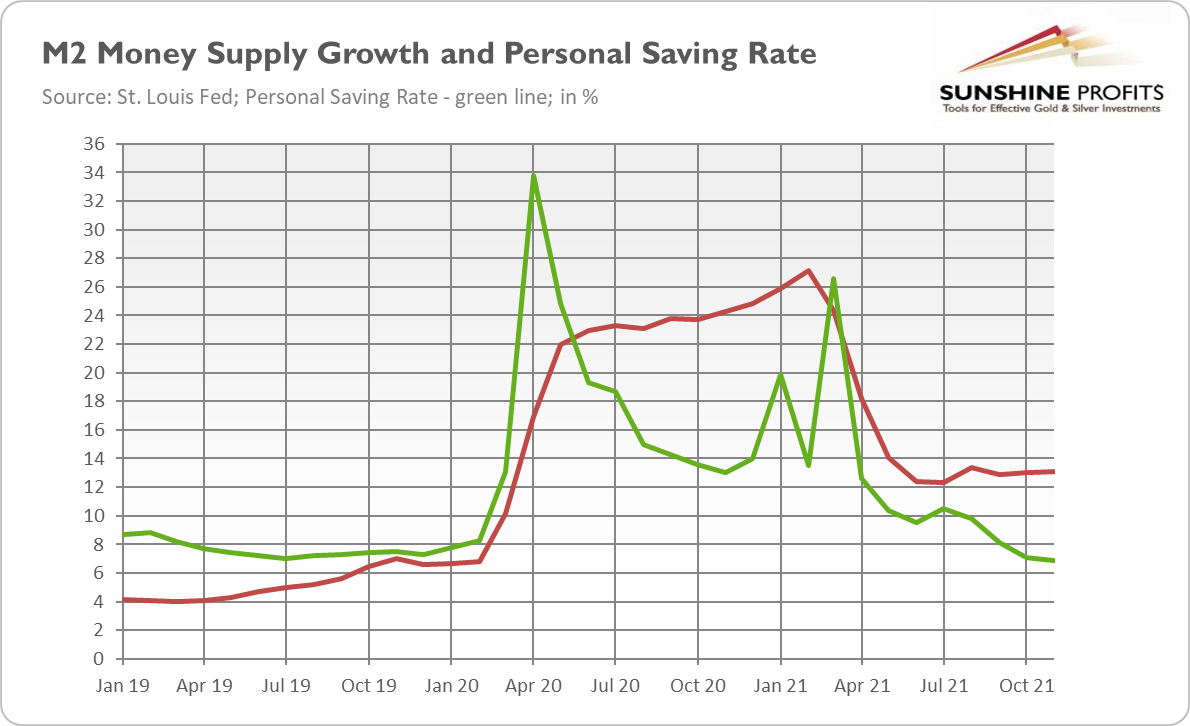
There is one important caveat here: the pace of money supply growth has not returned to the pre-pandemic level, but it stabilized at about 13%, double the rate seen at the end of 2019. Inflation was then more or less at the Fed’s target of 2%, so without constraining money supply growth, the US central bank couldn’t beat inflation.
As the chart above also shows, the personal saving rate has returned to the pre-pandemic level of 7-8%. It means that the bulk of pent-up demand has already materialized, which should also help to ease inflation in the future. However, not all of the ‘forced savings’ have already entered the market. Thus, personal consumption expenditures are likely to be elevated for some time, contributing to boosted inflation.
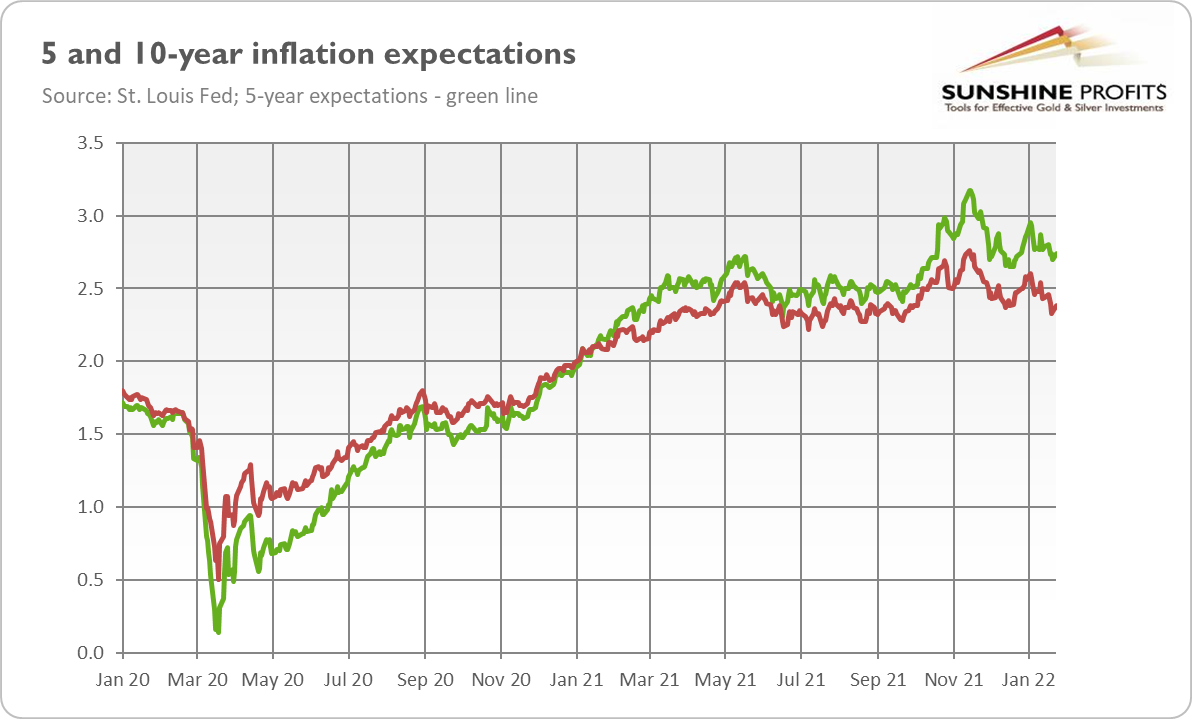
Regarding supply factors, although some bottlenecks have eased, the disruptions have not been fully resolved. The spread of the Omicron variant of the coronavirus and regional lockdowns in China could prolong the imbalances between booming demand and constrained supply. Other contributors to high inflation are rising producer prices, increasing house prices and rents, strong inflation expectations (see the chart below), and labor shortages combined with fast wage growth.
The bottom line is that, all things considered – in particular high level of demand, continued supply issues, and de-anchored inflation expectations – I forecast another year of elevated inflation, but probably not as high as in 2021. After reaching a peak in a few months, the inflation rate could ease to, let’s say, around 4% in December, if we are lucky. Importantly, the moderate bond yields also suggest that inflation will ease somewhat later in 2022.
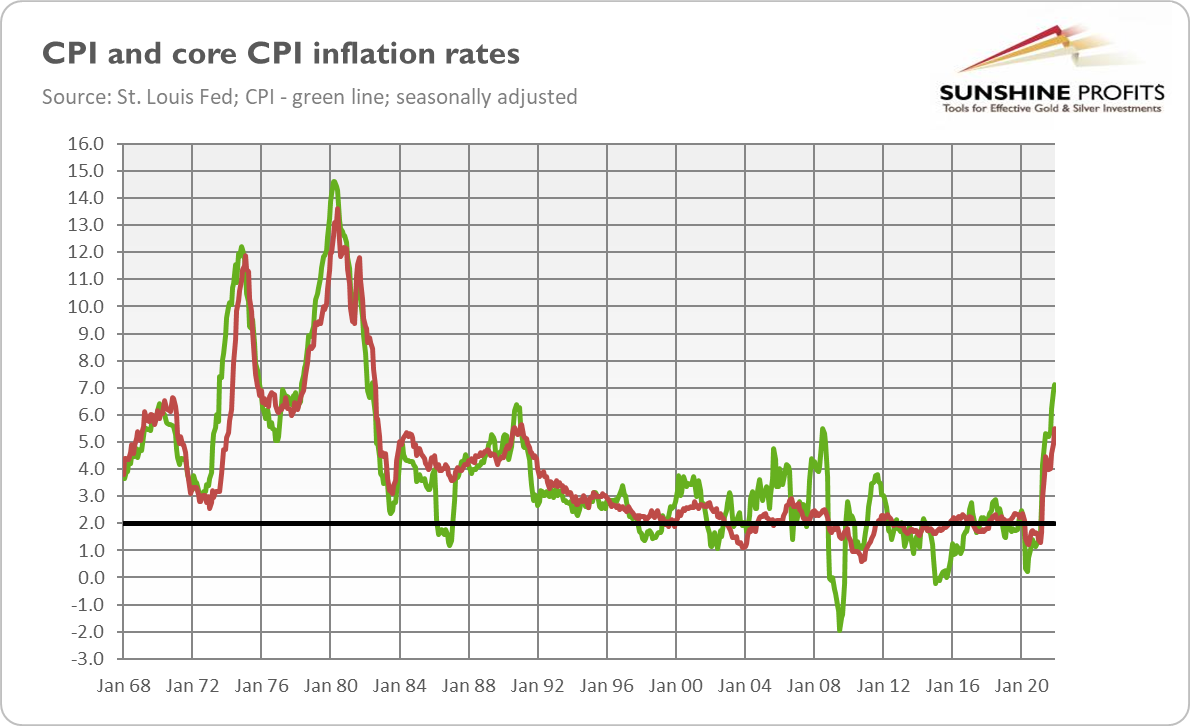
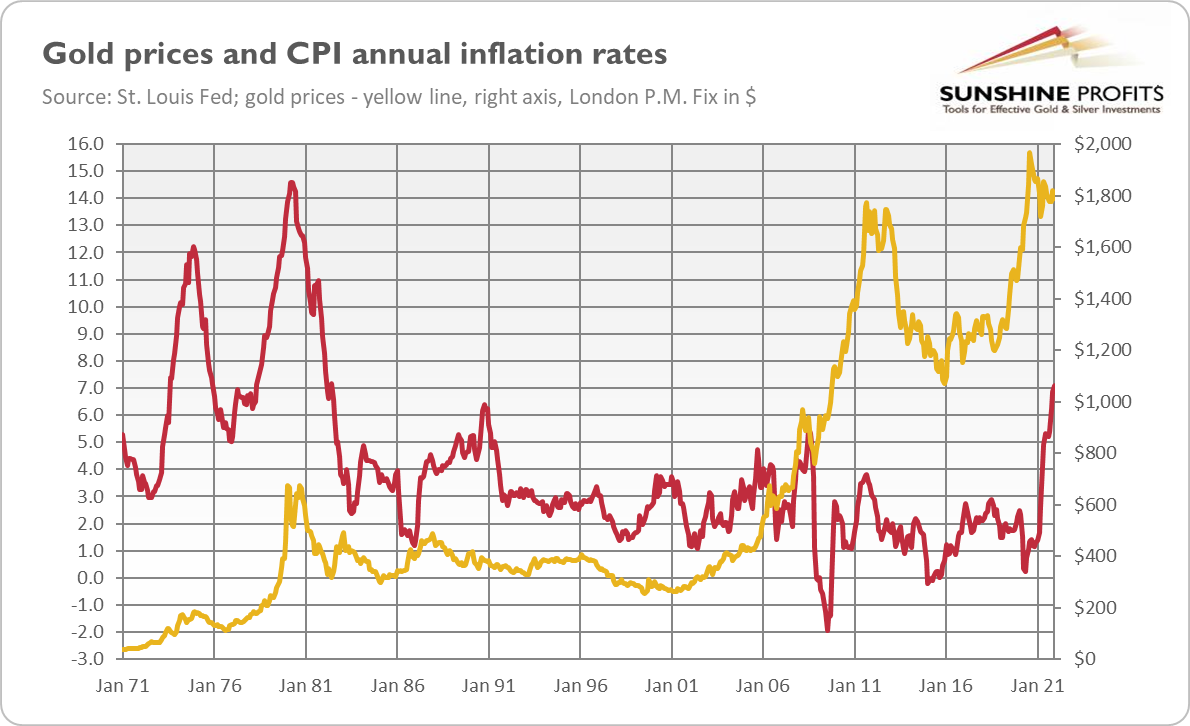
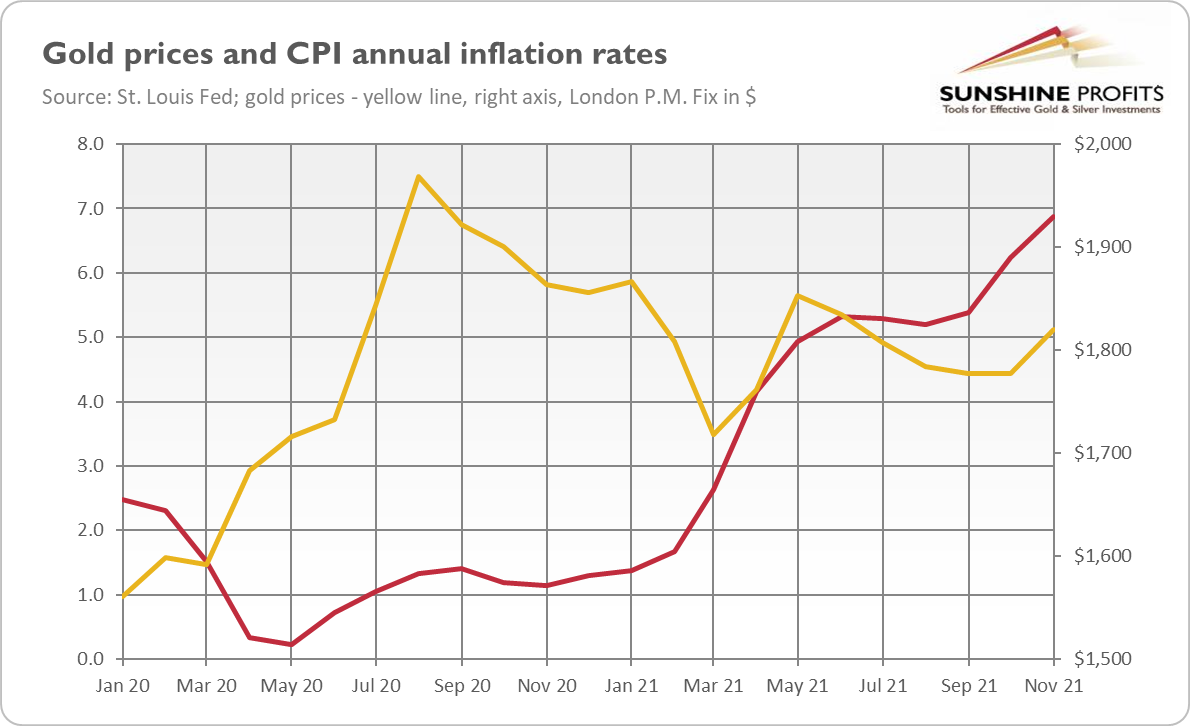
What does it mean for the gold market? Well, I don’t have good news for the gold bulls. Gold loves high and accelerating inflation the most. Indeed, as the chart below shows, gold peaks coincided historically with inflation heights. The most famous example is the inflation peak in early 1980, when gold ended its impressive rally and entered into a long bearish trend. The 2011 top also happened around the local inflationary peak.
The only exception was the 2005 peak in inflation, when gold didn’t care and continued its bullish trend. However, this was partially possible thanks to the decline in the US dollar, which seems unlikely to repeat in the current macroeconomic environment, in which the Fed is clearly more hawkish than the ECB or other major central banks. The relatively strong greenback won’t help gold shine.
Surely, disinflation may turn out to be transitory and inflation may increase again several months later. Lower inflation implies a less aggressive Fed, which should be supportive of gold prices. However, investors should remember that the US central bank will normalize its monetary policy no matter the inflation rate. Since the Great Recession, inflation has been moderate, but the Fed has tightened its stance eventually, nevertheless. Hence, gold may experience a harsh moment when inflation peaks.
Thank you for reading today’s free analysis. If you enjoyed it, and would you like to know more about the links between the economic outlook, and the gold market, we invite you to read the February Gold Market Overview report. Please note that in addition to the above-mentioned free fundamental gold reports, and we provide premium daily Gold & Silver Trading Alerts with clear buy and sell signals. We provide these premium analyses also on a weekly basis in the form of Gold Investment Updates. In order to enjoy our gold analyses in their full scope, we invite you to subscribe today. If you’re not ready to subscribe yet though and are not on our gold mailing list yet, we urge you to sign up. It’s free and if you don’t like it, you can easily unsubscribe. Sign up today!
Arkadiusz Sieron, PhD
Sunshine Profits: Effective Investment through Diligence & Care.-----
Disclaimer: Please note that the aim of the above analysis is to discuss the likely long-term impact of the featured phenomenon on the price of gold and this analysis does not indicate (nor does it aim to do so) whether gold is likely to move higher or lower in the short- or medium term. In order to determine the latter, many additional factors need to be considered (i.e. sentiment, chart patterns, cycles, indicators, ratios, self-similar patterns and more) and we are taking them into account (and discussing the short- and medium-term outlook) in our Gold & Silver Trading Alerts.
-
New Geopolitical Threats for 2022: Is Gold in Danger Too?
February 11, 2022, 11:56 AMAs in previous years, geopolitical tensions are likely to have an impact on the markets in 2022. As a “safe haven”, gold probably won’t be omitted.
Do you have déjà vu? I’m only experiencing one. As you probably remember, January 2020 was a period of vivid geopolitical risks, such as the U.S.-Iran conflict and the North Korea problem. Antonio Guterres, Secretary-General of the United Nations, described these tensions as the highest since 2017. Now, in 2022, here we are again - we have great geopolitical threats ahead of us.
Everyone knows about the renewed tensions between Russia and Ukraine. The former country amassed more than 100,000 troops and military equipment near the border by December 2021, which represents the highest force mobilization since the annexation of Crimea in 2014. In response, NATO sent ships and fighter jets to Eastern Europe and put forces on standby. The risk of Russian invasion and military conflict (which could trigger a response by the US and NATO) worried investors, which possibly spurred some safe-haven demand for gold.
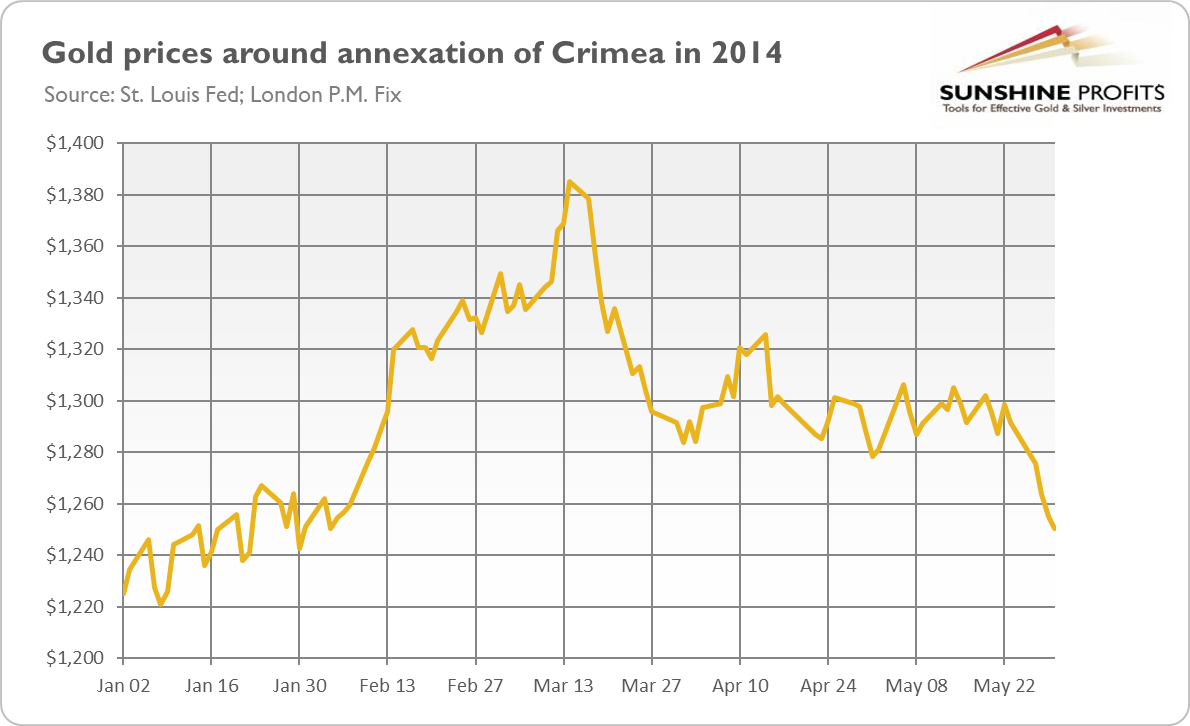
However, the support for the yellow metal may at be short-lived. As the chart below shows, gold soared in February-March 2014, when the annexation of Crimea took place. Its rally started in early February (other factors were also in play then), much before the Crimean crisis, and it quickly ended in mid-March. Gold returned to its long-term bearish trend.
Of course, this time may be different, especially since the West seems to be more ready to help Ukraine than in 2014. However, close economic ties between Germany and Russia make it difficult to achieve unity, and I suspect that the West won’t fight for Ukraine to the last drop of blood (especially given that the country is not even in NATO). Some countries have already started the evacuation of their embassies in Kiev, the Ukrainian capital, which tells us something. However, the marginally higher risk of US military involvement should be more supportive of gold prices, although I wouldn’t buy gold driven solely by the risk of conflict.
The second major conflict that glows in the background is the risk of a potential Chinese invasion of Taiwan. Last year, tensions between China and the island escalated and some experts say that military execution of the “One China” policy is only a matter of time. Taiwan was always a thorn in China’s side, but the country was too weak to do anything about it. However, China’s military power has radically expanded over recent years.
Such a conflict could also temporarily support gold prices, especially since Taiwan has a military alliance with the US and the Pacific crisis could aggravate supply chain disruptions. Another potentially bullish factor could be the lack of any recent track record of China’s military actions and, thus, greater uncertainty compared to the long history of Russia’s military operations and of good old America’s conflicts with the Soviet Union.
Third, there might be an important cyberattack. I know, it sounds almost cliché, as everyone points to this risk. However, after the pandemic, this is one of the greatest threats, according to many experts. This year, we have already seen a cyberattack on Ukrainian government websites as well as a cyber incident that affected Canada’s foreign ministry. Let’s also not forget about Kazakhstan, where the government shut off the internet nationwide in response to civil unrest seen last month.
The last event is more an example of digital authoritarianism rather than a cyberattack, but the result is the same: digital paralysis with huge implications for people’s daily lives. Indeed, guess what happens when people don’t have access to the internet. Yes, they can’t’ check social media for the newest memes with funny puppies, but that’s not the greatest problem (really!). One of the most ominous results is that people don’t have access to their digital bank accounts, i.e., most of their money, which is nowadays generally in electronic form.
This is why it’s smart to do some preparations for worst-case scenarios and always have some cash on hand – and perhaps also some gold bullion, although I suspect that it would be easier to buy groceries with fiat currencies. This is also why cryptocurrencies will probably never replace gold. In our highly digital world, it’s good to hold onto something tangible.
Of course, geopolitical threats are more numerous. I’ve not mentioned Iran’s nuclear advances, the flexing of North Korea’s military muscle, the more virulent, deadly, and vaccine-resistant mutation of the coronavirus (oh boy, that sounds really great, doesn’t it?), the U.S. mid-term elections, environmental risks, mass migration, etc. One thing is certain: geopolitical tensions have intensified recently.
As a safe-haven asset, the yellow metal tends to thrive in periods of high uncertainty. However, geopolitical events usually trigger only short-lived reactions in the precious metals markets, especially if they don’t threaten the United States and its economy directly. This is because all tensions eventually ease, and all conflicts are followed by some kind of settlements. When this happens, there is a sigh of relief, and the upbeat prices of safe havens, including gold, undergo a correction.
Thank you for reading today’s free analysis. If you enjoyed it, and would you like to know more about the links between the economic outlook, and the gold market, we invite you to read the February Gold Market Overview report. Please note that in addition to the above-mentioned free fundamental gold reports, and we provide premium daily Gold & Silver Trading Alerts with clear buy and sell signals. We provide these premium analyses also on a weekly basis in the form of Gold Investment Updates. In order to enjoy our gold analyses in their full scope, we invite you to subscribe today. If you’re not ready to subscribe yet though and are not on our gold mailing list yet, we urge you to sign up. It’s free and if you don’t like it, you can easily unsubscribe. Sign up today!
Arkadiusz Sieron, PhD
Sunshine Profits: Effective Investment through Diligence & Care.-----
Disclaimer: Please note that the aim of the above analysis is to discuss the likely long-term impact of the featured phenomenon on the price of gold and this analysis does not indicate (nor does it aim to do so) whether gold is likely to move higher or lower in the short- or medium term. In order to determine the latter, many additional factors need to be considered (i.e. sentiment, chart patterns, cycles, indicators, ratios, self-similar patterns and more) and we are taking them into account (and discussing the short- and medium-term outlook) in our Gold & Silver Trading Alerts.
-
Will the Fed Tighten Gold? The Consequences Might Be Ignoble
February 4, 2022, 8:11 AMBeware, the Fed’s tightening of monetary policy could lift real interest rates! For gold, this poses a risk of prices wildly rolling down.
The first FOMC meeting in 2022 is behind us. What can we expect from the US central bank this year and how will it affect the price of gold? Well, this year’s episode of Fed Street will be sponsored by the letter “T”, which stands for “tightening”. It will consist of three elements.
First, quantitative easing tapering. The asset purchases are going to end by early March. To be clear, during tapering, the Fed is still buying securities, so it remains accommodative, but less and less. Tapering has been very gradual and well-telegraphed to the markets, so it’s probably already priced in gold. Thus, the infamous taper tantrum shouldn’t replay.
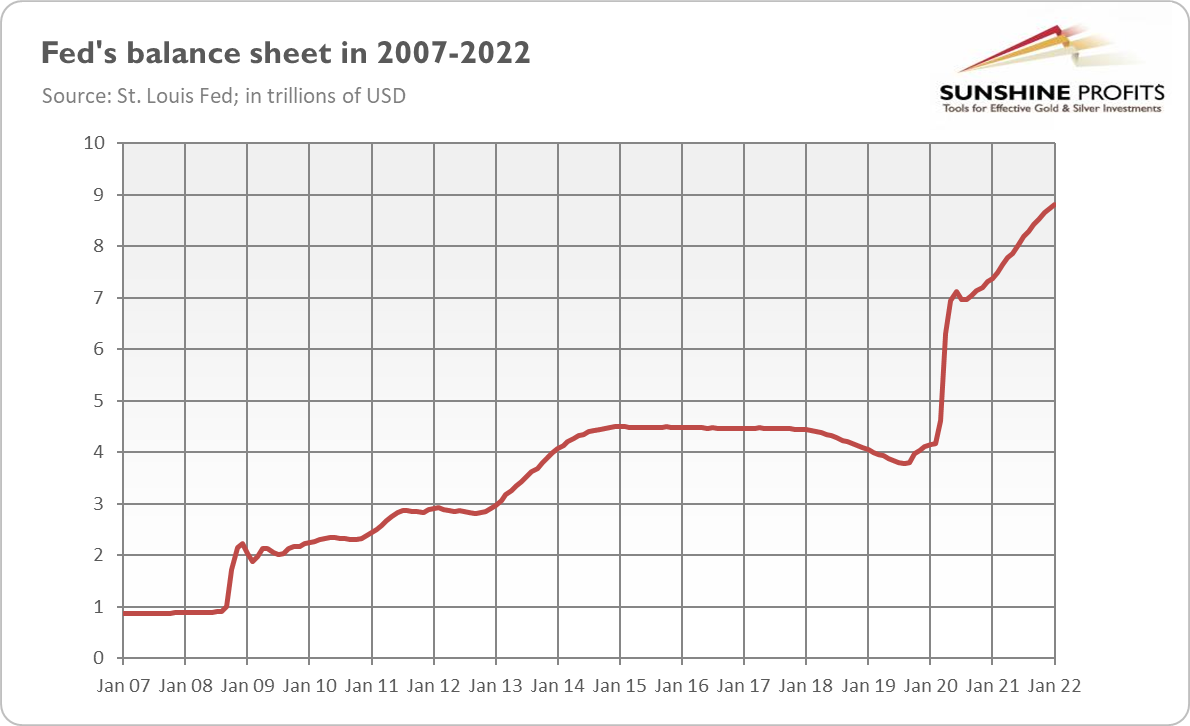
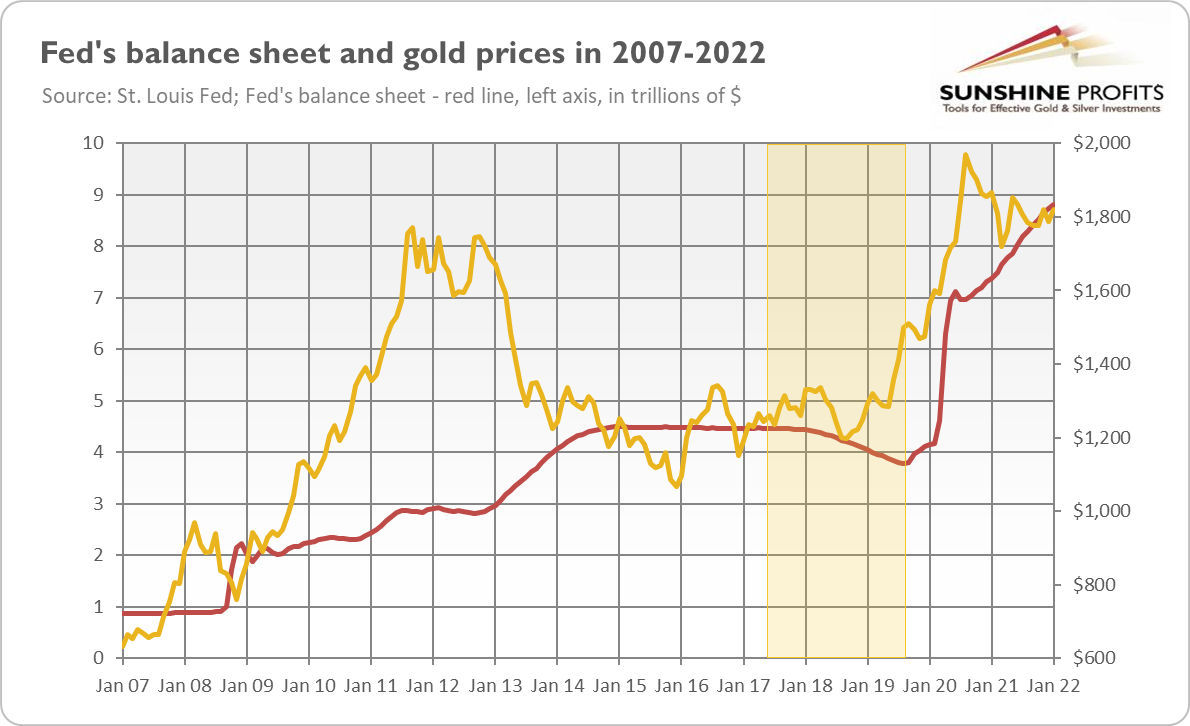
Second, quantitative tightening. Soon after the end of asset purchases, the Fed will begin shrinking its mammoth balance sheet. As the chart below shows, it has more than doubled since the start of the pandemic, reaching about $9 trillion, or about 36% of the country’s GDP. It’s so gigantic that even Powell admitted during his January press conference that “the balance sheet is substantially larger than it needs to be.” Captain Obvious attacked again!
In contrast to tapering, which just reduces additions to the Fed’s holdings, quantitative tightening will shrink the balance sheet. How much? It’s hard to say. Last time, during QT from 2017 to 2019, the Fed started unloading $10 billion in assets per month, gradually lifting the cap to $50 billion.
Given that inflation is now much higher, and the Fed has greater confidence in the economic recovery, the scale of reduction would probably be higher. The QT will create upward pressure on interest rates, which could be negative for the gold market.
However, QT will be a very gradual and orderly process. Instead of selling assets directly, the US central bank will stop reinvestment of proceeds as securities run off. As we can read in “Principles for Reducing the Size of the Federal Reserve's Balance Sheet”,
The Committee intends to reduce the Federal Reserve's securities holdings over time in a predictable manner primarily by adjusting the amounts reinvested of principal payments received from securities held in the System Open Market Account.
What’s more, the previous case of QT wasn’t detrimental to gold, as the chart below shows. The price of gold started to rally in late 2018 and especially later in mid-2019.
Third, the hiking cycle. In March, the Fed is going to start increasing the federal funds rate. According to the financial markets, the US central bank will enact five interest rate hikes this year, raising the federal funds rate to the range of 1.25-1.50%.
Now, there are two narratives about American monetary policy in 2022. According to the first, we are witnessing a hawkish revolution within the Fed, as it would shift its monetary stance in a relatively short time. The central bank will “double tighten” (i.e., it will shrink its balance sheet at the same time as hiking rates), and it will do it in a much more aggressive way than after the Great Recession. Such decisive moves will significantly raise the bond yields, which will hit gold prices. However, in this scenario, the Fed’s aggressive actions will eventually lead to the inversion of the yield curve and later to recession, which should support the precious metals market.
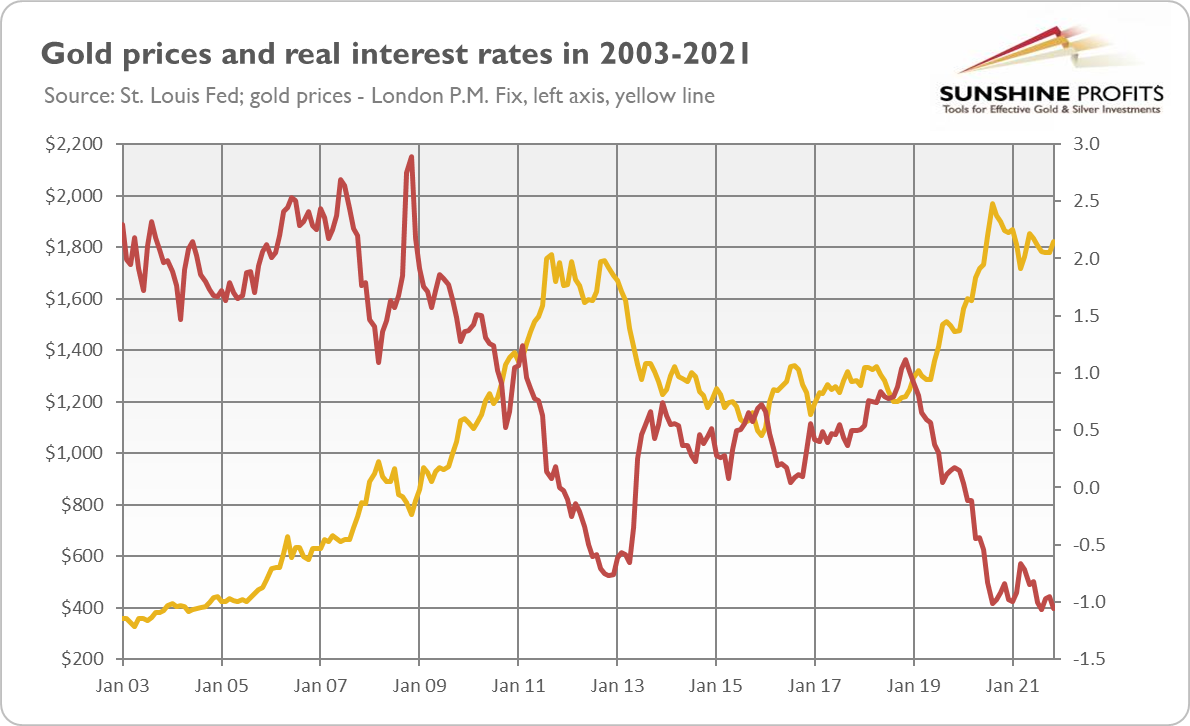
On the other hand, some analysts point out that central bankers are all talk and – given their dovish bias – act less aggressively than they promise, chickening out in the face of the first stock market turbulence. They also claim that all the Fed’s actions won’t be enough to combat inflation and that monetary conditions will remain relatively loose. For example, Stephen Roach argues that “the Fed is so far behind [the curve] that it can’t even see the curve.” Indeed, the real federal funds rate is deeply negative (around -7%), as the chart below shows; and even if inflation moderates to 3.5% while the Fed conducts four hikes, it will remain well below zero (about -2%), providing some support for gold prices.
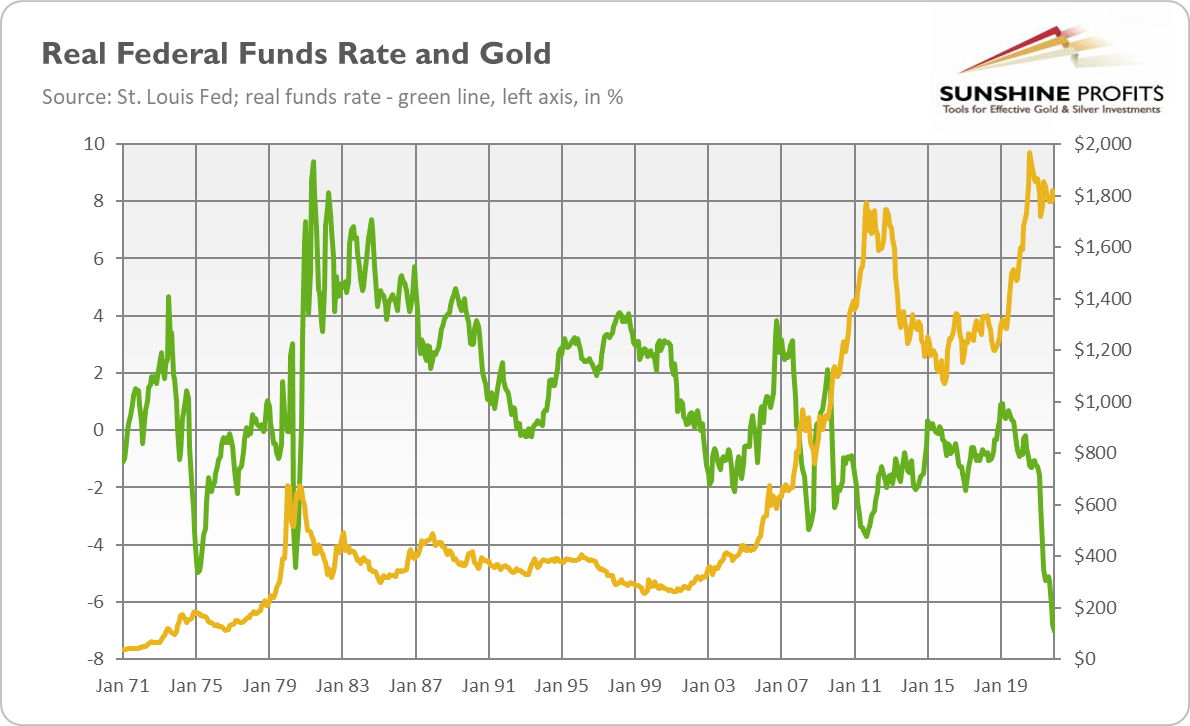
Which narrative is correct? Well, there are grains of truth in both of them. However, I would like to remind you that what really matters for the markets is the change or direction, not the level of a variable. Hence, the fact that real interest rates are to stay extremely low doesn’t guarantee that gold prices won’t decline in a response to the hiking cycle.
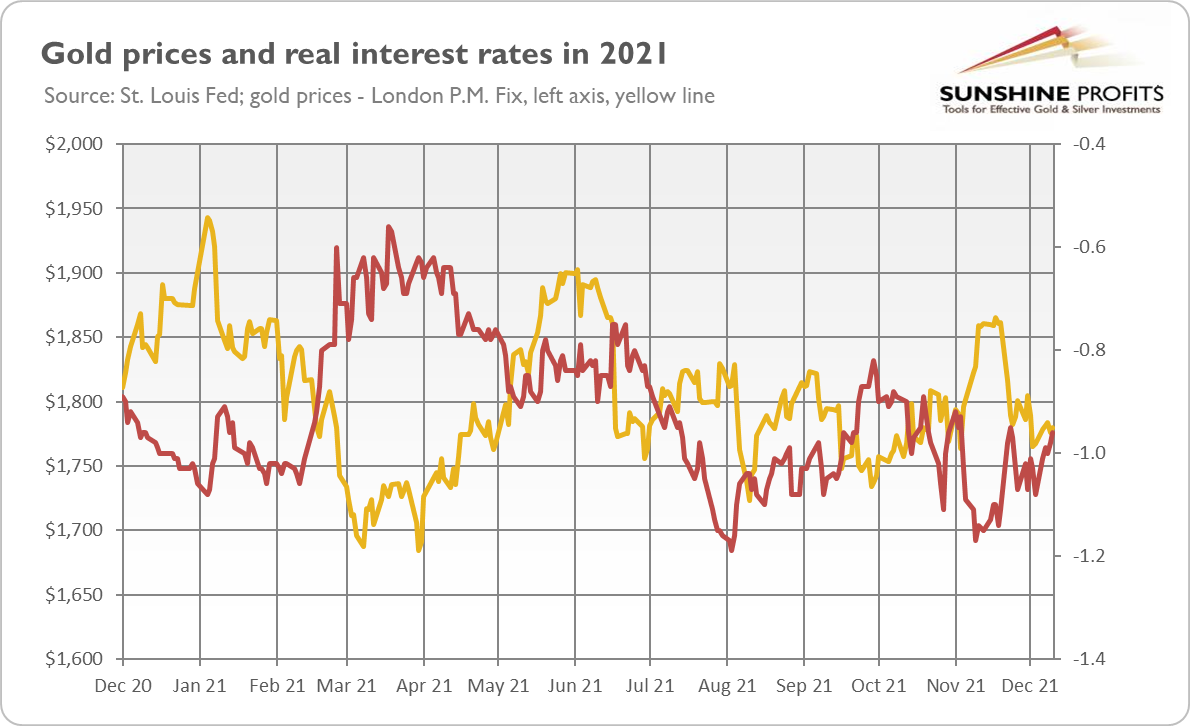
Actually, as the chart above shows, the upward reversal in the real interest rates usually plunges gold prices. Given that real rates are at a record low, a normalization is still ahead of us. Hence, unless inflation continues to rise, bond yields are likely to move up, while gold – to move down.
Thank you for reading today’s free analysis. If you enjoyed it, and would you like to know more about the links between the economic outlook, and the gold market, we invite you to read the February Gold Market Overview report. Please note that in addition to the above-mentioned free fundamental gold reports, and we provide premium daily Gold & Silver Trading Alerts with clear buy and sell signals. We provide these premium analyses also on a weekly basis in the form of Gold Investment Updates. In order to enjoy our gold analyses in their full scope, we invite you to subscribe today. If you’re not ready to subscribe yet though and are not on our gold mailing list yet, we urge you to sign up. It’s free and if you don’t like it, you can easily unsubscribe. Sign up today!
Arkadiusz Sieron, PhD
Sunshine Profits: Effective Investment through Diligence & Care.-----
Disclaimer: Please note that the aim of the above analysis is to discuss the likely long-term impact of the featured phenomenon on the price of gold and this analysis does not indicate (nor does it aim to do so) whether gold is likely to move higher or lower in the short- or medium term. In order to determine the latter, many additional factors need to be considered (i.e. sentiment, chart patterns, cycles, indicators, ratios, self-similar patterns and more) and we are taking them into account (and discussing the short- and medium-term outlook) in our Gold & Silver Trading Alerts.
-
Gold in 2022: Between Inflationary Rock and Hard Fed
January 28, 2022, 4:09 AMGold’s fate in 2021 will be determined mainly by inflation and the Fed’s reaction to it.
In the epic struggle between chaos and order, chaos has an easier task, as there is usually only one proper method to do a job – the job that you can screw up in many ways. Thus, although economists see a strong economic expansion with cooling prices and normalization in monetary policies in 2022, many things could go wrong. The Omicron strain of coronavirus or its new variants could become more contagious and deadly, pushing the world into the Great Lockdown again. The real estate crisis in China could lead the country into recession, with serious economic consequences for the global economy. Oh, by the way, we could see an escalation between China and Taiwan, or between China and the US, especially after the recent test of hypersonic missiles by the former country.
Having said that, I believe that the major forces affecting the gold market in 2022 will be – similarly to last year’s – inflation and the Fed’s response to it. Considering things in isolation, high inflation should be supportive of gold prices. The problem here is that gold prefers high and rising inflation. Although the inflation rate should continue its upward move for a while, it’s likely to peak this year.
Indeed, based on very simple monetarist reasoning, I expect the peak to be somewhere in the first quarter of 2022. This is because the lag between the acceleration in money supply growth (March 2020) and CPI growth (March 2021) was a year. The peak in the former occurred in February 2021, as the chart below shows. You can do the math (by the way, this is the exercise that turned out to be too difficult for Jerome Powell and his “smart” colleagues from the Fed).
This is – as I’ve said – very uncomplicated thinking that assumes the stability of the lag between monetary impulses and price reactions. However, given the Fed’s passive reaction to inflation and the fact that the pace of money supply growth didn’t return to the pre-pandemic level, but stayed at twice as high, the peak in inflation may occur later.
In other words, more persistent inflation is the major risk for the economy that many economists still downplay. The consensus expectation is that inflation returns to a level close to the Fed’s target by the end of the year. For 2021, the forecasts were similar. Instead, inflation has risen to about 7%. Thus, never underestimate the power of the inflation dragon, especially if the beast is left unchecked! As everyone knows, dragons love gold – and this feeling is mutual.

The Saxo Bank, in its annual “Outrageous Predictions”, sees the potential for US consumer prices to rise 15% in 2022, as “companies bid up wages in an effort to find willing and qualified workers, triggering a wage-price spiral unlike anything seen since the 1970’s”. Actually, given the fact that millions of Americans left the labor market – which the Fed doesn’t understand and still expects that they will come back – this prediction is not as extreme as one could expect. I still hope that inflationary pressure will moderate this year, but I’m afraid that the fall may not be substantial.
On the other hand, we have the Fed with its hawkish rhetoric and tapering of quantitative easing. The US central bank is expected to start a tightening cycle, hiking the federal funds rate at least twice this year. It doesn’t sound good for gold, does it? A hawkish Fed implies a stronger greenback and rising real interest rates, which is negative for the yellow metal. As the chart below shows, the normalization of monetary policy after the Great Recession, with the infamous “taper tantrum”, was very supportive of the US dollar but lethal for gold.
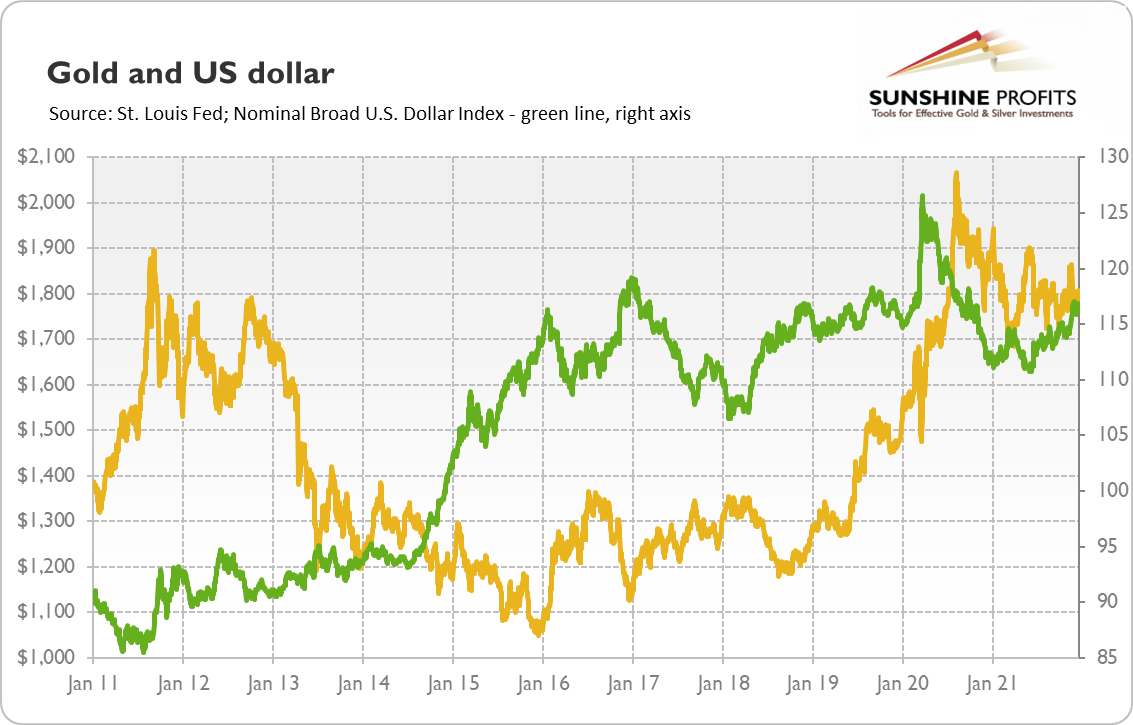
However, the price of gold bottomed in December 2015, exactly when the Fed hiked the interest rates for the first time after the global financial crisis. Markets are always future-oriented, so they often react more to expected rather than actual events. Another thing is that the Fed’s tightening cycle of 2015-2018 was dovish and the federal funds rate (and the Fed’s balance sheet) never returned to pre-crisis levels. The same applies to the current situation: despite all the hawkish reactions, the Fed is terribly behind the curve.
Last but not least, history teaches us that a tightening Fed spells trouble for markets. As a reminder, the last tightening cycle led to the reversal of the yield curve in 2019 and the repo crisis, which forced the US central bank to cut interest rates, even before anyone has heard of covid-19. Hence, the Fed is in a very difficult situation. It either stays behind the curve, which risks letting inflation get out of control, or tightens its monetary policy in a decisive manner, just like Paul Volcker did in the 1980s, which risks a correction of already-elevated asset prices and the next economic crisis. Such expectations have boosted gold prices since December 2015, and they could support the yellow metal today as well.
Thank you for reading today’s free analysis. If you enjoyed it, and would you like to know more about the links between the economic outlook, and the gold market, we invite you to read the January Gold Market Overview report. Please note that in addition to the above-mentioned free fundamental gold reports, and we provide premium daily Gold & Silver Trading Alerts with clear buy and sell signals. We provide these premium analyses also on a weekly basis in the form of Gold Investment Updates. In order to enjoy our gold analyses in their full scope, we invite you to subscribe today. If you’re not ready to subscribe yet though and are not on our gold mailing list yet, we urge you to sign up. It’s free and if you don’t like it, you can easily unsubscribe. Sign up today!
Arkadiusz Sieron, PhD
Sunshine Profits: Effective Investment through Diligence & Care.-----
Disclaimer: Please note that the aim of the above analysis is to discuss the likely long-term impact of the featured phenomenon on the price of gold and this analysis does not indicate (nor does it aim to do so) whether gold is likely to move higher or lower in the short- or medium term. In order to determine the latter, many additional factors need to be considered (i.e. sentiment, chart patterns, cycles, indicators, ratios, self-similar patterns and more) and we are taking them into account (and discussing the short- and medium-term outlook) in our Gold & Silver Trading Alerts.
-
Gold Slides and Rebounds in 2022
January 21, 2022, 6:14 PMMy outlook for the gold market in 2022 suffers from manic depression: I see first a period of despair and an elevated mood later.
So, 2021 is over! 2022 will be better, right? Yeah, for sure! Just relax, what bad could happen?
Seriously, what can we expect from this year? I see a few key trends that are going to shape 2022, and their names are: Death, Famine, Pestilence, and War. Oh, sorry, the wrong list! At least I hope so… I meant, of course: economic recovery, inflation, and the Fed’s tightening cycle. Let’s examine them in detail.
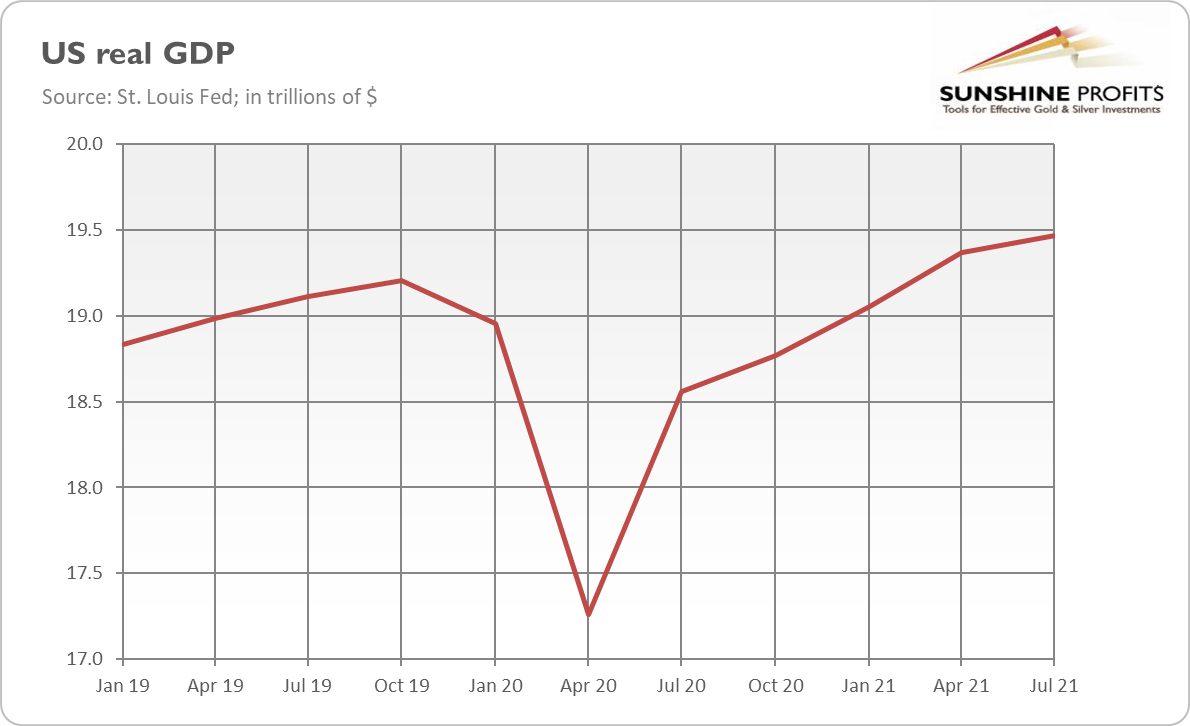
First, there will be the end of the pandemic (or, actually, its most acute phase) and a return to normal economic conditions. In some aspects, such as the GDP, the economy has already recovered from the 2020 economic crisis (as the chart below shows). However, broad population immunity and new drugs will limit the economic impact of coronavirus (the virus won’t disappear and will become endemic) in the future. What’s more, the global economy is likely to solve most of the supply problems that emerged last year (although not immediately). The return to normalcy should support risk appetite while hitting the safe-haven assets such as gold.
To be clear, I do expect a further deceleration in the pace of economic growth, but it should remain positive or even above the trend. In other words, although inflation will stay elevated, I don’t see stagflation coming in 2022. It means that the most favorable scenario for the gold bulls won’t materialize.
Second, inflation is likely to peak somewhere in the first half of this year to get down later. To be clear, inflation won’t disappear on its own; its taming will depend on resolving supply problems and, even more, on appropriately hawkish actions from the Fed. You see, inflation results mainly from the surge in the broad money supply that boosted demand much above the supply. Although fixed bottlenecks will help to ease pressure on the supply, they won’t erase all the newly created money that entered the economy last year. Inflation is, thus, likely to stay elevated in 2022 as well. Inflationary pressure should support gold prices. However, when inflation peaks and disinflation sets in, demand for gold as an inflation hedge will drop.
Third, the Fed will turn more hawkish. Powell has already admitted that the narrative about transitory inflation should be abandoned. Thus, it seems that the US central bank finally understood that it had to react to rising inflation, so it already accelerated the pace of tapering of quantitative easing. Hence, in 2022, the Fed will end its asset purchases and start raising the federal funds rate. The prospects of the Fed’s tightening cycle will put downward pressure on gold, just as they did last year.
Let’s sum up. The economy should normalize and grow further next year, while inflation should reach its peak. Both monetary and fiscal policies will become tighter. In particular, the Fed will hike interest rates, probably twice, or even three times. In consequence, the US dollar should strengthen, especially given the ECB’s dovish stance, while bond yields should increase. Indeed, a more hawkish monetary policy combined with inflation reaching a plateau implies rising real interest rates. Holy Krugerrand, it does not sound like a dreamland for gold! Actually, gold is likely to struggle, and we could see an important slide in prices.
However, the bullish case is not doomed. First, inflation could be more persistent than we all think, so it could peak rather later than sooner this year. Stubbornly high inflation would keep real interest rates deeply in negative territory, which should support gold prices.
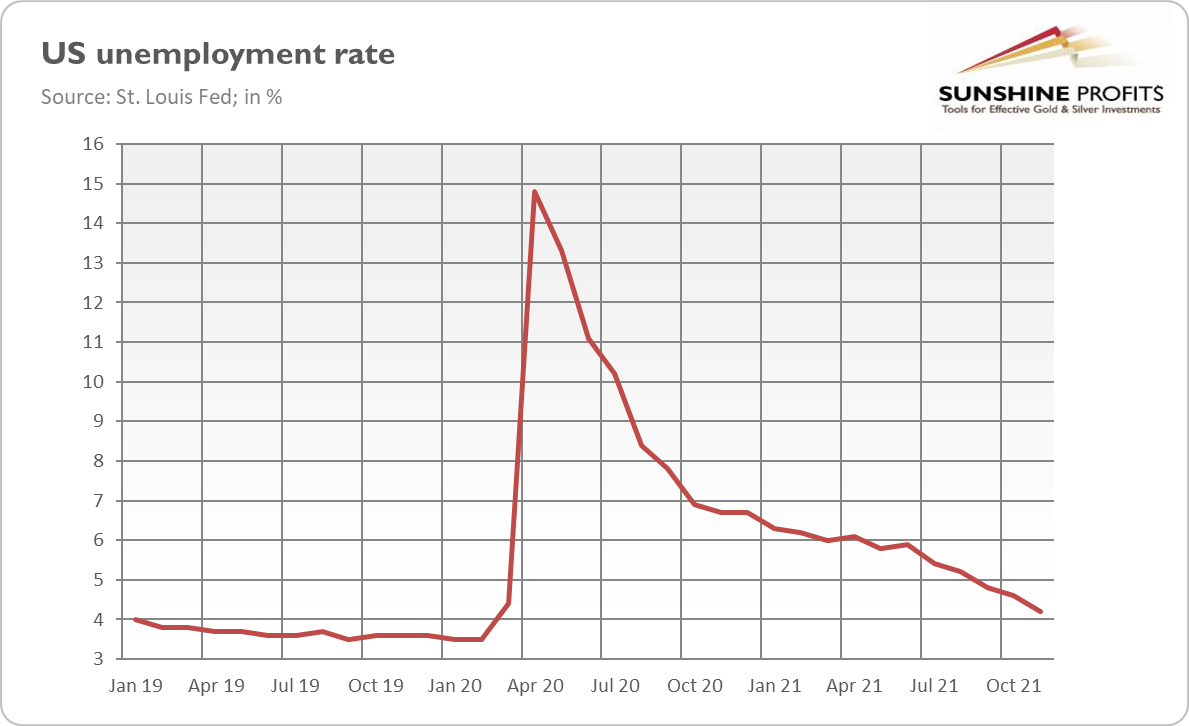
Second, economic growth could also surprise us negatively. I mean here, for example, the fact that the unemployment rate seems to be close to its bottom (as the chart below shows), so the room for further improvements seems to be limited. Elevated inflation, supply problems, and the Fed’s tightening cycle increase the odds of the next financial crisis or even a recession. However, it’s rather a matter of a future beyond 2022.
Third, gold reached its bottom in December 2015 when the Fed hiked interest rates for the first time since the Great Recession. Thus, if this history replays, the actual beginning of the Fed’s tightening cycle could, in fact, be positive for gold prices, contrary to prospects of hikes.
Hence, my baseline scenario for this year is that gold will struggle in the first months of the year and slide to the bottom around the Fed’s first hike, which will occur sometime in the spring. The main downside risk is that this year’s tightening cycle will be worse for gold than in 2015-2019, while the major upside risk is that inflation worries will strengthen or even dominate the marketplace.
Thank you for reading today’s free analysis. If you enjoyed it, and would you like to know more about the links between the economic outlook, and the gold market, we invite you to read the January Gold Market Overview report. Please note that in addition to the above-mentioned free fundamental gold reports, and we provide premium daily Gold & Silver Trading Alerts with clear buy and sell signals. We provide these premium analyses also on a weekly basis in the form of Gold Investment Updates. In order to enjoy our gold analyses in their full scope, we invite you to subscribe today. If you’re not ready to subscribe yet though and are not on our gold mailing list yet, we urge you to sign up. It’s free and if you don’t like it, you can easily unsubscribe. Sign up today!
Arkadiusz Sieron, PhD
Sunshine Profits: Effective Investment through Diligence & Care.-----
Disclaimer: Please note that the aim of the above analysis is to discuss the likely long-term impact of the featured phenomenon on the price of gold and this analysis does not indicate (nor does it aim to do so) whether gold is likely to move higher or lower in the short- or medium term. In order to determine the latter, many additional factors need to be considered (i.e. sentiment, chart patterns, cycles, indicators, ratios, self-similar patterns and more) and we are taking them into account (and discussing the short- and medium-term outlook) in our Gold & Silver Trading Alerts.
-
Gold Wars: Revenge of Supply and Inflation
January 14, 2022, 10:24 AMInflation! The Republic is crumbling under attacks by the ruthless Supply Lord, Count Shortage. Dearness is everywhere. Will gold save the galaxy?
If George Lucas were to make a movie about 2021 instead of Jedi knights, he would probably call it Revenge of the Supply. After all, last year will be remembered as the period of semiconductor shortages, production bottlenecks, disrupted value chains, delayed deliveries, surging job vacancies, rising inflation, and skyrocketing energy prices. It could be a shocking discovery for Keynesian economists, who focus on aggregate demand and believe that there is always slack in the economy, but it turned out that supply matters too!
As a reminder, state governments couldn’t deal with the pandemic more smartly and introduced lockdowns. Then, it turned out – what a surprise! – that the shutdown of the economy, well, shut down the economy, so the Fed and the banking system boosted the money supply, while Congress passed a mammoth fiscal stimulus, including sending checks to just about every American.
In other words, 2021 showed us that one cannot close and reopen the economy without any negative consequences, as the economy doesn’t simply return to the status quo. After the reopening of the economy, people started to spend all the money that was “printed” and given to them. Hence, demand increased sharply, and supply couldn’t keep up with the boosted spending.
It turned out that economic problems are not always related to the demand side that has to be “stimulated”. We’ve also learned that there are supply constraints and that production and delivery don’t always go smoothly. The contemporary economy is truly global, complex, and interconnected – and the proper working of this mechanism depends on the adequate functioning of its zillion elements. Thus, shit happens from time to time. This is why it’s smart to have some gold as a portfolio insurance against tail risks.
Evergiven, the ship that blocked the Suez Canal, disrupting international trade, was the perfect illustration. However, the importance of supply factors goes beyond logistics and is related to regulations, taxes, incentives, etc. Instead of calls for injecting liquidity during each crisis, efficiency, reducing the disincentives to work and invest, and unlocking the supply shackles imposed by the government should become the top economic priority.
Another negative surprise for mainstream economists in 2021 was the revenge of inflation. For years, central bankers and analysts have dismissed the threat of inflation, considering it a phenomenon of the past. In the 1970s, the Fed was still learning how to conduct monetary policy. It made a few mistakes, but is much smarter today, so stagflation won’t repeat. Additionally, we live in a globalized economy with strong product competition and weak labor unions, so inflation won’t get out of control.
Indeed, inflation was stubbornly low for years, despite all the easy monetary policy, and didn’t want to reach the Fed’s target of 2%, so the US central bank changed its regime to be more flexible and tolerant of inflation. It was in 2020, just one year before the outbreak of inflation. The Fed completely didn’t expect that – which shows the intellectual poverty of this institution – and called it “transitory”.

Initially, inflation was supposed to be short-lived because of the “base effects”, then because of the “supply bottlenecks”. Only in November, the Fed admitted that inflation was more broad-based and would be more persistent than it previously thought. Well, better late than never!
What does the revenge of supply and inflation imply for the gold market? One could expect that gold would perform better last year amid all the supply problems and a surge in inflation. We’ve learned that gold doesn’t always shine during inflationary times. The reason was that supply shortages didn’t translate into a full-blown economic crisis. On the contrary, they were caused by a strong rebound in demand; and they contributed mainly to higher inflation, which strengthened the Fed’s hawkish rhetoric and expectations of higher interest rates, creating downward pressure on gold prices.
On the other hand, we could say as well that gold prices were supported by elevated inflation and didn’t drop more thanks to all the supply disruptions and inflationary threats. After all, during the economic expansion of 2011-2015 that followed the Great Recession, gold plunged about 45%, while between the 2020 peak and the end of 2021, the yellow metal lost only about 13%, as the chart below shows.
Hence, the worst might be yet to come. I don’t expect a similarly deep decline as in the past, especially given that the Fed’s tightening cycle seems to be mostly priced in, but the real interest rates could normalize somewhat. Thus, I have bad news for the gold bulls. The supply crunch is expected to moderate in the second half of 2022, which would also ease inflationary pressure. To be clear, inflation won’t disappear, but it may reach a peak this year. The combination of improvement on the supply side of the economy, with inflation reaching its peak, and with a more hawkish Fed doesn’t bode well for gold.
Thank you for reading today’s free analysis. If you enjoyed it, and would you like to know more about the links between the economic outlook, and the gold market, we invite you to read the January Gold Market Overview report. Please note that in addition to the above-mentioned free fundamental gold reports, and we provide premium daily Gold & Silver Trading Alerts with clear buy and sell signals. We provide these premium analyses also on a weekly basis in the form of Gold Investment Updates. In order to enjoy our gold analyses in their full scope, we invite you to subscribe today. If you’re not ready to subscribe yet though and are not on our gold mailing list yet, we urge you to sign up. It’s free and if you don’t like it, you can easily unsubscribe. Sign up today!
Arkadiusz Sieron, PhD
Sunshine Profits: Effective Investment through Diligence & Care.-----
Disclaimer: Please note that the aim of the above analysis is to discuss the likely long-term impact of the featured phenomenon on the price of gold and this analysis does not indicate (nor does it aim to do so) whether gold is likely to move higher or lower in the short- or medium term. In order to determine the latter, many additional factors need to be considered (i.e. sentiment, chart patterns, cycles, indicators, ratios, self-similar patterns and more) and we are taking them into account (and discussing the short- and medium-term outlook) in our Gold & Silver Trading Alerts.
-
Gold Market in 2022: Fall and Revival?
January 7, 2022, 10:19 AM2021 will be remembered as the year of inflation’s comeback and gold’s dissatisfying reaction to it. Will gold improve its behavior in 2022?
You thought that 2020 was a terrible year, but we would be back to normal in 2021? Well, we haven’t quite returned to normal. After all, the epidemic is not over, as new strains of coronavirus emerged and spread last year. Actually, in some aspects, 2021 was even worse than 2020. Two years ago, the pandemic was wreaking havoc. Last year, both the pandemic and inflation were raging.
To the great surprise of mainstream economists fixated on aggregate demand, 2021 would be recorded in chronicles as the year of the supply factors revenge and the great return of inflation. For years, the pundits have talked about the death of inflation and mocked anyone who pointed to its risk. Well, he who laughs last, laughs best. However, it’s laughter through inflationary tears.
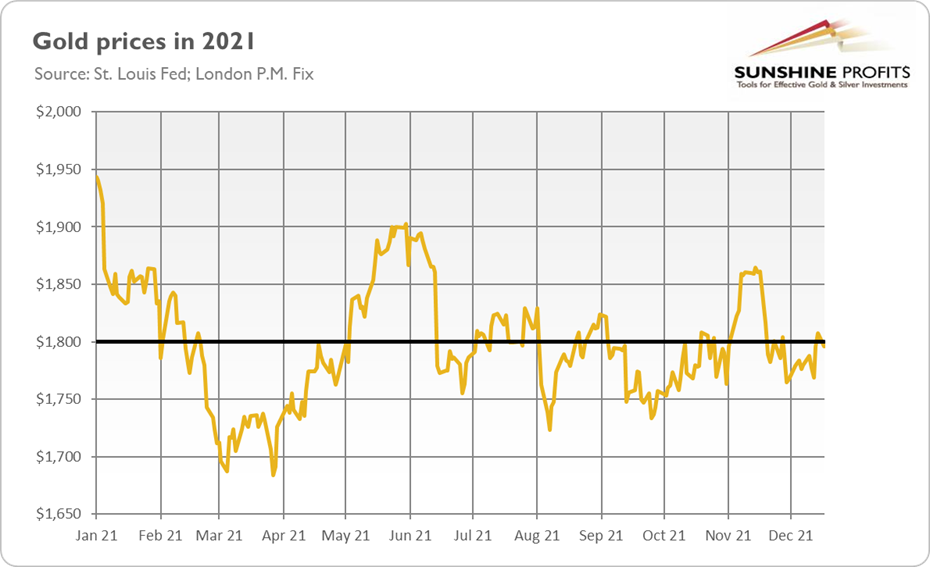
Given the highest inflation rate since the Great Stagflation, gold prices must have grown a lot, right? Well, not exactly. As the chart below shows, 2021 wasn’t the best year for the yellow metal. Gold lost almost 5% over the last twelve months. Although I correctly predicted that “gold’s performance in 2021 could be worse than last year”, I expected less bearish behavior.
What exactly happened? From a macroeconomic perspective, the economy recovered last year. As vaccination progressed, sanitary restrictions were lifted, and risk appetite returned to the market, which hit safe-haven assets such as gold. What’s more, a rebound in economic activity and rising inflation prompted the Fed to taper its quantitative easing and introduce more hawkish rhetoric, which pushed gold prices down.
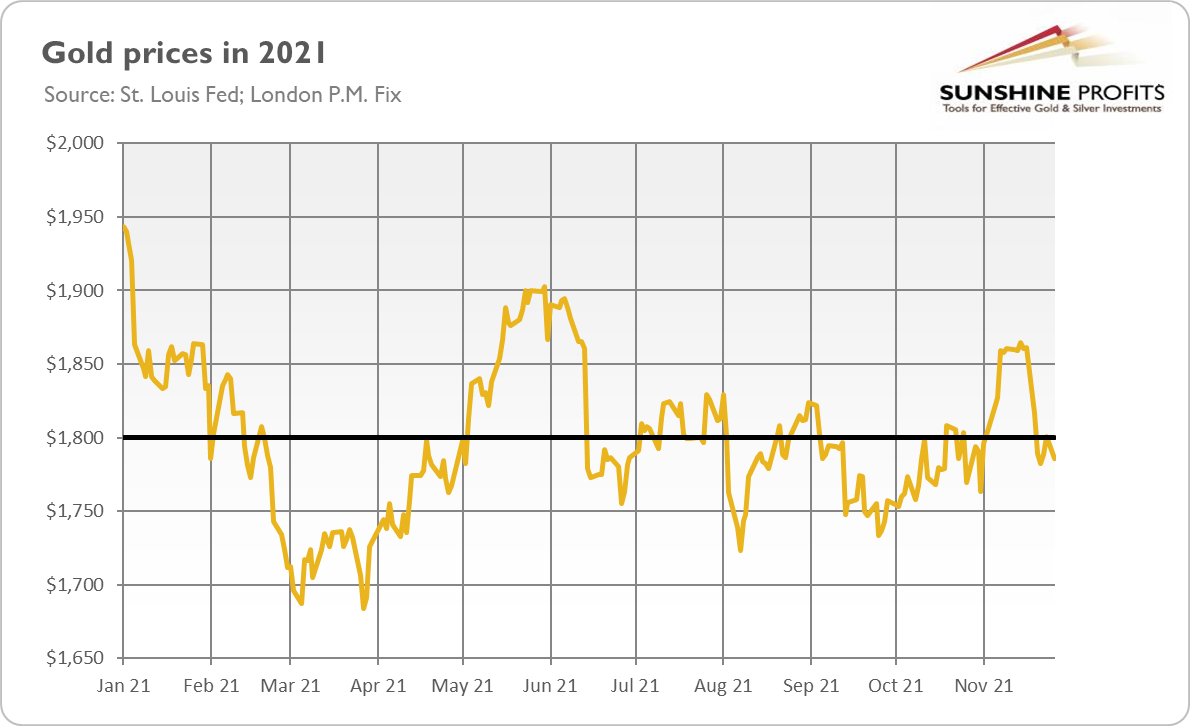
As always, there were both ups and downs in the gold market last year. Gold started 2021 with a bang, but began plunging quickly amid Democrats’ success in elections, the Fed more optimistic about the economy, and rising interest rates. The slide lasted until late March, when gold found its bottom of $1,684. This is because inflation started to accelerate at that point, while the Fed was downplaying rising price pressures, gibbering about “transitory inflation”.
The rising worries about high inflation and the perspective of the US central bank staying behind the curve helped gold reach $1,900 once again in early June. However, the hawkish FOMC meeting and dot-plot that came later that month created another powerful bearish wave in the gold market that lasted until the end of September.
Renewed inflationary worries and rising inflation expectations pushed gold to $1,865 in mid-November. However, the Fed announced a tapering of its asset purchases, calming markets once again and regaining investors’ trust in its ability to control inflation. As consequence, gold declined below $1,800 once again and stayed there by the end of the year.
What can we learn from gold’s performance in 2021? First of all, gold is not a perfect inflation hedge, as the chart below shows. I mean here that, yes, gold is sensitive to rising inflation, but a hawkish Fed beats inflation in the gold market. Thus, inflation is positive for gold only if the US central bank stays behind the curve. However, when investors believe that either inflation is temporary or that the Fed will turn more hawkish in response to upward price pressure, gold runs away into the corner. Royal metal, huh?
Second, never underestimate the power of the dark… I mean, the hawkish side of the Fed – or simply, don’t fight the Fed. It turned out that the prospects of a very gradual asset tapering and tightening cycle were enough to intimidate gold.
Third, real interest rates remain the key driver for gold prices. As one can see in the chart below, gold plunged each time bond yields rallied, in particular in February 2021, but also in June or November. Hence, gold positively reacts to inflation as long as inflation translates into lower real interest rates. However, if other factors – such as expectations of a more hawkish Fed – come into play and outweigh inflation, gold suffers.
Great, we already know that 2021 sucked and why. However, will 2022 be better for the gold market? Although I have great sympathy for the gold bulls, I don’t have good news for them.
It seems that gold’s struggle will continue this year, at least in the first months of 2022, as the Fed’s hiking cycle and rising bond yields would create downward pressure on gold. However, when the US central bank starts raising the federal funds rate, gold may find its bottom, as it did in December 2015, and begin to rally again.
Thank you for reading today’s free analysis. If you enjoyed it, and would you like to know more about the links between the economic outlook, and the gold market, we invite you to read the January Gold Market Overview report. Please note that in addition to the above-mentioned free fundamental gold reports, and we provide premium daily Gold & Silver Trading Alerts with clear buy and sell signals. We provide these premium analyses also on a weekly basis in the form of Gold Investment Updates. In order to enjoy our gold analyses in their full scope, we invite you to subscribe today. If you’re not ready to subscribe yet though and are not on our gold mailing list yet, we urge you to sign up. It’s free and if you don’t like it, you can easily unsubscribe. Sign up today!
Arkadiusz Sieron, PhD
Sunshine Profits: Effective Investment through Diligence & Care.-----
Disclaimer: Please note that the aim of the above analysis is to discuss the likely long-term impact of the featured phenomenon on the price of gold and this analysis does not indicate (nor does it aim to do so) whether gold is likely to move higher or lower in the short- or medium term. In order to determine the latter, many additional factors need to be considered (i.e. sentiment, chart patterns, cycles, indicators, ratios, self-similar patterns and more) and we are taking them into account (and discussing the short- and medium-term outlook) in our Gold & Silver Trading Alerts.
-
Excuse Me, Mr. Gold. What Year Is It?
December 31, 2021, 7:34 AMAlthough your calendar may say otherwise, gold is in the 1960s. The question is whether we will move into the 1970s or speed-run to the mid-2010s.
Did you go overboard with your time travel and lose track of time? Probably not, but just in case, I assure you that the current year is 2021. To be 100% sure, I fact-checked it on a dedicated webpage for time-travelers. However, the authority of science is being questioned, and there are people who say that, from a macroeconomic point of view, we are approaching the 1970s, or at least the 1960s. There are also voices saying that the gold market is replaying 2012-2013. Although appearances point to 2021, let’s investigate what year we really live in.
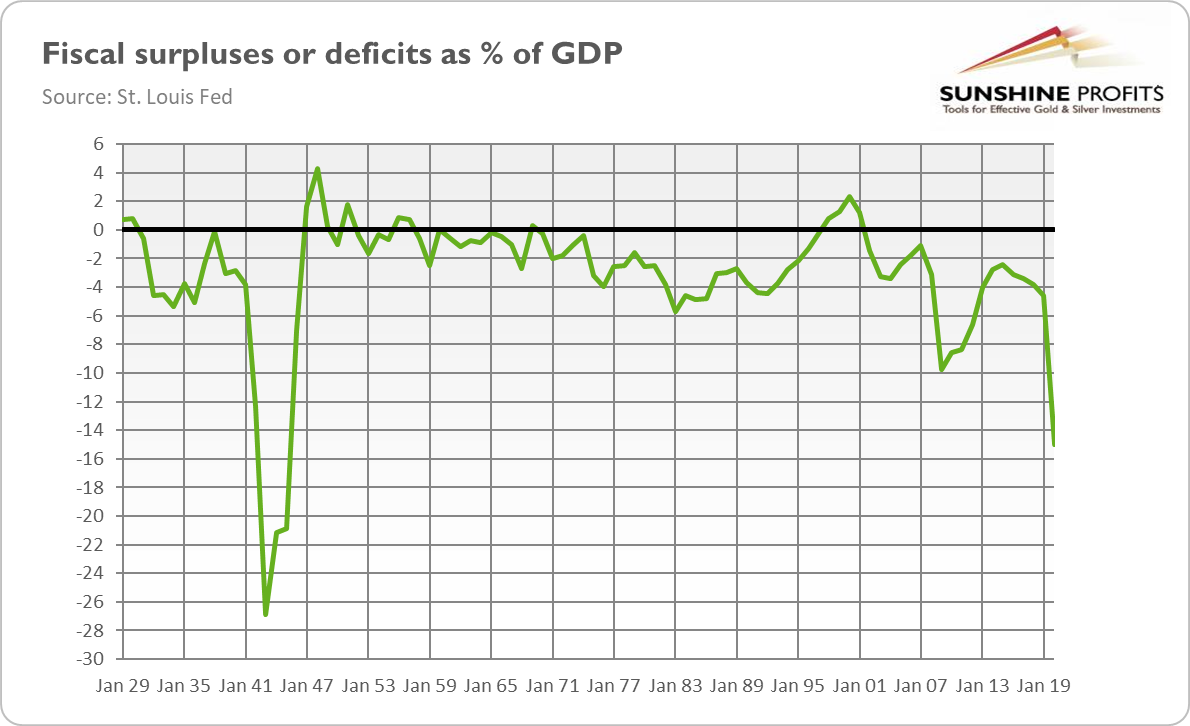
The similarities with the 1970s are obvious. Just like then, we have high inflation, large fiscal deficits (see the chart below), and easy, erroneous monetary policy. Fifty years ago, the Fed blamed inflation on exogenous shocks and considered inflation to be transitory too. The new monetary regime adopted by the US central bank in 2020 also takes us back to the 70s and the mistaken belief that the economy cannot overheat, so the Fed can let inflation run above the target for a while in order to boost employment.
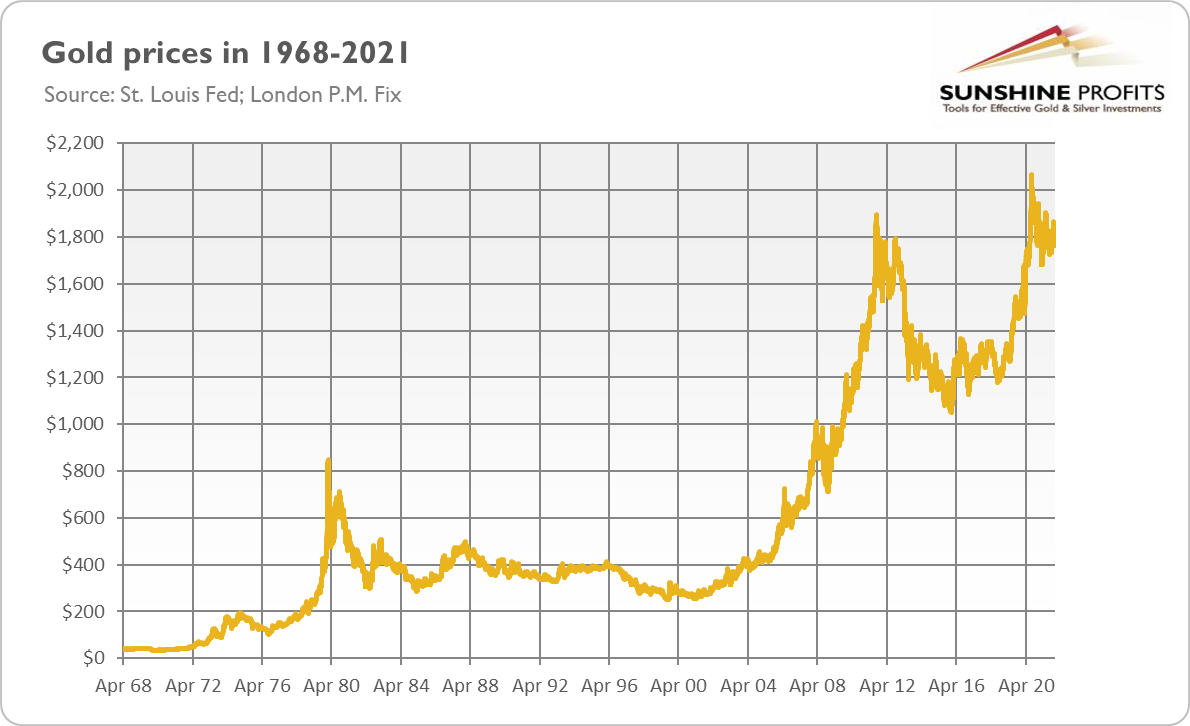
The parallels extend beyond price pressure. The withdrawal of US troops from Afghanistan reminded many of the fall of Saigon. The world is facing an energy crisis right now, another feature of the 1970s. If we really repeat those years, gold bulls should be happy, as the yellow metal rallied from $35 to $850, surging more than 2300% back in that decade (see the chart below).
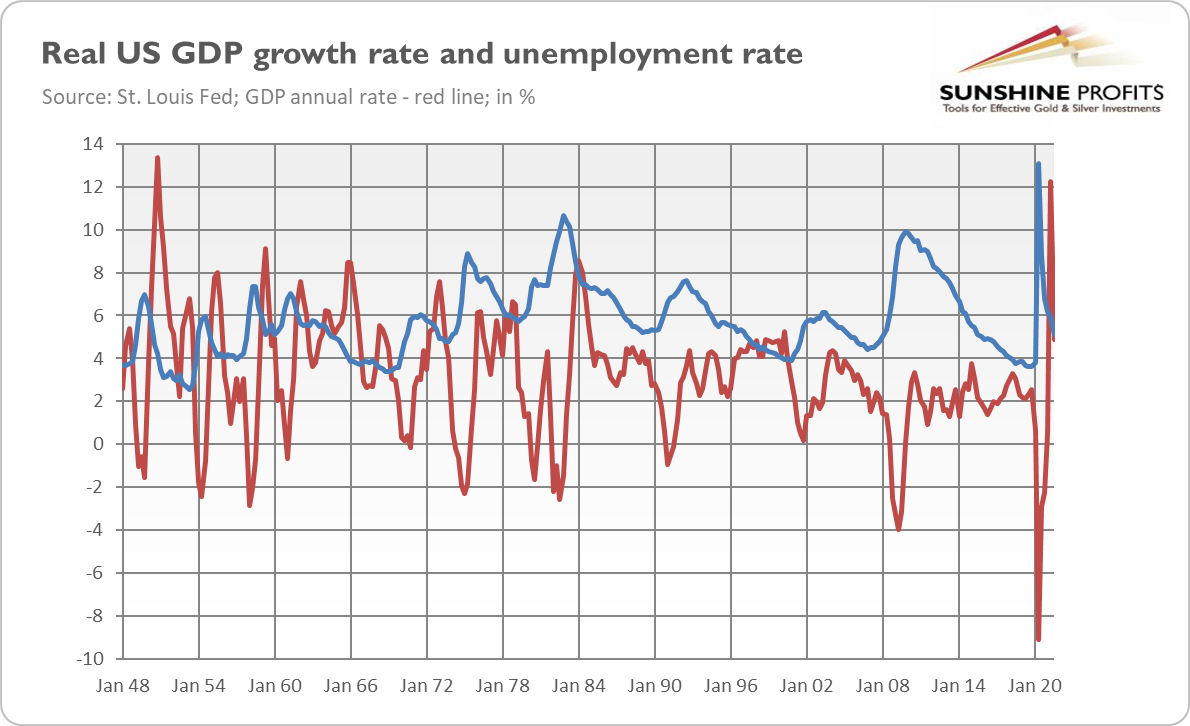
However, there is one problem with this narrative. In the 1970s, we experienced stagflation, i.e., a simultaneous occurrence of high inflation and economic stagnation with a rising unemployment rate. Currently, although we face strong upward price pressure, we enjoy economic expansion and declining unemployment, as the chart below shows. Indeed, the monthly unemployment rate decreased from 14.8% in April 2020 to 4.2% in November 2021.
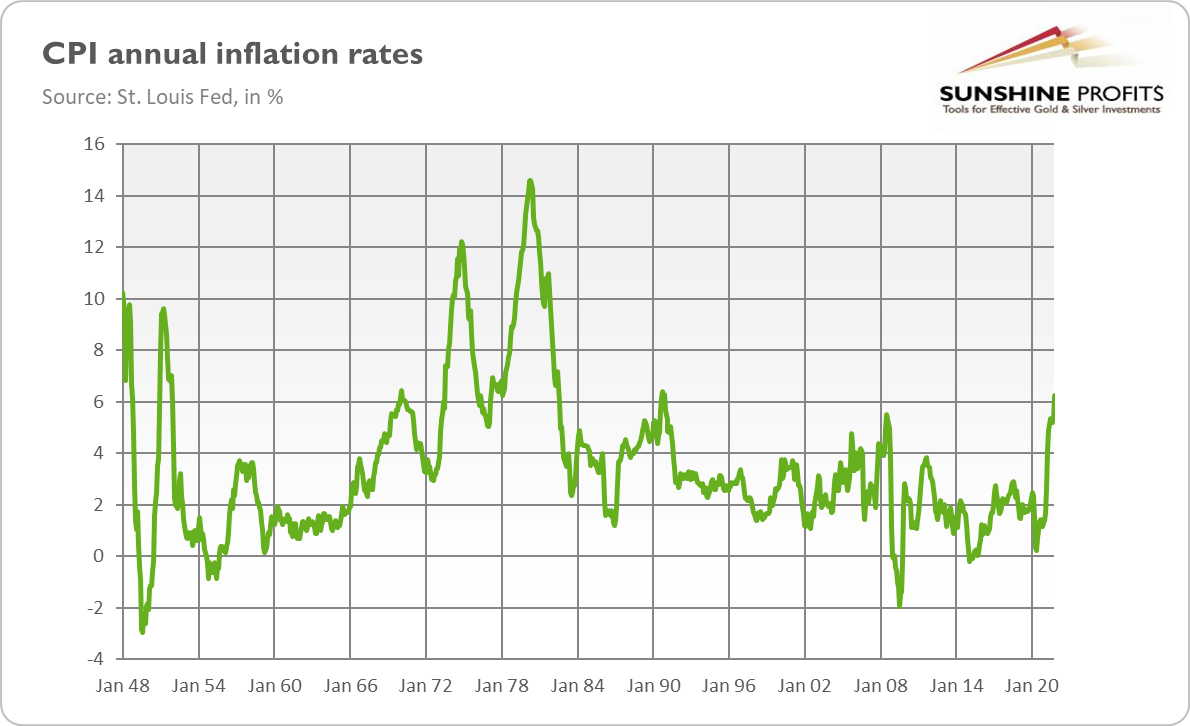
The current macroeconomic situation, characterized by inflation without stagnation part, is reminiscent of the 1960s, a decade marked by rising inflation and rapid GDP growth. As the chart below shows, the CPI annual rate reached a local maximum of 6.4% in February 1970, similar to the current inflation level.
Apparently, we are replaying the 1960s right now rather than the 1970s. So far, growth is slowing down, but we are far from stagnation territory. There is no discussion on this. My point was always that the Fed’s actions could bring us to the 1970s, or that complacency about inflation is increasing the risk of de-anchoring inflation expectations and the materialization of a stagflationary scenario. In the 1960s, the price of gold was still fixed, so historical analysis is impossible.
However, it seems that gold won’t start to rally until we see some signs of stagnation or an economic crisis, and markets begin to worry about recession. Given that the current economic expansion looks intact, the yellow metal is likely to struggle at least by mid-2022 (unless supply disruptions and energy crisis intensify significantly, wreaking havoc).
Do we have to go back that far in time, though? Maybe the 2020 peak in gold prices was like the 2011 peak and we are now somewhere in 2012-2013, on the eve of a great downward move in the gold market? Some similarities cannot be denied: the economy is recovering from a recession, while the Fed is tightening its monetary policy, and gold shows weakness with its inability to surpass $1,800. So, some concerns are warranted. I pointed out a long time ago the threat of an upward move in the real interest rates (as they are at record low levels), which could sink the precious metals market.
However, there are two key differences compared to the 2012-2013 period. First, inflation is much higher and it’s still accelerating, while ten years ago there was disinflation. This distinction should support gold prices. The peak in the inflation rate could be a dangerous time for gold, as the disinflationary era would raise interest rates, putting downward pressure on the yellow metal.
Second, the prospects of the Fed’s tightening cycle are probably already priced in. In other words, the next “taper tantrum” is not likely to happen. It implies that a sudden spike in the interest rates similar to that of 2013 (see the chart below) shouldn’t repeat now.
Hence, the answer to the question “what year is it?” should be that we are somewhere in the 1960s and we can move later into the 1970s if high inflation stays with us and stagnation sets in or if the next crisis hits. However, we can leap right into the 2010s if inflation peaks soon and the hawkish Fed triggers a jump in bond yields. It’s also possible that we will see a temporary disinflation before the second wave of elevated inflation. So, gold could continue its struggle for a while before we see another rally.
Thank you for reading today’s free analysis. If you enjoyed it, and would you like to know more about the links between the economic outlook, and the gold market, we invite you to read the December Gold Market Overview report. Please note that in addition to the above-mentioned free fundamental gold reports, and we provide premium daily Gold & Silver Trading Alerts with clear buy and sell signals. We provide these premium analyses also on a weekly basis in the form of Gold Investment Updates. In order to enjoy our gold analyses in their full scope, we invite you to subscribe today. If you’re not ready to subscribe yet though and are not on our gold mailing list yet, we urge you to sign up. It’s free and if you don’t like it, you can easily unsubscribe. Sign up today!
Arkadiusz Sieron, PhD
Sunshine Profits: Effective Investment through Diligence & Care.-----
Disclaimer: Please note that the aim of the above analysis is to discuss the likely long-term impact of the featured phenomenon on the price of gold and this analysis does not indicate (nor does it aim to do so) whether gold is likely to move higher or lower in the short- or medium term. In order to determine the latter, many additional factors need to be considered (i.e. sentiment, chart patterns, cycles, indicators, ratios, self-similar patterns and more) and we are taking them into account (and discussing the short- and medium-term outlook) in our Gold & Silver Trading Alerts.
-
Is the End of Transitory Inflation the End of Gold Bulls?
December 24, 2021, 4:53 AMThe debate about the nature of inflation is over. Now the question is what the end of transitory inflation implies for gold. I offer two perspectives.
Welcome, my son. Welcome to the inflationary machine. Welcome to the new economic regime of elevated inflation. That’s official because even central bankers have finally admitted what I’ve been saying for a long time: the current high inflation is not merely a transitory one-off price shock. In a testimony before Congress, Jerome Powell agreed that “it’s probably a good time to retire” the word “transitory” in relation to inflation. Bravo, Jay! It took you only several months longer than my freshmen students to figure it out, but better late than never. Actually, even a moderately intelligent chimpanzee would notice that inflation is not merely temporary just by looking at the graph below.
To be clear, I’m not predicting hyperinflation or even galloping inflation. Nor do I claim that at least some of the current inflationary pressures won’t subside next year. No, some supply-side factors behind recent price surges are likely to abate in 2022. However, other drivers will persist, or even intensify (think about housing inflation or energy crisis).
Let’s be honest: we are facing a global inflation shock right now. In many countries, inflation has reached its highest rate in decades. In the United States, the annual CPI rate is 6.2%, while it reached 5.2% in Germany, 4.9% in the Eurozone, and 3.8% in the United Kingdom. The shameful secret is that central banks and governments played a key role in fueling this inflation. As the famous Austrian economist Ludwig von Mises noticed once,
The most important thing to remember is that inflation is not an act of God; inflation is not a catastrophe of the elements or a disease that comes like the plague. Inflation is a policy — a deliberate policy of people who resort to inflation because they consider it to be a lesser evil than unemployment. But the fact is that, in the not very long run, inflation does not cure unemployment.
Indeed, the Fed and the banking system injected a lot of money into the economy and also created room for the government to boost its spending and send checks to Americans. The resulting consumer spending boom clogged the supply chains and caused a jump in inflation.
Obviously, the policymakers don’t want to admit their guilt and that they have anything to do with inflation. At the beginning, they claim that there is no inflation at all. Next, they say that inflation may exist after all, but is only caused by the “base effect”, so it will be a short-lived phenomenon that results solely from the nature of the yearly comparison. Lastly, they admit that there is something beyond the “base effect” but inflation will be transitory because it’s caused only by a few exceptional components of the overall index, the outliers like used cars this year. Nothing to worry about, then. Higher prices are a result of bottlenecks that will abate very soon on their own. Later, inflation is admitted to be more broad-based and persistent, but it is said to be caused by greedy businesses and speculators who raise prices maliciously. Finally, the policymakers present themselves as the salvation from the inflation problem(that was caused by them in the first place). Such brilliant “solutions” as subsidies to consumers and price controls are introduced and further disrupt the economy.
The Fed has recently admitted that inflation is not merely transitory, so if the abovementioned scheme is adequate, we should expect to look for scapegoats and possibly also interventions in the economy to heroically fight inflation. Gold could benefit from such rhetoric, as it could increase demand for safe-haven assets and inflation hedges.
However, the Fed’s capitulation also implies a hawkish shift. If inflation is more persistent, the US central bank will have to act in a more decisive way, as inflation won’t subside on its own. The faster pace of quantitative easing tapering and the sooner interest rate hikes imply higher bond yields and a stronger greenback, so they are clearly negative for gold prices.
Having said that, the Fed stays and is likely to stay woefully behind the curve. The real federal funds rate (i.e., adjusted by the CPI annual rate) is currently at -6.1%, which is the deepest level in history, as the chart below shows. It is much deeper than it was at the lows of stagflation in the 1970s, which may create certain problems in the future.
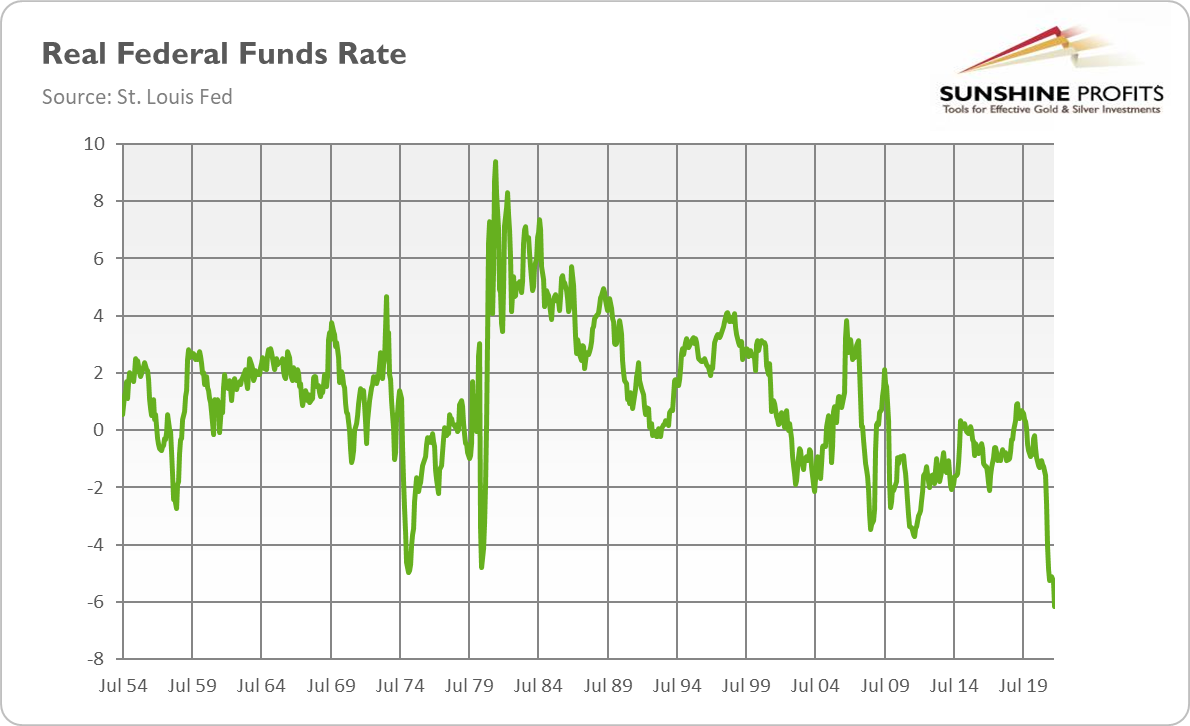
What is important here is that even when the Fed raises the federal funds rate by one percentage point next year, and even when inflation declines by another two percentage points, the real federal funds rate will increase to only -3%, so it will stay deeply in negative territory. Surely, the upward direction should be negative for gold prices, and the bottom in real interest rates would be a strong bearish signal for gold. However, rates remaining well below zero should provide some support or at least a decent floor for gold prices (i.e., higher than the levels touched by gold in the mid-2010s).
Thank you for reading today’s free analysis. If you enjoyed it, and would you like to know more about the links between the economic outlook, and the gold market, we invite you to read the December Gold Market Overview report. Please note that in addition to the above-mentioned free fundamental gold reports, and we provide premium daily Gold & Silver Trading Alerts with clear buy and sell signals. We provide these premium analyses also on a weekly basis in the form of Gold Investment Updates. In order to enjoy our gold analyses in their full scope, we invite you to subscribe today. If you’re not ready to subscribe yet though and are not on our gold mailing list yet, we urge you to sign up. It’s free and if you don’t like it, you can easily unsubscribe. Sign up today!
Arkadiusz Sieron, PhD
Sunshine Profits: Effective Investment through Diligence & Care.-----
Disclaimer: Please note that the aim of the above analysis is to discuss the likely long-term impact of the featured phenomenon on the price of gold and this analysis does not indicate (nor does it aim to do so) whether gold is likely to move higher or lower in the short- or medium term. In order to determine the latter, many additional factors need to be considered (i.e. sentiment, chart patterns, cycles, indicators, ratios, self-similar patterns and more) and we are taking them into account (and discussing the short- and medium-term outlook) in our Gold & Silver Trading Alerts.
-
Not Only Gold Lacks Energy – We All Do Now
December 17, 2021, 8:53 AMFirst a pandemic, then inflation, and now an energy crisis. Should you buy gold when preparing for the winter?
Brace yourselves, winter is coming! And this time I’m deadly serious, as there is a global energy crisis. Not only does gold lack energy to fuel its rally right now, but people from all over the world lack it to fuel their operations and to heat their houses. Apparently, the coronavirus pandemic wasn’t enough, so we also have to deal with inflation, supply bottlenecks, and the energy crisis. I guess there is nothing else to do now but wait for the frogs to start falling from the sky.
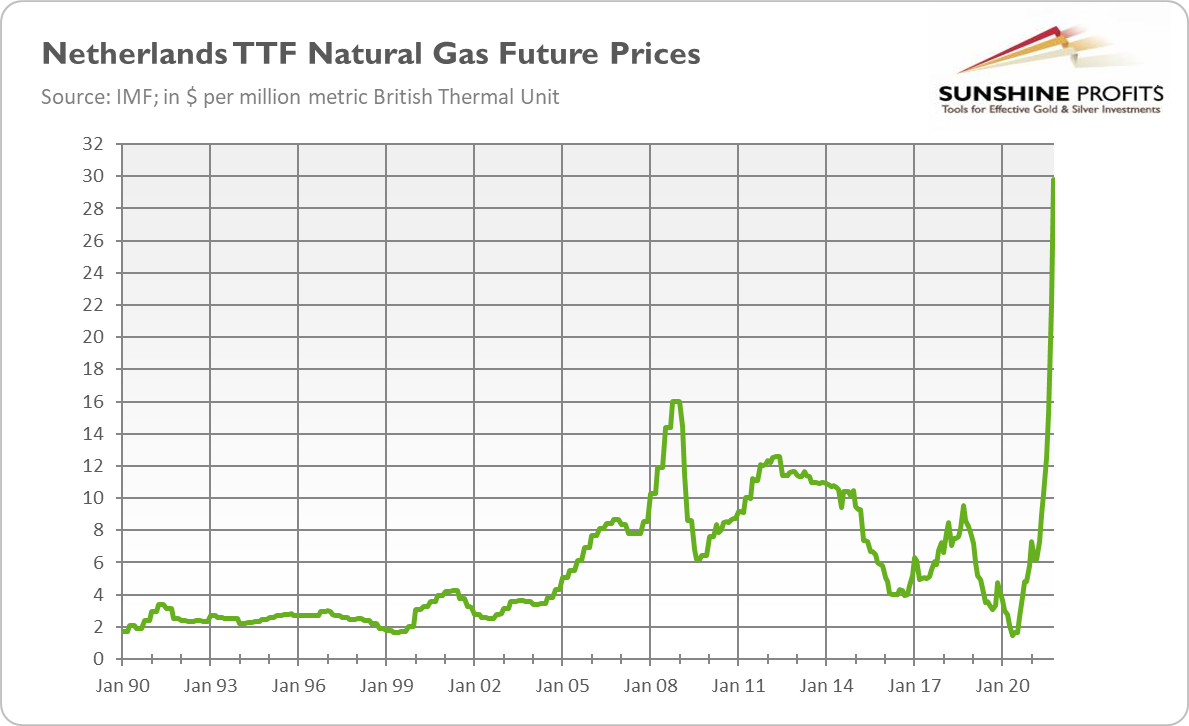
But let’s not give the gods ideas and focus on the energy crisis today. What is it about? A picture is worth a thousand words, so please take a look at the chart below, which presents the Dutch Title Transfer Facility, Europe’s leading benchmark for natural gas prices. As you can see, future prices for European natural gas have skyrocketed to a record level in October 2021, surging several times from their low in May 2020. The persistence and global dimension of these price spikes are unprecedented, as natural gas prices have also surged in Asia and America (although to a lesser degree).
What caused such a spike? Well, as a trained economist, I cannot resist answering that it’s a matter of demand and supply! Yeah, thank you, Captain Obvious, but could you be a little more specific? Sure, so on the demand side, we have to mention a fast recovery from the epidemic and cold fall that increased the use of energy. Oh, and don’t forget about the ultra-low interest rates and the increase in the money supply that boosted spending on practically everything. The increased demand for energy is hardly surprising in such conditions.
On the supply side, there were unpredictable breakdowns of gas infrastructure in Russia and Norway that decreased deliveries. The former country reduced its exports due to political reasons. What’s more, the reduction in the supply of CO2 emission rights and unfavorable weather didn’t help. The windless conditions in Europe generated little wind energy, while drought in Brazil reduced hydropower energy.
More fundamentally, the decline in energy prices in response to the economic crisis of 2020 prompted many producers to stop drilling and later supply simply didn’t catch up with surging demand. You can also add here the political decisions to move away from nuclear and carbon energy in some countries.
Last but not least, the butterfly’s wings flapped in China. Coal production in that country plunged this year amid a campaign against corruption and floods that deluged some mines. Middle Kingdom therefore began to buy significant amounts of natural gas, sharply increasing its prices. China’s ban on importing coal from Australia, of course, didn’t help here.
Great, but what does the energy crisis imply for the global economy and the gold market? First, shortages of energy could be a drag on global GDP. The slowdown in economic growth should be positive for gold, as it would bring us closer to stagflation. Second, the energy crisis could cause discontent among citizens and strengthen the populists. People are already fed up with pandemics and high inflation, and now they have to pay much higher energy bills. Just imagine how they will cheer when blackouts occur.
Third, the surge in natural gas prices could support high producer and consumer inflation. We are already observing some ripple effects in the coal and oil markets that could also translate into elevated CPI numbers. Another inflationary factor is power shortages in China, as they will add to the supply disruptions we are currently facing. All this implies more persistent high inflation, which should provide support for the yellow metal as an inflation hedge, although it also increases the odds of a more hawkish Fed, which is rather negative for gold.
It’s true that a replay of the 1970s-like energy crisis is remote, as today’s economies are much less energy-consuming and dependent on fossil fuels. However, the worst is possibly yet to come. After all, winter hasn’t arrived yet – and it could be another harsh one, especially given that La Niña is expected to be present for the second year in a row. Meanwhile, gas stocks are unusually low. You can connect the dots.
So far, gold has rather ignored the unfolding energy crisis, but we’ve already seen that market narratives can change quickly. It’s therefore possible that prolonged supply disruption and high inflation could change investors’ attitude toward the yellow metal at some point. The weak gold’s reaction stems from the limited energy crisis in the US and from the focus on the Fed’s tightening cycle. But investors’ attention can shift, especially when the Fed starts hiking federal funds rate. Brace yourselves!
Thank you for reading today’s free analysis. If you enjoyed it, and would you like to know more about the links between the economic outlook, and the gold market, we invite you to read the December Gold Market Overview report. Please note that in addition to the above-mentioned free fundamental gold reports, and we provide premium daily Gold & Silver Trading Alerts with clear buy and sell signals. We provide these premium analyses also on a weekly basis in the form of Gold Investment Updates. In order to enjoy our gold analyses in their full scope, we invite you to subscribe today. If you’re not ready to subscribe yet though and are not on our gold mailing list yet, we urge you to sign up. It’s free and if you don’t like it, you can easily unsubscribe. Sign up today!
Arkadiusz Sieron, PhD
Sunshine Profits: Effective Investment through Diligence & Care.-----
Disclaimer: Please note that the aim of the above analysis is to discuss the likely long-term impact of the featured phenomenon on the price of gold and this analysis does not indicate (nor does it aim to do so) whether gold is likely to move higher or lower in the short- or medium term. In order to determine the latter, many additional factors need to be considered (i.e. sentiment, chart patterns, cycles, indicators, ratios, self-similar patterns and more) and we are taking them into account (and discussing the short- and medium-term outlook) in our Gold & Silver Trading Alerts.
-
Another 4 Years of Gold’s Tricky Romance With Jay
December 10, 2021, 10:16 AM“Do you love me?”, asked gold. “Of course, my dear”, replied Jay, but his thoughts were with others: asset purchases tapering and interest rate hikes.
“It’s complicated” – this is how many people answer questions about their romantic lives. The relationship between gold and Jerome Powell is also not a clear one. As you know, in November, President Biden announced that he would reappoint Powell for the second term as the Fed Chair. It means that gold will have to live with Jerome under the same roof for another four years.
To say that gold didn’t like it is to say nothing. The yellow metal snapped and left the cozy living room of $1,850, slamming the door loudly. In less literary expressions, its price plunged from above $1,860 on November 19 to $1,782 on November 24, 2021, as the chart below shows.
The impulsive gold’s reaction to Powell’s renomination resulted from its failed dream about a love affair with Lael Brainard. She was considered a leading contender to replace Powell. The contender that would be more dovish and, thus, more supportive of gold prices.
However, is a hawkish dove a hawk? Is Powell really a hawk? Even if more hawkish than Brainard, he still orchestrated an unprecedentedly accommodative monetary policy in response to the pandemic-related economic crisis. It was none other than Powell who started to cut interest rates in 2019, a year before the epidemic outbreak. It was he who implemented an inflation-averaging regime that allowed inflation to run above the target. Right now, it’s also Powell who claims that the current high inflation is transitory, although it’s clear for almost everyone else that it’s more persistent. I wouldn’t call Powell a hawk then. He is rather a dove in a hawk’s clothing.
So, gold doesn’t have to suffer under Powell’s second term as the Fed Chair. Please take a look at the chart below, which shows gold’s performance in the period of 2017-2021. As you can see, the yellow metal gained about 34% during Powell’s first term as the chair of the Federal Reserve that started in February 2018 (or 40% since Trump’s November 2017 nomination of the Fed).
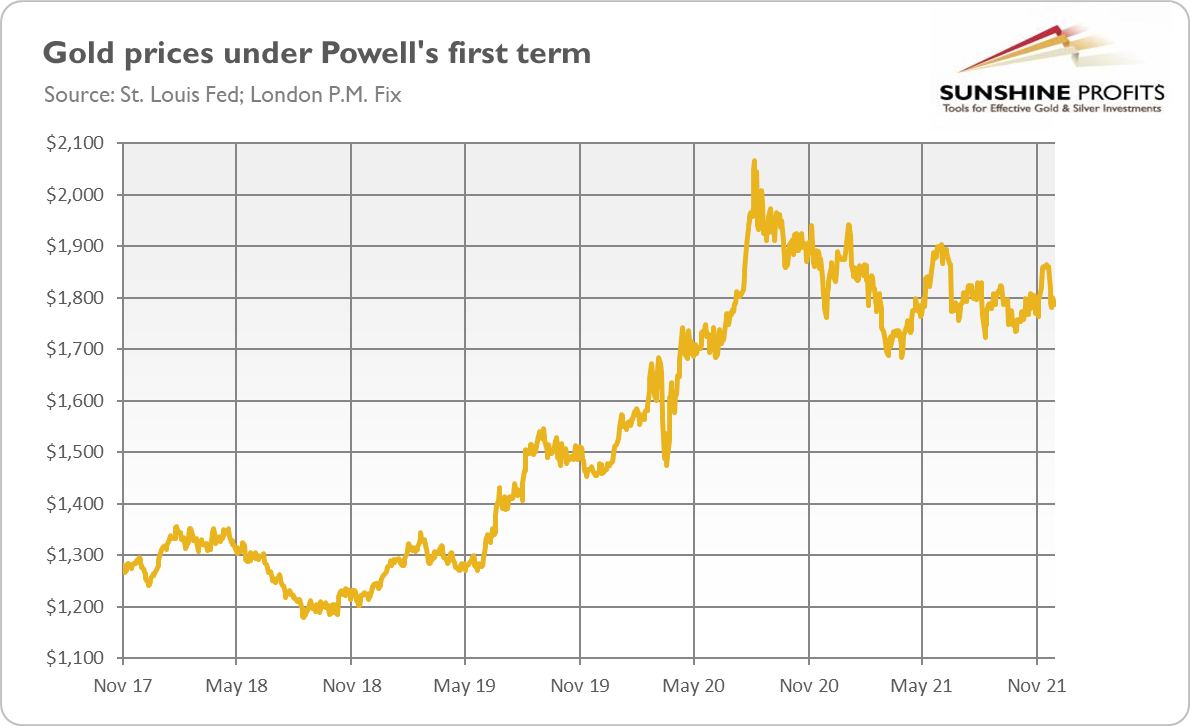
Not bad! Actually, gold performed much better back then than under Yellen’s term as the Fed Chair. During her tenure, which took place in 2014-2018, the yellow metal was traded sideways, remaining generally in a corridor between $1,100-$1,300.
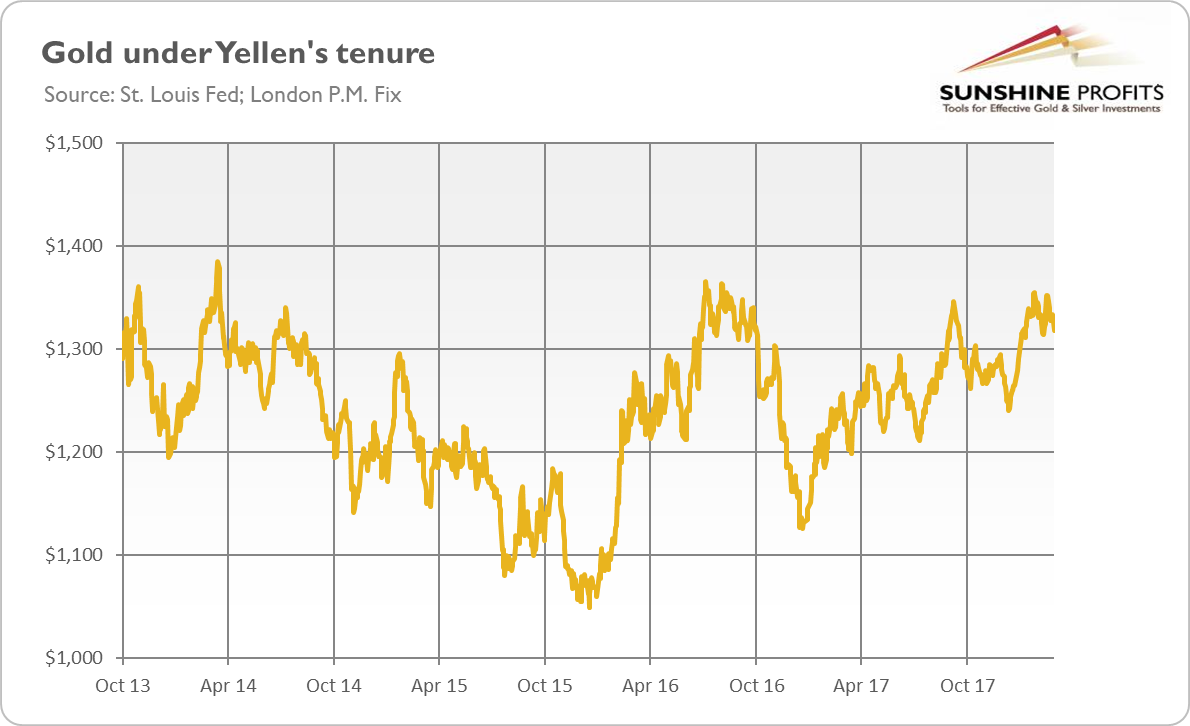
I’m not saying that Yellen despised gold, while Powell loves it. My point is that gold’s performance during the tenures of Fed Chairs varies along with changes in the macroeconomic environment in which they act and the monetary stance they adopt. Gold suffered strongly until December 2015, when Yellen finally started hiking the federal funds rate. It then rebounded, only to struggle again in 2018 amid an aggressive tightening cycle. However, at the end of that year it started to rally due to a dovish shift within the Fed, and, of course, in a lagged response to unprecedented fiscal and monetary actions later in 2020.
I have bad and good news here. The former is that the macroeconomic environment during Powell’s second term could be more inflationary, demanding more hawkish actions. The Fed has already started tapering of its quantitative easing, and bets are accumulating that it could start hiking interest rates somewhere around mid-2022. What’s more, the continuation of Powell’s leadership ensures more stability and provides markets with more certainty about what to expect from the Fed in the coming years. This is bad news for safe-haven assets such as gold.
Last but not least, the composition of the FOMC is going to shift toward the hawkish side. This is because some strong doves, such as Daly and Evans, are out, while some notable hawks, such as George, Mester (and also Bullard), are among the voting members in 2022. Gold may, therefore, find itself under downward pressure next year, especially in its first half.
On the other hand, the current FOMC expresses clearly dovish bias. With mammoth public debt and elevated asset prices, aggressive tightening would simply be very risky from a financial and political point of view. So, the Fed is likely to generally remain behind the curve. By the way, Biden not only reappointed Powell for the second term as Fed Chair, but he also appointed Brainard as Vice-Chair. We also can’t exclude that Biden agreed to Powell’s second term only if he conducts “appropriate” monetary policy.
Democratic Senator Elizabeth Warren once called Powell “a dangerous man.” Well, in a way, it’s true, as powerful people can be dangerous. However, history shows that Powell doesn’t have to be a threat to gold. After all, he is not a hawk in the mold of Paul Volcker, but merely a hawkish dove, or a dove that will have to normalize the crisis monetary policy and curb inflation.
In the upcoming months, gold may struggle amid prospects of more interest rates hikes and likely strengthened hawkish rhetoric from the Fed. However, precious metals investors often sell the rumor and buy the fact. So, when the US central bank finally delivers them, better times may come for the yellow metal, and gold and Jay could live happily ever after. The End.
Thank you for reading today’s free analysis. If you enjoyed it, and would you like to know more about the links between the economic outlook, and the gold market, we invite you to read the December Gold Market Overview report. Please note that in addition to the above-mentioned free fundamental gold reports, and we provide premium daily Gold & Silver Trading Alerts with clear buy and sell signals. We provide these premium analyses also on a weekly basis in the form of Gold Investment Updates. In order to enjoy our gold analyses in their full scope, we invite you to subscribe today. If you’re not ready to subscribe yet though and are not on our gold mailing list yet, we urge you to sign up. It’s free and if you don’t like it, you can easily unsubscribe. Sign up today!
Arkadiusz Sieron, PhD
Sunshine Profits: Effective Investment through Diligence & Care.-----
Disclaimer: Please note that the aim of the above analysis is to discuss the likely long-term impact of the featured phenomenon on the price of gold and this analysis does not indicate (nor does it aim to do so) whether gold is likely to move higher or lower in the short- or medium term. In order to determine the latter, many additional factors need to be considered (i.e. sentiment, chart patterns, cycles, indicators, ratios, self-similar patterns and more) and we are taking them into account (and discussing the short- and medium-term outlook) in our Gold & Silver Trading Alerts.
-
Inflation Risk: Milton Friedman Would Buy Gold Right Now
November 19, 2021, 10:22 AMPowell maintains that inflation is transitory, but the monetary theory of inflation suggests otherwise. So, elevated inflation could stay with us!,
Some economists downplay the risk stemming from elevated inflation, saying that comparisons to the 1970s style stagflation appear unfounded. They say that labor unions are weaker and economies are less dependent on energy than in the past, which makes inflationary risks less likely to materialize. Isabel Schnabel, Board Member of the European Central Bank, even compared the current inflationary spike to a sneeze, i.e., “the economy’s reaction to dust being kicked up in the wake of the pandemic and the ensuing recovery”. Are those analysts right?
Well, in a sense, they are. The economy is not in stagnation with little or no growth and a rising unemployment rate. On the contrary, the US labor market is continuously improving. It’s also true that both the bargaining power of workers and energy’s share in overall expenditure have diminished over the last fifty years.
However, general inflation is neither caused by wages nor energy prices. Higher wages simply mean lower profits, so although employees can consume more, employers can spend less. If wages are set above the potential market rates, then unemployment emerges - not inflation.
Similarly, higher energy prices affect the composition of spending, but not the overall monetary demand spent on goods and services. It works as follows: when the price of oil increases, people have to spend more money on oil (assuming the amount of consumed oil remains unchanged), which leaves less money available for other goods and services. So, the overall money spent on goods won’t change. As a consequence, the structure of relative prices will change, but widespread prices increases won’t happen.
In other words, Milton Friedman’s dictum remains valid: “Inflation is always and everywhere a monetary phenomenon in the sense that it is and can be produced only by a more rapid increase in the quantity of money than in output”. It’s quite a simple mechanism, even central bankers should be able to understand it: if the stock of goods remains unaltered while the stock of money increases, this, as Frank Shostak put it, “must lead to more money being spent on the unchanged stock of goods – an increase in the average price of goods”
Let’s look at the chart below, which displays the annual growth rates in the broad money supply (M2, red line) and in the CPI (green line). We can notice two important things. First, in the 1970s, the pace of broad money supply growth was relatively high, as it reached double-digit values at some point. As a consequence, inflation accelerated, jumping above 10% for a while. In other words, stagflation was born.
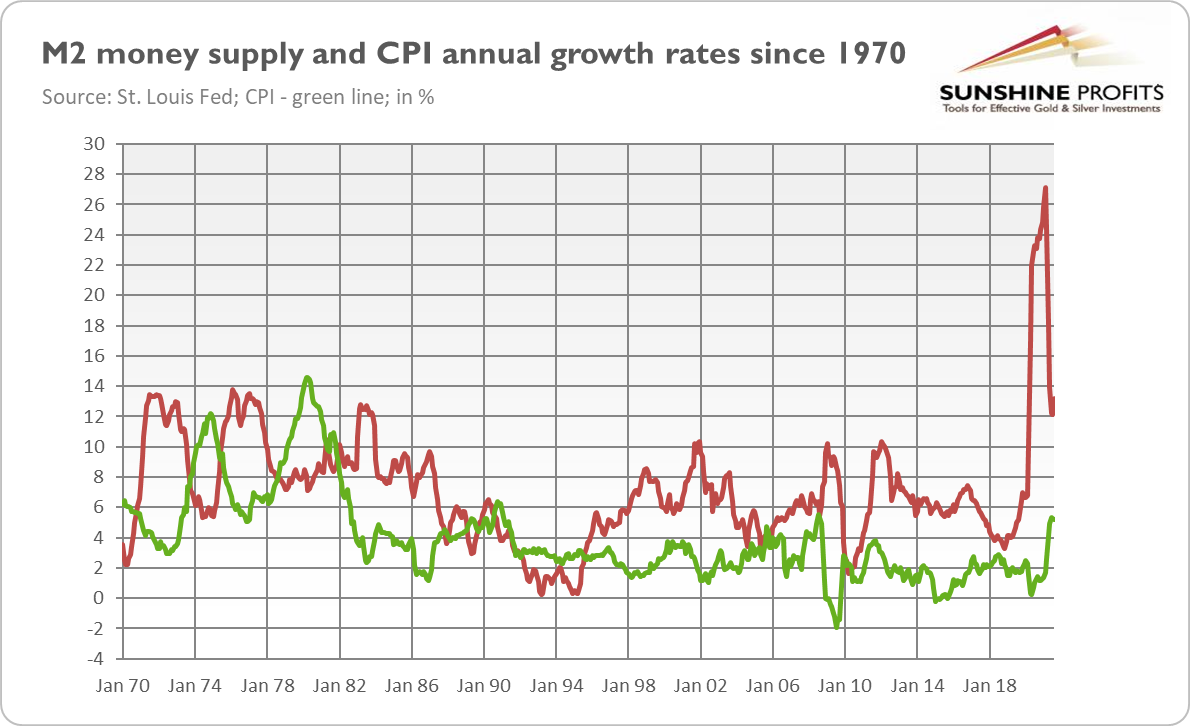
Since then, the rate of growth in the money supply never reached double-digit numbers on a prolonged basis, including the Great Recession, so high inflation never materialized. And then the pandemic came. In March 2020, the money supply growth rate crossed the 10% threshold and never came back. In February 2021, it reached its record height of 27.1%. The pace of growth in the M2 money aggregate has slowed down since then, dropping to a still relatively high rate of 13%. This is a rate that is almost double the pre-pandemic level (6.8% in February 2020) and the long-term average (7.1% for the 1960-2021 period ). So, actually, given the surge in the broad money supply and the monetary theory of inflation, rapidly rising prices shouldn’t be surprising at all.
Second, there is a lag between the money supply growth and the increase in inflation rates. That’s why some analysts don’t believe in the quantity theory of money – there is no clear positive correlation between the two variables. This is indeed true – but only when you take both variables from the same periods. The correlation coefficient becomes significant and positive when you take inflation rates with a lag of 18-24 months behind the money supply. As John Greenwood and Steve Hanke explain in opinion for Wall Street Journal,
According to monetarism, asset-price inflation should have occurred with a lag of one to nine months. Then, with a lag of six to 18 months, economic activity should have started to pick up. Lastly, after a lag of 12 to 24 months, generalized inflation should have set in.
If this relationship is true, then inflation won’t go away anytime soon. After all, the money supply accelerated in March 2020 and peaked in February 2021, growing at more than four times the “optimal” rate that would keep inflation at the 2-percent target, according to Greenwood and Hanke. In line with the monetarist description, the CPI rates accelerated in March 2021, exactly one year after the surge in the money supply. So, if this lag is stable, the peak in inflation rates should happen in Q1 2022, and inflation should remain elevated until mid-2022 at least.
What does it mean for the gold market? Well, if the theory of inflation outlined above is correct, elevated inflation will stay with us for several more months. Therefore, it’s not transitory, as the central bank tells us. Instead, inflation should remain high for a while, i.e., as long as the money supply growth won’t slow down and go back below 10% on a sustained basis. What’s more, the velocity of money, which plunged when the epidemic started, is likely to rise in the coming months, additionally boosting inflation.
So, I would say that Milton Friedman would probably forecast more persistent inflation than Jerome Powell, allocating some of his funds into the yellow metal. Gold is, after all, considered to be an inflation hedge, and it should appreciate during the period of high and rising inflation. Although so far gold hasn’t benefited from higher inflation, this may change at some point. Actually, investors’ worries about inflation intensified in October, and gold started to show some reaction to the inflationary pressure. My bet is that the next year will be better for gold than 2021: the Fed’s tightening cycle will already be inaugurated, and thus traders will be able to focus on inflation, possibly shifting the allocation of some of their funds into gold as a safe-haven asset.
Thank you for reading today’s free analysis. If you enjoyed it, and would you like to know more about the links between the economic outlook, and the gold market, we invite you to read the November Gold Market Overview report. Please note that in addition to the above-mentioned free fundamental gold reports, and we provide premium daily Gold & Silver Trading Alerts with clear buy and sell signals. We provide these premium analyses also on a weekly basis in the form of Gold Investment Updates. In order to enjoy our gold analyses in their full scope, we invite you to subscribe today. If you’re not ready to subscribe yet though and are not on our gold mailing list yet, we urge you to sign up. It’s free and if you don’t like it, you can easily unsubscribe. Sign up today!
Arkadiusz Sieron, PhD
Sunshine Profits: Effective Investment through Diligence & Care.-----
Disclaimer: Please note that the aim of the above analysis is to discuss the likely long-term impact of the featured phenomenon on the price of gold and this analysis does not indicate (nor does it aim to do so) whether gold is likely to move higher or lower in the short- or medium term. In order to determine the latter, many additional factors need to be considered (i.e. sentiment, chart patterns, cycles, indicators, ratios, self-similar patterns and more) and we are taking them into account (and discussing the short- and medium-term outlook) in our Gold & Silver Trading Alerts.
-
Will Evergrande Make Gold Grand?
November 12, 2021, 12:32 PMEvergrande’s debt issues are a symptom of China’s deep structural problems. If the crisis spills over wider, gold may benefit, but we are still far from such a scenario.
Beijing, we have a problem! Evergrande, one of China’s largest real estate developers and biggest companies in the world, is struggling to meet the interest payments on its debts. As the company has more than $300 billion worth of liabilities, its recent liquidity problems have sparked fears in the financial markets. They also triggered a wave of questions: will Evergrande become a Chinese Lehman Brothers? Is the Chinese economy going to collapse or stagnate? Will Evergrande make gold grand?
The answer to the first question is: no, the possible default of Evergrande likely won’t cause a global contagion in the same way as Lehman Brothers did. Why? First of all, Lehman Brothers collapsed because of the run in the repo market and the following liquidity crisis. As the company was exposed to subprime assets, investors lost confidence and the bank lost its access to cheap credit. Lehman Brothers tried to sell its assets, which plunged the prices of a wide range of financial assets, putting other institutions into trouble.
Unlike Lehman Brothers, Evergrande is not an investment bank but a real estate developer. It doesn’t have so many financial assets, and it’s not a key player in the repo market. The exposure of important global financial institutions to Evergrande is much smaller. What’s more, we haven’t seen a credit freeze yet, nor an endless wave of selling across almost all asset classes, which took place during the global financial crisis of 2007-2009.
Given that the Lehman Brothers’ bankruptcy was ultimately positive for gold (although the price of the yellow metal declined initially during the phase of wide sell-offs), the fact that Evergrande probably doesn’t pose similar risks to the global economy could be disappointing for gold bulls.
However, gold bulls could warmly welcome my answer to the second question: the case of Evergrande reveals deep and structural problems of China’s economy, namely its heavy reliance on debt and the real estate sector. As the chart below shows, the debt of the private non-financial sector has increased from about 145% of GDP after the Great Recession to 220% in the first quarter of 2021.
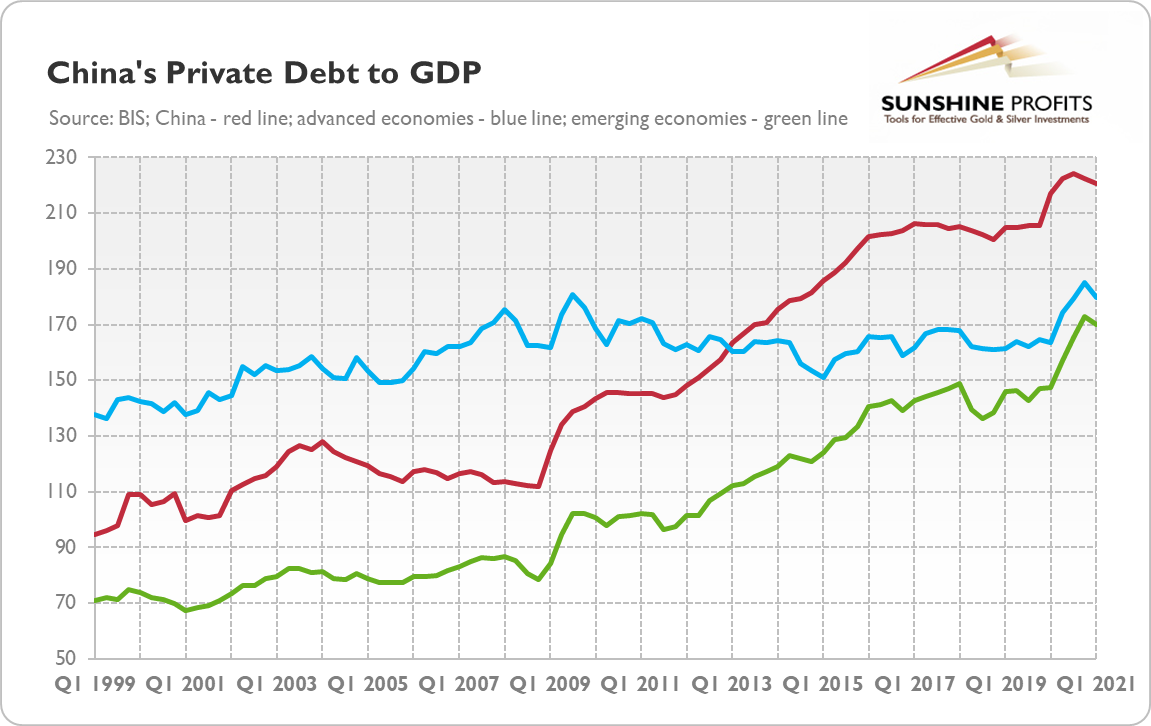
So, China has experienced a massive increase in debt since the global financial crisis, reaching levels much higher than in the case of other economies. The rise in indebtedness allowed China to continue its economic expansion, but questions arose about the quality and sustainability of that growth. As Daniel Lacalle points out,
The problem with Evergrande is that it is not an anecdote, but a symptom of a model based on leveraged growth and seeking to inflate GDP at any cost with ghost cities, unused infrastructure, and wild construction.
Indeed, the levels and rates of growth of China’s private debt are similar to the countries that have experienced spectacular financial crises, such as Japan, Thailand, or Spain. But the significance of China’s real estate sector is much higher. According to the paper by Rogoff and Yang, the real-estate sector accounts for nearly 30% of China’s GDP.
On the other hand, China has a relatively high savings rate, while debt is mostly of domestic nature. China’s financial ties to the world are not very strong, which limits the contagion risks. What is more, the Chinese government has acknowledged the problem of excessive debts in the private sector and started a few years ago making some efforts to curb it. The problems of Evergrande can be actually seen as the results of these deleveraging attempts.
Therefore, I’m not sure whether China’s economy will collapse anytime soon, but its pace of growth is likely to slow down further. The growth model based on debt and investments (mainly in real estate) has clearly reached its limit. In other words, the property boom must end.
Rogoff and Yang estimate that “a 20% fall in real estate activity could lead to a 5-10% fall in GDP”. Such growth slowdown and inevitable adjustments in China’s economy will have significant repercussions on the global economy, as – according to some research – China’s construction sector is now the most important sector for the global economy in terms of its impact on global GDP.
In particular, the prices of commodities used in the construction sector may decline and the countries that export to China may suffer. Given that China was the engine of global growth for years, it will also slow down, and, with lower production, it’s possible that inflation will be higher.
Finally, what do the problems of China’s real estate sector imply for the gold market? Well, in the short term, not so much. Gold is likely to remain under downward pressure resulting from the prospects of the Fed’s tightening cycle.
However, if Evergrande’s problems spill over, affecting China’s economy or (a bit later) even the global economy, the situation may change. Other Chinese developers (such as Fantasia or Sinic) also have problems with debt payments, as investors are not willing to finance new issues of bonds.
In such a scenario, the demand for gold as a safe-haven asset might increase, although investors have to remember that the initial rush could be into cash (the US dollar) rather than gold. Unless China’s problems pose a serious threat to the American economy, the appreciation of the greenback will likely counterweigh the gains from safe-haven inflows into gold. So far, financial markets have remained relatively undisturbed by the Evergrande case. Nevertheless, I will closely monitor any upcoming developments in China’s economy and their possible effects on the gold market.
Thank you for reading today’s free analysis. If you enjoyed it, and would you like to know more about the links between the economic outlook, and the gold market, we invite you to read the November Gold Market Overview report. Please note that in addition to the above-mentioned free fundamental gold reports, and we provide premium daily Gold & Silver Trading Alerts with clear buy and sell signals. We provide these premium analyses also on a weekly basis in the form of Gold Investment Updates. In order to enjoy our gold analyses in their full scope, we invite you to subscribe today. If you’re not ready to subscribe yet though and are not on our gold mailing list yet, we urge you to sign up. It’s free and if you don’t like it, you can easily unsubscribe. Sign up today!
Arkadiusz Sieron, PhD
Sunshine Profits: Effective Investment through Diligence & Care.-----
Disclaimer: Please note that the aim of the above analysis is to discuss the likely long-term impact of the featured phenomenon on the price of gold and this analysis does not indicate (nor does it aim to do so) whether gold is likely to move higher or lower in the short- or medium term. In order to determine the latter, many additional factors need to be considered (i.e. sentiment, chart patterns, cycles, indicators, ratios, self-similar patterns and more) and we are taking them into account (and discussing the short- and medium-term outlook) in our Gold & Silver Trading Alerts.
-
Why Isn’t Gold Rallying Along With Inflation?
November 5, 2021, 10:46 AMInflation is high and doesn’t seem to be going away anytime soon. However, gold is not rising. The question is – what does the Fed have to do with it?
Inflation is not merely transitory, and that’s a fact. Why then isn’t gold rallying? Isn’t it an inflation-hedge? Well, it is - but gold is a lazy employee. It shows up at work only when inflation is high and accelerating; otherwise, it refuses to get its golden butt up and do its job.
All right, fine, but inflation is relatively high! So, there have to be other reasons why gold remains stuck around $1,800. First of all, central banks are shifting their monetary policy. Global easing has ended, global tightening is coming! Actually, several central banks have already tightened their stance. For example, among developed countries, New Zealand, Norway, and South Korea have raised interest rates. Brazil, the Czech Republic, Hungary, Mexico, Poland, Romania, and Russia are in the club of monetary policy hawks as well. Even the bank of England could hike its policy rate this year, while the Fed has only announced tapering of its asset purchases.
So, although central banks will likely maintain their dovish bias and real interest rates will stay negative, the era of epidemic ultra-loose monetary policy is coming to an end. We all know that neither the interest rates nor the central banks’ balance sheets will return to the pre-pandemic level, but the direction is clear: central banks are starting tightening cycles, no matter how gentle and gradual they will be. This means that monetary policy is no longer supportive of gold.
The same applies to fiscal policy. It remains historically lax despite fiscal stimulus being pulled back. Even though Uncle Sam ran a fiscal deficit of $2.8 trillion in fiscal year 2021 - almost three times that of fiscal year 2019 ($0.98 trillion) - it was 12% lower than in fiscal year 2020 ($3.1 trillion). This implies that the fiscal policy is also tightening (despite the fact that it remains extravagantly accommodative), which is quite a headwind for gold. Investors should always look at directional changes, not at absolute levels.
What’s more, we are still far from stagflation. We still experience both high inflation and fast GDP growth, as well as an improving labor market. As a reminder, the unemployment rate declined from 5.2% in August to 4.8% in September. The fact that the labor market continues to hold up relatively well is the reason why the so-called Misery Index, i.e., the sum of inflation and unemployment rates, remains moderate despite high inflation. It amounted to 10.19 in September, much below the range of 12.5-20 seen during the Great Inflation of the 1970s (see the chart below).
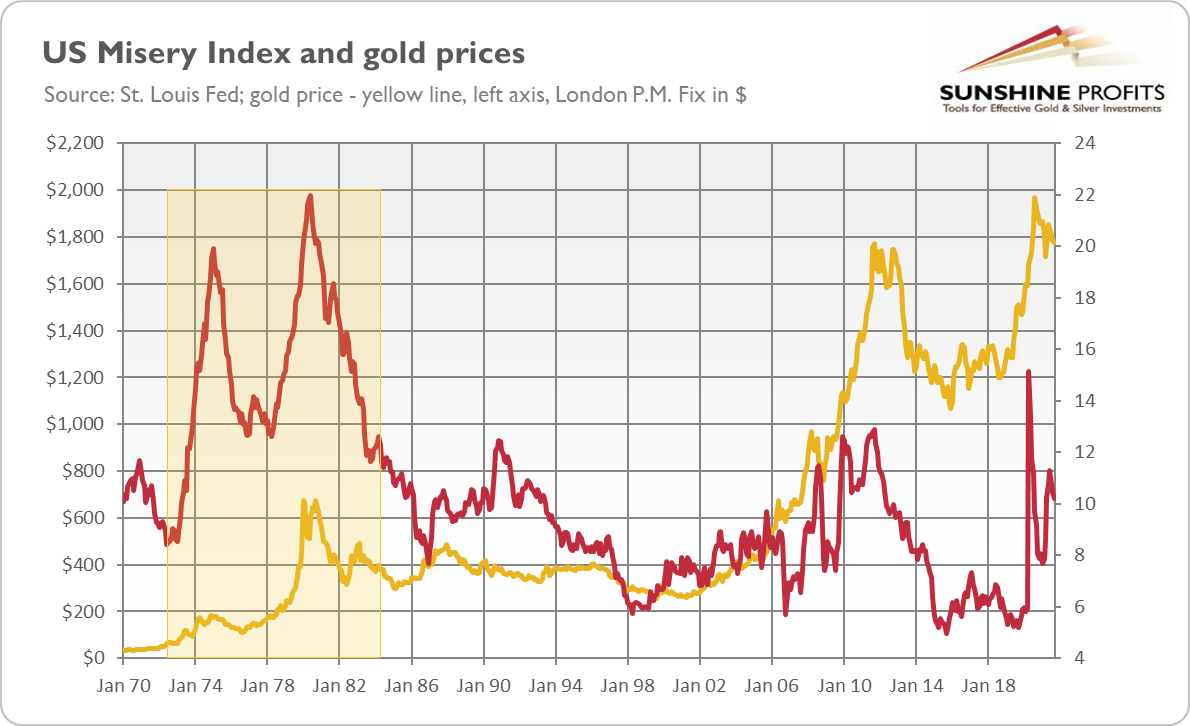
So, the dominant narrative is about both inflation and growth. When people got vaccines, markets ceased to worry about coronavirus and started to expect a strong recovery. Commodity and equity prices are rising, as well as real interest rates. These market trends reflect expectations of more growth than inflation – expectations that hurt gold and made it get stuck around $1,800.
Having said that, the case for gold is not lost. Gold bulls should be patient. The growth is going to slow down, and when inflation persists for several months, the pace of real growth will decline even further, shifting the market narrative to worrying about inflation’s negative effects and stagflation. Gold should shine then.
Wait, when? Soon. The Fed’s tightening cycle could be a turning point. The US central bank has already announced tapering of quantitative easing, which could erase some downward pressure on gold resulting from the anticipation of this event. Additionally, please remember that every notable market correction coincided with the end of QE, and every recession coincided with the Fed’s tightening cycle. Moreover, don’t forget that gold bottomed in December 2015, just when the Fed started hiking the federal funds rate for the first time since the Great Recession, as the chart below shows.
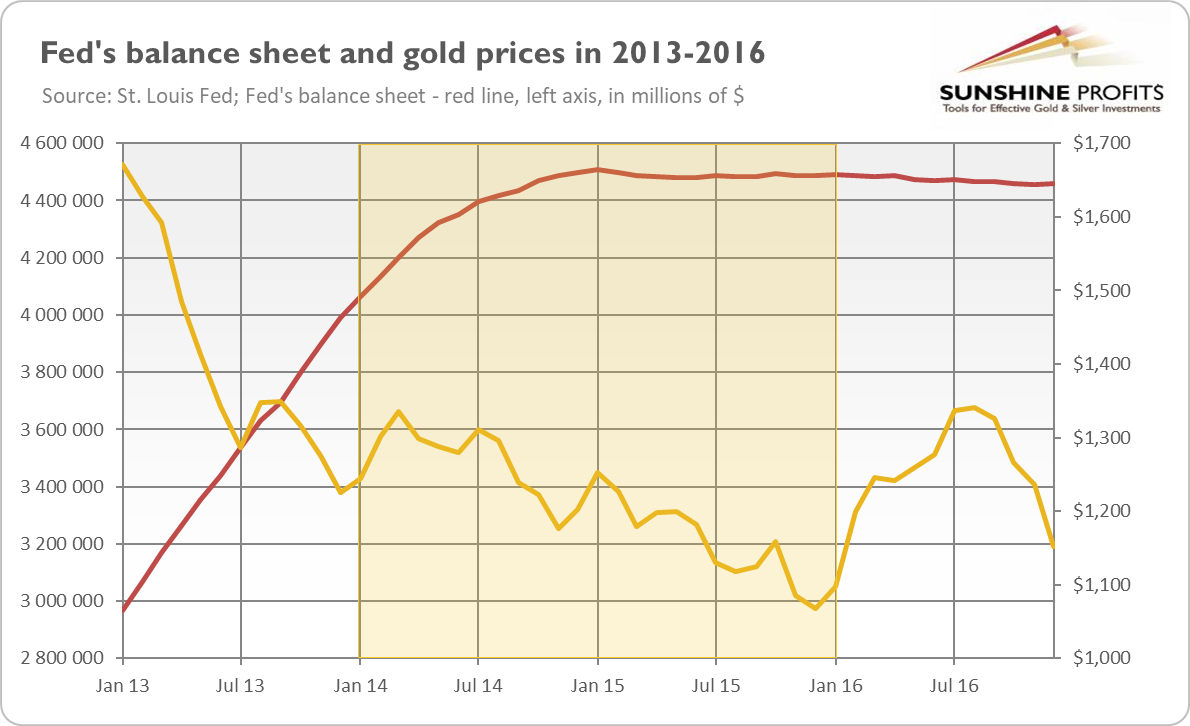
However, when it comes to tapering, the situation is more complicated. The previous tapering was announced in December 2013, started in January 2014, and ended in October 2014. As one can see in the chart above, the price of gold initially increased, but it remained in its downward trend until December 2015 when the Fed started hiking interest rates. Hence, if history is any guide, there are high odds that gold may struggle further for a while before starting to rally next year, which could happen even as soon as June 2022, when the markets expect the first hike in interest rates.
Thank you for reading today’s free analysis. If you enjoyed it, and would you like to know more about the links between the economic outlook, and the gold market, we invite you to read the November Gold Market Overview report. Please note that in addition to the above-mentioned free fundamental gold reports, and we provide premium daily Gold & Silver Trading Alerts with clear buy and sell signals. We provide these premium analyses also on a weekly basis in the form of Gold Investment Updates. In order to enjoy our gold analyses in their full scope, we invite you to subscribe today. If you’re not ready to subscribe yet though and are not on our gold mailing list yet, we urge you to sign up. It’s free and if you don’t like it, you can easily unsubscribe. Sign up today!
Arkadiusz Sieron, PhD
Sunshine Profits: Effective Investment through Diligence & Care.-----
Disclaimer: Please note that the aim of the above analysis is to discuss the likely long-term impact of the featured phenomenon on the price of gold and this analysis does not indicate (nor does it aim to do so) whether gold is likely to move higher or lower in the short- or medium term. In order to determine the latter, many additional factors need to be considered (i.e. sentiment, chart patterns, cycles, indicators, ratios, self-similar patterns and more) and we are taking them into account (and discussing the short- and medium-term outlook) in our Gold & Silver Trading Alerts.
-
Will Pandexit Support Gold?
October 22, 2021, 8:48 AMPandemic will cease to be a problem at some point. It will leave the world with other problems though, and they could be supportive of gold.
Maybe it’s not the best timing, given the spread of the Delta variant of the coronavirus, but let’s be optimistic and assume that we will soon leave the epidemic behind us. It goes without saying that the pandexit, or the exit of the Covid-19 pandemic from the world, is believed to be positive for the global economy.
However, even if the pandemic ends, it will leave the world with many risks. As Agustín Carstens, Bank for International Settlements General Manager, has recently noted, “policymakers still face daunting challenges as we exit the pandemic”.
The first threat is, of course, that the pandemic won’t end anytime soon, as new variants could emerge, entailing further lockdowns, as well as monetary and fiscal stimulus. I cannot exclude it, but my bet is that the economic impact of new strains will be smaller, as people will be better adapted to the epidemic, while sanitary restrictions will be softer because people will be vaccinated and fed up with lockdowns.
The second risk is that inflation could rise further or turn out to be more persistent than expected. I analyzed this threat thoroughly earlier in the Gold Market Overview, so I don’t want to write too much about this issue here. However, I would like to point out that if high inflation persists, inflation expectations could become more “backward-looking” and increase more than anticipated. The central bank claims that inflation expectations remain well-anchored, as it enjoys anti-inflation credentials.
But the longer high inflation persists, the higher the odds that the central bank will lose its reputation when inflation expectations de-anchor. At some point, people will question the “transitory” character of inflation and increase their expectations. Why wouldn’t they, given that the Fed is openly telling that it has changed its inflation targeting regime toward one more tolerant of inflation above the target? The August 2020 Survey of Consumer Expectations published by the New York Fed is illustrating my point. The report shows that one-year and three-year consumer inflation expectations rose to new highs of 5.2% and 4.0%, respectively (see the chart below). What’s important, both increases were broad-based across age and income groups. Well-anchored, huh?
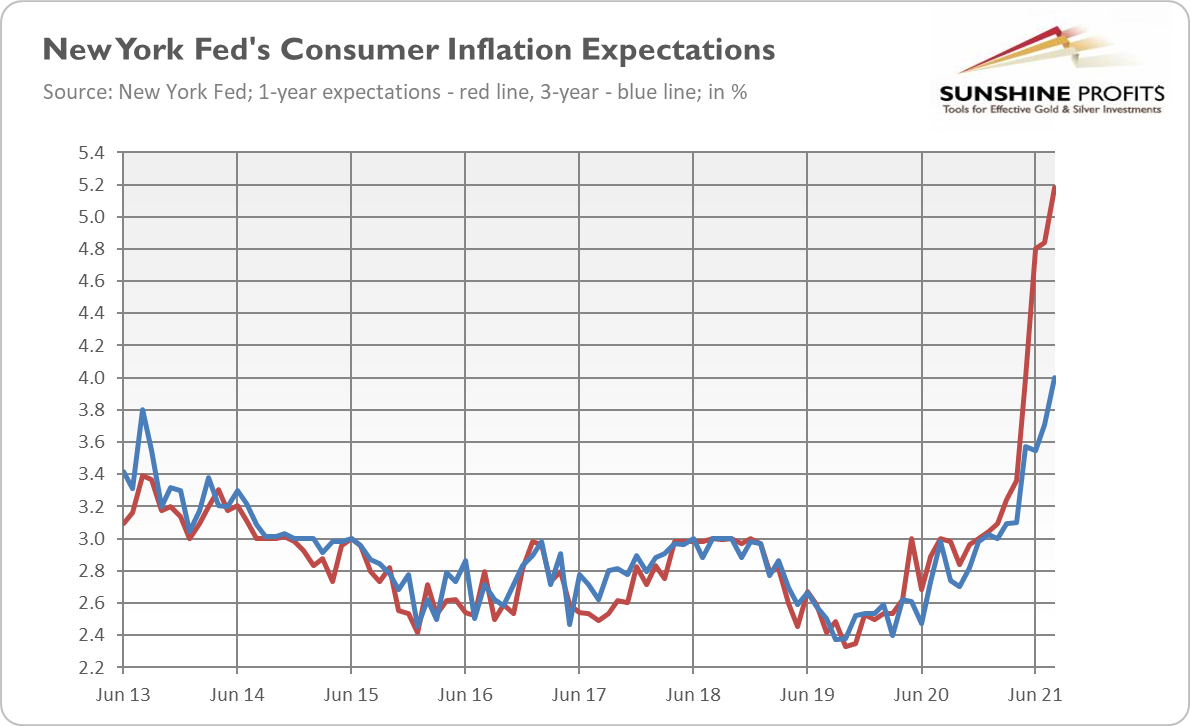
The third risk is the accumulation of debt. Private and public debts were very high already before the pandemic, but they surged even further since all this happened. In the second quarter of 2021, global debt rose to a new record high of $296 trillion, while the US total public debt increased to about $29 trillion, as the chart below shows. In relation to the GDP, the debt has moderated somewhat, but it remains much higher than before the pandemic. Such high indebtedness reduces the financial capacity to respond to new economic shocks in the future and raises the odds of debt distress, defaults, or even a full-blown debt crisis.
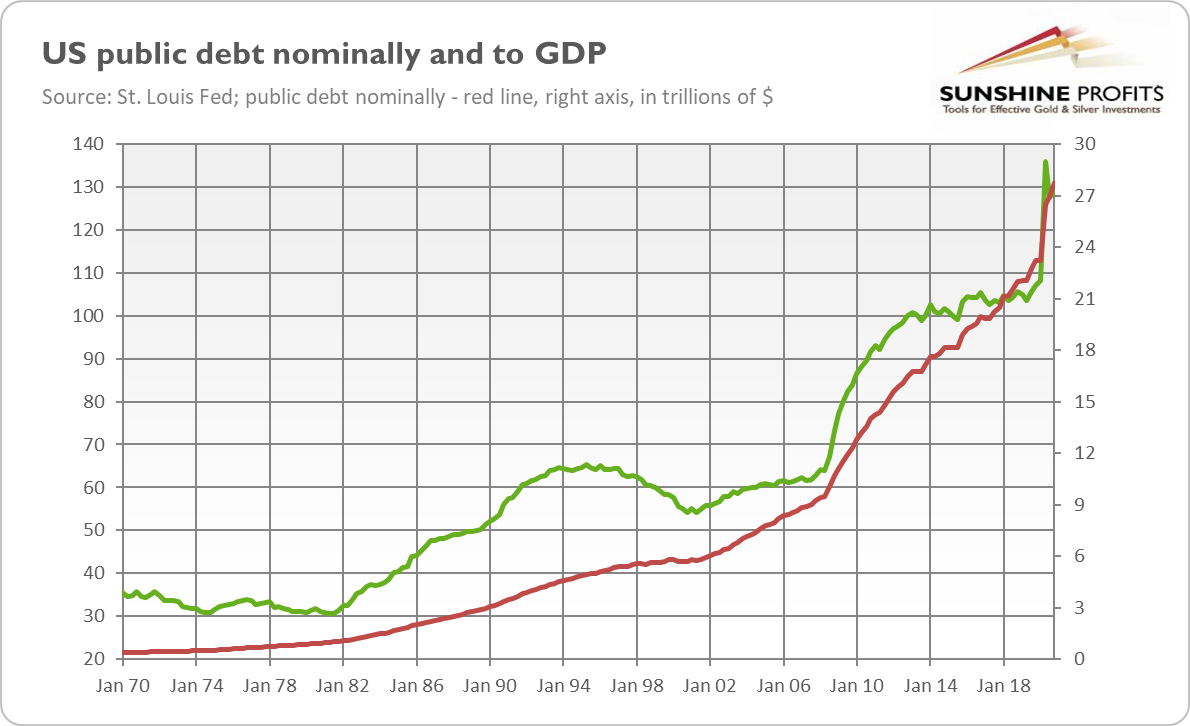
Excessive indebtedness not only entails risks on its own but also complicates the normalization of monetary policy. Although there is a mammoth pile of public debt, the burden of the costs is manageable because the interest rates are at ultra-low level. However, if the central bank hikes them, the debt-servicing costs will increase, upsetting the government. Importantly, the median maturity of the US government debt has effectively shortened, so the changes in short-term interest rates may be even more challenging for Uncle Sam. Let’s do some math. Given that the public debt is around 125% of the GDP (see the chart below), every percentage-point rise in interest rates implies 1.25 percentage-point growth in the fiscal deficit as a share of the GDP. I bet that the government won’t be happy seeing that.
What does it all imply for the gold market? Well, even if the pandemic ends (and we are still far from it), our economic problems won’t disappear. We won’t go back to the pre-pandemic normalcy, as the conditions are completely different. First of all, the debt and inflation are much higher. This creates a particularly unpleasant combination. You see, if inflation is not kept in check relatively early, the Fed most likely will have to jack up the federal funds rate to beat inflation later. The problem is that aggressive monetary policy tightening could boost the risk premiums and exacerbate debt problems, possibly even leading to a financial crisis.
Given all these risks, it seems unlikely to me that gold could get out of favor. However, these risks don’t have to materialize, and even if they do – I believe that we haven’t seen the full economic repercussions of the pandemic yet – it won’t happen tomorrow. So, it might be the case that gold will suffer first due to a shy tapering of quantitative easing, only to rally later in response to inflation and/or debt crisis.
Thank you for reading today’s free analysis. If you enjoyed it, and would you like to know more about the links between the economic outlook, and the gold market, we invite you to read the October Gold Market Overview report. Please note that in addition to the above-mentioned free fundamental gold reports, and we provide premium daily Gold & Silver Trading Alerts with clear buy and sell signals. We provide these premium analyses also on a weekly basis in the form of Gold Investment Updates. In order to enjoy our gold analyses in their full scope, we invite you to subscribe today. If you’re not ready to subscribe yet though and are not on our gold mailing list yet, we urge you to sign up. It’s free and if you don’t like it, you can easily unsubscribe. Sign up today!
Arkadiusz Sieron, PhD
Sunshine Profits: Effective Investment through Diligence & Care.-----
Disclaimer: Please note that the aim of the above analysis is to discuss the likely long-term impact of the featured phenomenon on the price of gold and this analysis does not indicate (nor does it aim to do so) whether gold is likely to move higher or lower in the short- or medium term. In order to determine the latter, many additional factors need to be considered (i.e. sentiment, chart patterns, cycles, indicators, ratios, self-similar patterns and more) and we are taking them into account (and discussing the short- and medium-term outlook) in our Gold & Silver Trading Alerts.
-
Inflation Has Already Peaked. Has Gold Peaked Too?
October 15, 2021, 8:59 AMInflation reached its peak in June, but it doesn’t mean it will go away. The more persistent it is, the higher the odds of a rosy outcome for gold.
The August CPI report makes it clear: inflation has already peaked. As the chart below shows, both the overall and core CPI have reached their fastest pace in June 2021. The former index surged 5.3% four months ago, while the latter soared 4.5%. Since then, we have been observing very gradual deceleration in the annual inflation rates.
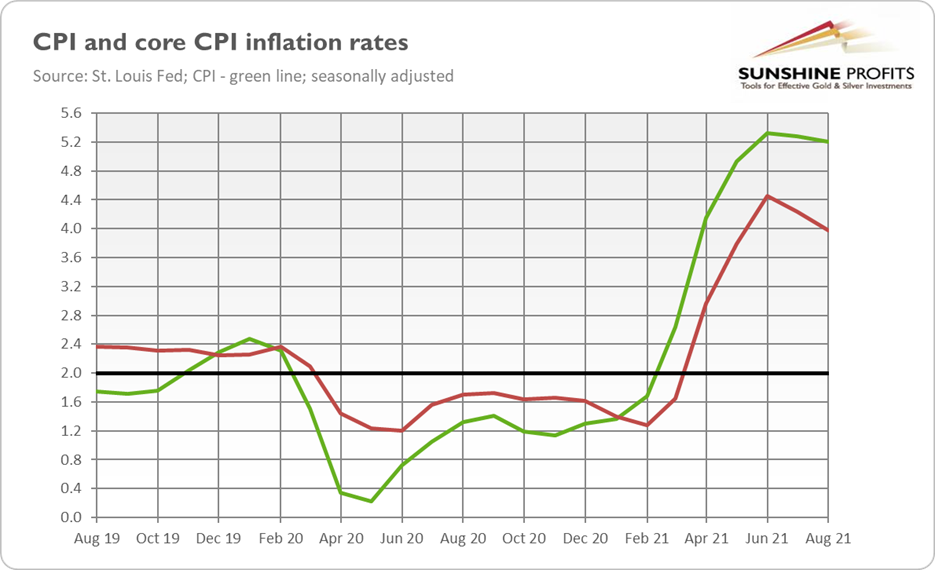
The noticed slowdown seems to confirm the central bank’s narrative that the inflationary surge is transitory. However, in a few past editions of the Fundamental Gold Report, I argued that the fact that inflation had peaked doesn’t mean that it would go away anytime soon. In particular, I pointed out the rallying Producer Price Index (as the supply-crisis is far from being resolved), the gradually rising index for shelter, and soaring home prices, which should translate into higher consumer prices in the future.
As the French adage goes, nothing lasts like the temporary. The policymakers always describe unpleasant developments as “transitory problems” (just think of all the taxes introduced only for a while!), as magical thinking that the troubles will somehow resolve themselves is much more convenient than confronting the harsh reality and taking decisive actions.
Of course, there is a grain of truth in the Fed’s line of thinking. After all, compared to the long run, not to mention the cosmological timescale, higher inflation will prove to be temporary. Yes, it was sarcasm, but Powell and his colleagues are, in a sense, right about transitory inflation.
You see, as the market saying goes, the cure for high prices is high prices. As you can recall from your economics 101 class, prices are set by supply and demand. And when prices rise, producers are willing to sell more, while consumers are willing to buy less. Hence, a surge in the price of a given commodity will result in reduced demand and/or boosted supply. As a result, the price will decrease. We have recently observed this mechanism in action in the lumber market. As the chart below shows, lumber surged during the post-pandemic recovery, doubling its price from February 2020 by May 2021, but now it’s just about 30% higher than before the pandemic.
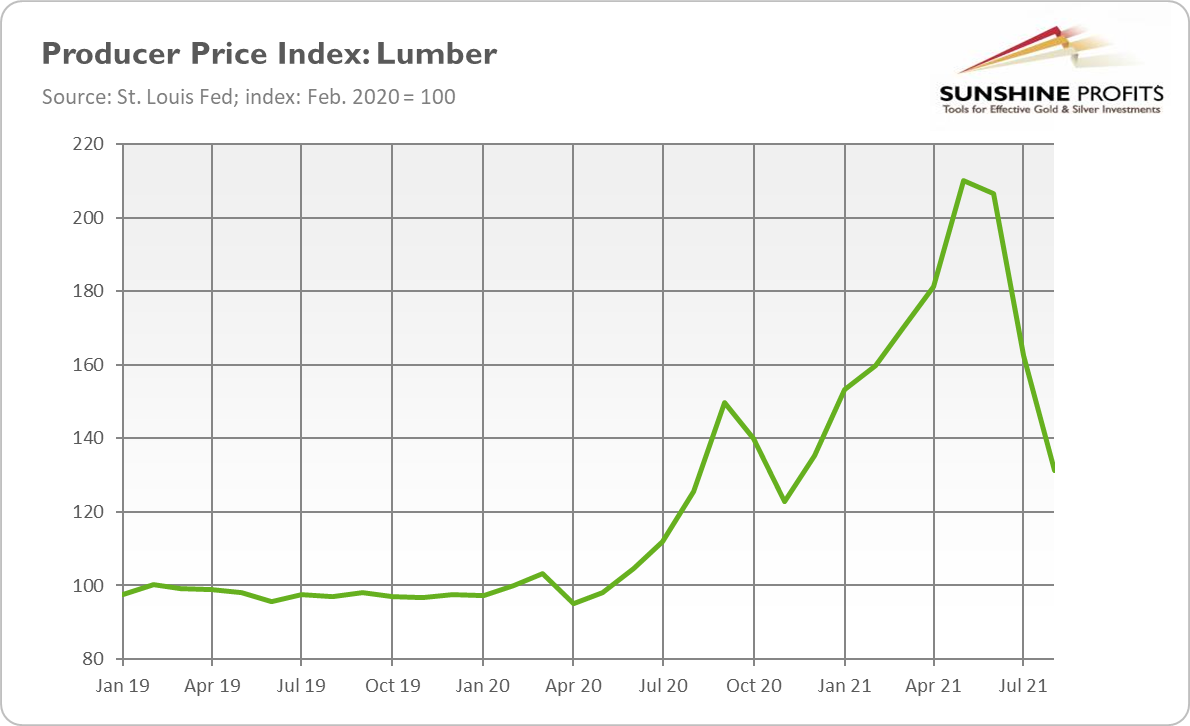
The chart doesn’t lie, does it? So, inflation is transitory, as high prices are indeed a cure for high prices. Lumber’s fate is what’s waiting for all goods. But not so fast. This mechanism works only under certain conditions. It clearly doesn’t apply to hyperinflation, where surges in prices cause a decline in demand for money (consumers lose faith in a currency and try to spend their money as quickly as possible) and, in turn, even stronger price surges.
Even more importantly, it applies only to market-specific supply issues, not to the general, economy-wide inflation. When higher prices are a result of idiosyncratic supply constraints, the market forces will work to bring the equilibrium back, curbing the price. For example, the producers of lumber could have outbid other entrepreneurs to obtain necessary inputs and expand their capacity to eliminate the shortage of lumber. However, when almost all prices go up, the situation is different, as all entrepreneurs cannot expand their capacities at the same time because all the inputs are scarce.
Why do we know that the current inflation is broad-based and also demand-related rather than caused merely by supply disruptions? Well, the obvious clue is simply the number of markets that are experiencing shortages and sharp price rallies. The supply-chain crisis is not limited to lumber and semiconductors, it covers practically all commodities and many intermediate goods.
In such a situation, the root cause of inflation must be excessive demand compared to supply. As I explained earlier in the Gold Market Overview, the consumer expenditures on goods surged 15% over the pandemic. Such an increase over a relatively short period turned out to be difficult to handle by entrepreneurs, especially under epidemic conditions, thus shortages emerged. But these supply-chain problems are ultimately demand-driven, as the supply-side of the economy simply cannot satisfy the consumers’ demand.
To be clear, this extra demand hasn’t emerged out of nothing. It’s happened due to a shift in expenditures from services into goods and also because it’s the child of the Fed’s easy monetary policy and lax fiscal policy. The broad money supply is about 33% greater than it was before the pandemic (see the chart below). The widened fiscal deficits financed checks to Americans, which made inflation less limited only to financial assets and more broad-based.
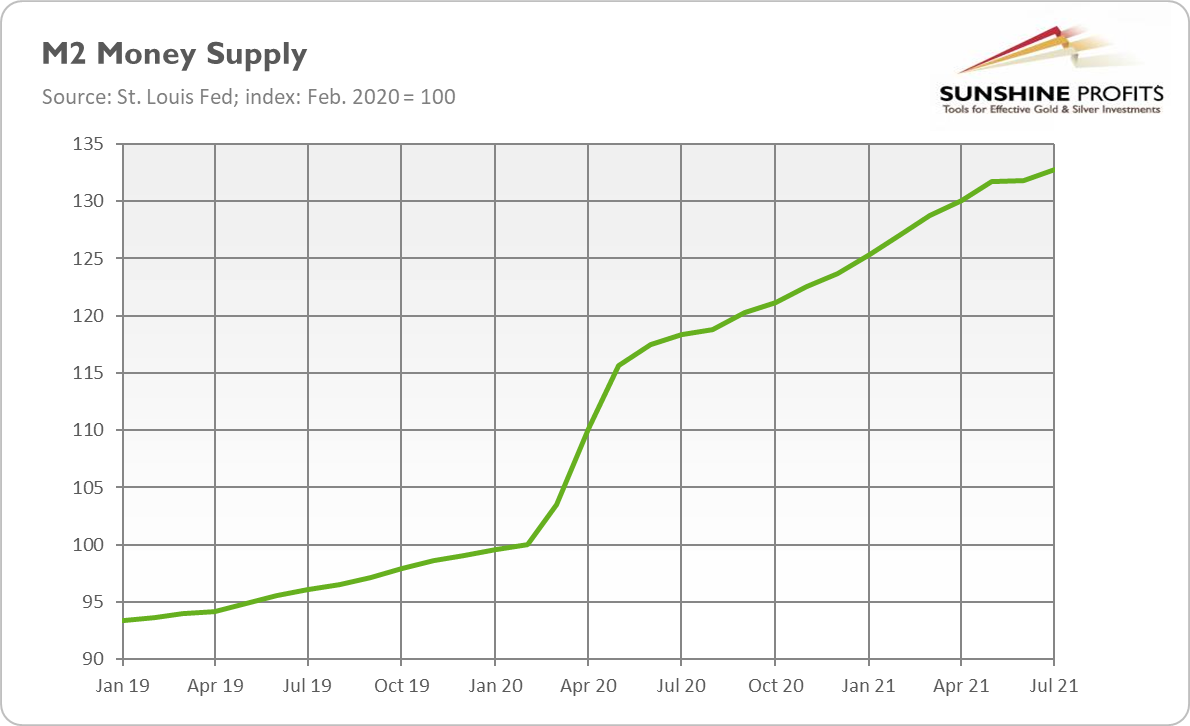
What does it all imply for the gold market? Well, the point is that the current inflation is more demand-driven than the Fed is ready to admit. As a result, my bet is that it will be more persistent than the central bank officially claims. More stubborn inflation may accelerate the Fed’s tightening cycle, which would hit the gold market.
On the other hand, persistent inflation could at some point rattle the markets, boosting the demand for gold as a safe-haven asset and an inflation hedge. High inflation also implies subdued real interest rates, which should support gold prices. Last but not least, the more persistent elevated inflation is, the higher the odds of inflationary expectations de-anchoring and stagflation taking place, in which gold should shine.
Thank you for reading today’s free analysis. If you enjoyed it, and would you like to know more about the links between the economic outlook, and the gold market, we invite you to read the October Gold Market Overview report. Please note that in addition to the above-mentioned free fundamental gold reports, and we provide premium daily Gold & Silver Trading Alerts with clear buy and sell signals. We provide these premium analyses also on a weekly basis in the form of Gold Investment Updates. In order to enjoy our gold analyses in their full scope, we invite you to subscribe today. If you’re not ready to subscribe yet though and are not on our gold mailing list yet, we urge you to sign up. It’s free and if you don’t like it, you can easily unsubscribe. Sign up today!
Arkadiusz Sieron, PhD
Sunshine Profits: Effective Investment through Diligence & Care.-----
Disclaimer: Please note that the aim of the above analysis is to discuss the likely long-term impact of the featured phenomenon on the price of gold and this analysis does not indicate (nor does it aim to do so) whether gold is likely to move higher or lower in the short- or medium term. In order to determine the latter, many additional factors need to be considered (i.e. sentiment, chart patterns, cycles, indicators, ratios, self-similar patterns and more) and we are taking them into account (and discussing the short- and medium-term outlook) in our Gold & Silver Trading Alerts.
-
Will the Surge in Spending on Goods Include Gold?
October 8, 2021, 9:47 AMConsumers’ expenses on goods soared amid the pandemic crisis. Will gold benefit from this spending spree?
“We need lower [consumer demand] growth to give the supply chain time to catch up, or differently spread out growth”, said Morten Engelstoft, chief executive of Maersk-owned APM Terminals, in September. Even though I’m fully aware of the supply-chain crisis, Engelstoft’s remarks struck me. Companies usually complain about soft consumers’ appetite, not about strong demand, and they don’t call for a reduction in expenditures!
Something strange is happening here, indeed. So, I decided to dig into this issue a bit deeper, and I was even more struck by the data I found. Please take a look at the chart below, which shows the US real personal consumption expenditures on services (red line) and on goods (green line). As you can see, people’s spending on goods has increased about 15% since February 2020.
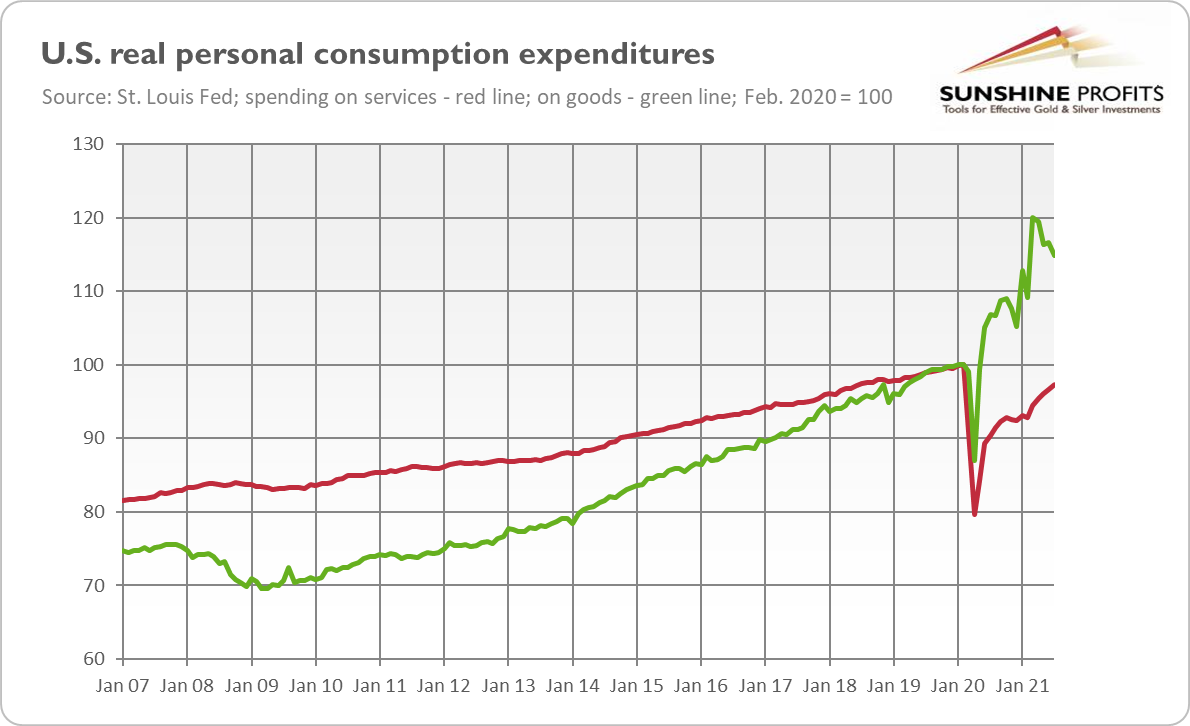
Let’s repeat it, adding some context: we experienced the deepest recession since the Great Depression, but the personal expenditures on goods are not lower, but higher! And they are substantially higher, as 15% is a giant disturbance to the production system, which is very difficult to be accommodated in such a short time.
Why is it so important? Well, it’s a unique development. As the chart above shows, after the global financial crisis in 2007-2009, consumer spending on goods has returned to the pre-crisis level only in 2012. This difference is caused by two things. The first is enormous fiscal stimulus passed in response to the epidemic. As a result, the demand for goods, especially durables, surged, boosting inflation.
The second is the fact that the Covid-19 crisis wasn’t a crisis of aggregate demand, but it was a structural crisis, i.e., it was characterized by the substantial shift in the structure of spending. As you can see in the chart above, the personal consumption expenditures on services haven’t yet returned to the pre-pandemic level. In other words, because of the Great Lockdown, people couldn’t leave their money in restaurants, hotels, movie theatres, etc., so they started to buy more stuff. However, the government and central banks acted as if the problem was aggregate demand, so they boosted the money supply and fiscal deficits, contributing to the rising prices of goods.
What does it all mean for the gold market? The first implication is that the current expansion is and will be, as I warned shortly after the economic crisis, more inflationary than the recovery from the Great Recession. Inflation is already high, and it may increase even further, or at least stay at the elevated level for a while, given the scale of supply-side challenges.
According to Brian Sondey, chief executive of Triton International, the world’s largest container leasing company, “consensus in the industry is we’re unlikely to see a cleaning up of the situation until deep into next year”. This means that inflation could be more lasting than the Fed claims. Gold should benefit from higher inflation and lower real interest rates, but only if Powell and his colleagues don’t become more hawkish in response to persistent price pressure and interest rates don’t rise significantly. Luckily for gold, the FOMC seems to be focused on employment much more than inflation.
The second implication is that the current expansion may prove to be unsustainable; the economy could slowly revert to the structure and trends from before the pandemic. In this scenario, the demand for services would rise, but the demand for goods would fall. If the demand for goods declines, companies could reduce their investments. Then, the supply-chain disruptions could become aggravated, while the economy could enter a new recession. What’s important, in this case, a recession could be accompanied by relatively elevated inflation. In such a stagflationary environment, gold might shine.
Of course, this is just a scenario, and it might turn out that the structure of demand for goods and services won’t return to the pre-pandemic level and the economy will enter a new, steeper path of growth. In this more optimistic scenario, gold would struggle. The coming months will be crucial for the future of the economy and the precious metals market.
One thing is certain, however. We are not yet on a nice, riskless post-pandemic path and important structural shifts are still ahead of us. Last year, the shifts in consumer spending and mammoth monetary and fiscal stimulus perhaps helped to avoid a more serious recession, but at the expense of higher inflation. We can still enter a recession though — at this time, with stronger price pressure. Nonetheless, given all the risks ahead of us, gold should still be of interest to investors.
Thank you for reading today’s free analysis. If you enjoyed it, and would you like to know more about the links between the economic outlook, and the gold market, we invite you to read the October Gold Market Overview report. Please note that in addition to the above-mentioned free fundamental gold reports, and we provide premium daily Gold & Silver Trading Alerts with clear buy and sell signals. We provide these premium analyses also on a weekly basis in the form of Gold Investment Updates. In order to enjoy our gold analyses in their full scope, we invite you to subscribe today. If you’re not ready to subscribe yet though and are not on our gold mailing list yet, we urge you to sign up. It’s free and if you don’t like it, you can easily unsubscribe. Sign up today!
Arkadiusz Sieron, PhD
Sunshine Profits: Effective Investment through Diligence & Care.-----
Disclaimer: Please note that the aim of the above analysis is to discuss the likely long-term impact of the featured phenomenon on the price of gold and this analysis does not indicate (nor does it aim to do so) whether gold is likely to move higher or lower in the short- or medium term. In order to determine the latter, many additional factors need to be considered (i.e. sentiment, chart patterns, cycles, indicators, ratios, self-similar patterns and more) and we are taking them into account (and discussing the short- and medium-term outlook) in our Gold & Silver Trading Alerts.
-
Have We Bought a Golden Ticket to the 1970s?
October 1, 2021, 11:00 AMIt turned out that time travel is possible, after all. All you need is reckless monetary policy and, boom, you are back in the 1970s. Gold seems to like such voyages!
Have you ever dreamed about time travel? Now it’s totally possible, courtesy of the Federal Reserve. Thanks to its dovish monetary policy, we are going back to the 1970s. Just as fifty years ago, the US central bank is letting inflation rise, claiming that the employment goal is much more important and that the Philips Curve has flattened. In the 1970s, they thought similarly, but it turned out that you can overheat the economy, after all! And just as Arthur Burns half a century ago, Jerome Powell believes that inflation is caused only by a few particular categories, and it will prove to be transitory.
I’ve been pointing out these disturbing parallels for months. Now, as Kenneth Rogoff, Professor at Harvard University, noted, with the US humiliating exit from Afghanistan and the fall of Kabul, the similarities between the 1970s and the 2020s are growing. Other dangerous resemblances are relative fast growth in the money supply (see the chart below), fiscal deficits, and the presence of supply-side shocks (but instead of oil shocks we suffer from semiconductor shock and disruptions in other supply chains).
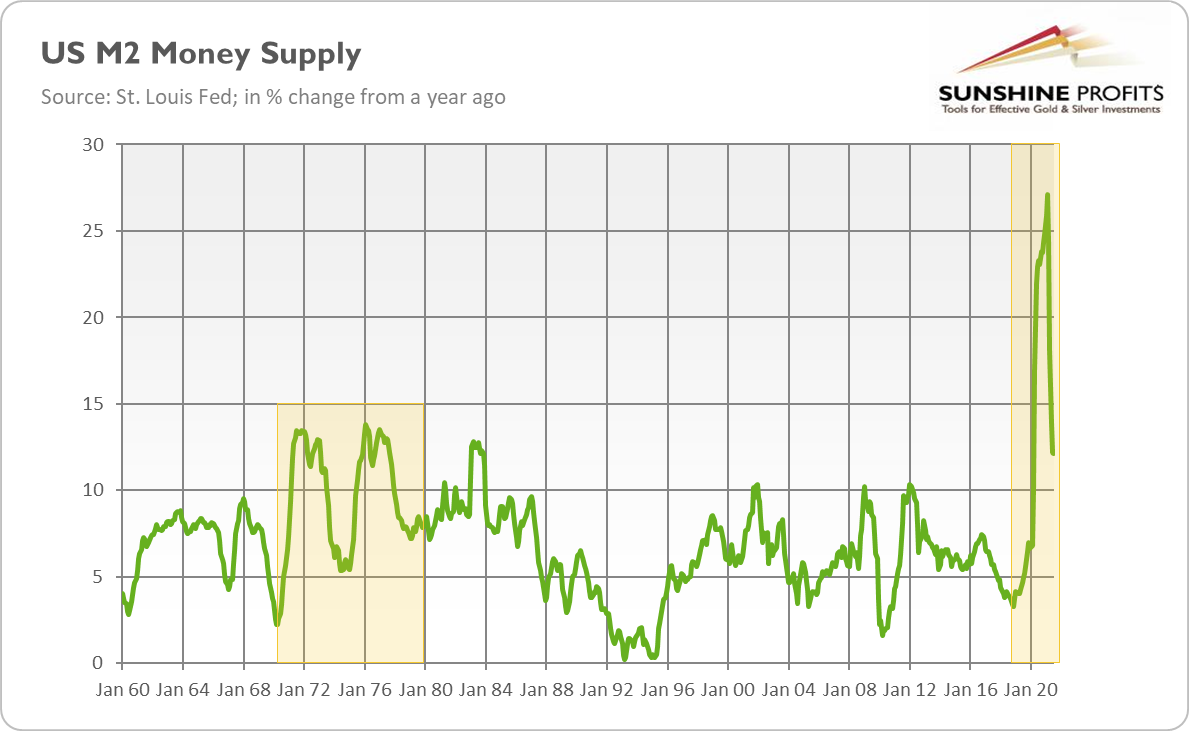
Rogoff also points out some important differences, namely, the independent central bank readiness to hike the federal funds rate if inflation gets out of control, and much lower interest rates that provide the Treasury with room for its lax spending.
There is a grain of truth in Rogoff’s claims. The central bank’s independence is much more strongly established, and Powell is a far cry from Burns who was submissive to President Nixon. However, please note that both private and public debts are much higher than fifty years ago. This mammoth pile of debt makes interest rate hikes much more politically painful. The high indebtedness is already a reason why the Fed maintains a dovish stance and will normalize its monetary policy at very a gradual pace.
Remember the Fed’s recent attempts to roll back quantitative easing and bring interest rates back to more normal levels? The economic slowdown and the repo crisis forced the Fed to cut the federal funds rate again and return to the asset purchases. It was in 2019, much before the pandemic started. So, never underestimate the power of the debt trap!
What does it all mean for gold? Well, if we are really going into the 1970s, gold could be one of the biggest winners. The yellow metal enjoyed a bull market then, so a similar positive scenario could replay now.
Although, fifty years ago the US economy entered stagflation, i.e., a period of high inflation and economic stagnation. The current situation is clearly not so bad — inflation is lower than in the 1970s, while the GDP growth is positive. However, the recent slowdown in economic growth, despite massive monetary and fiscal stimulus, suggests that a mini-stagflation may be underway. The spread of the Delta variant of the coronavirus hampers the economic growth, and both monetary and fiscal policies remain loose, contributing to the upward price pressure.
If the Fed’s story about transitory inflation is wrong, it will need to tighten its policy more decisively than expected. An abrupt tightening cycle could be negative for gold prices, as the yellow metal prefers an environment of low bond yields. However, aggressive steps to combat inflation could also cause a plunge in the prices of risky assets or even a financial crisis. So, if the Fed stays long behind the curve, gold should ultimately benefit – either from accelerating inflation or from the Fed’s harsh tightening triggering a sovereign debt crisis or an economic crisis (as a reminder, Paul Volcker contained inflation, but the US economy entered into a recession).
Thank you for reading today’s free analysis. If you enjoyed it, and would you like to know more about the links between the economic outlook, and the gold market, we invite you to read the October Gold Market Overview report. Please note that in addition to the above-mentioned free fundamental gold reports, and we provide premium daily Gold & Silver Trading Alerts with clear buy and sell signals. We provide these premium analyses also on a weekly basis in the form of Gold Investment Updates. In order to enjoy our gold analyses in their full scope, we invite you to subscribe today. If you’re not ready to subscribe yet though and are not on our gold mailing list yet, we urge you to sign up. It’s free and if you don’t like it, you can easily unsubscribe. Sign up today!
Arkadiusz Sieron, PhD
Sunshine Profits: Effective Investment through Diligence & Care.-----
Disclaimer: Please note that the aim of the above analysis is to discuss the likely long-term impact of the featured phenomenon on the price of gold and this analysis does not indicate (nor does it aim to do so) whether gold is likely to move higher or lower in the short- or medium term. In order to determine the latter, many additional factors need to be considered (i.e. sentiment, chart patterns, cycles, indicators, ratios, self-similar patterns and more) and we are taking them into account (and discussing the short- and medium-term outlook) in our Gold & Silver Trading Alerts.
-
Will Biden’s Neo-Populist Economic Doctrine Support Gold?
September 24, 2021, 9:37 AMBiden scaled back on his infrastructure bill. However, with all the remaining cards still in play, his economic agenda should be positive for gold.
Inflation, bond yields, monetary policy… that’s all interesting and crucial to understand trends in the gold markets – but, hey, what’s up in politics? A lot has happened recently on this front. In particular, last month, the world was shocked by the chaotic withdrawal of US troops from Afghanistan. The messy pullover and the quick takeover of the country by the Taliban is not only the end of Biden’s honeymoon but also America’s great failure. Some analysts even say that the fall of Kabul is another Saigon time for the US. Indeed, it goes without saying that the collapse in Afghanistan is a huge blow to America’s reputation. So, it could weaken the faith in Uncle Sam and its currency, which could be positive for gold in the long run.
However, the end of the US mission in Afghanistan doesn’t pose any direct threats to America (although terrorism could thrive under the Taliban regime) or to the greenback. So, I don’t expect any substantial, long-lasting moves in gold prices (always remember that geopolitical events cause only short-lived fluctuations, if any).
Another recent important development in the US policy was that the Senate passed a $1 trillion bipartisan infrastructure bill, which is a big step in pushing Biden’s economic agenda through Congress. The economic effect will probably be smaller than expected, as public stimulus rarely works as intended. So, I don’t expect any material impact on gold prices, especially given that this additional government spending has already been priced in.
However, I would like to point out that Biden has scaled back his infrastructure plans from $2.2 trillion and agreed to spend these funds over a longer period. It means that the US fiscal policy, although still unprecedentedly easy, is normalizing somewhat (see the chart below), at least compared to Democrats’ initial huge plans (however, they are still working on a budget resolution that would allow them to approve a complementary $3.5 trillion spending plan). A normalization of the fiscal policy is bad for gold prices, especially when coupled with the Fed’s tightening cycle.
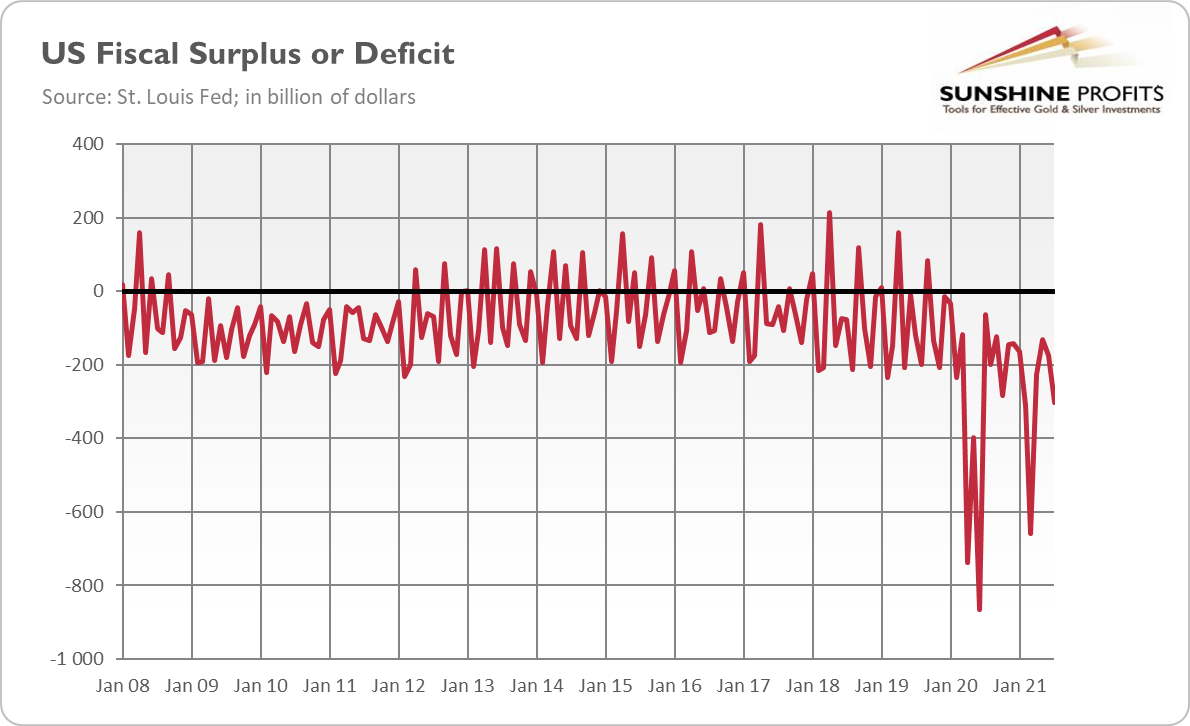
Let’s step back — it turns out that it’s quite fruitful to look at Biden’s economic agenda from a bit broader perspective. It becomes clear that Biden – despite his hatred for Trump – actually continues Trumponomics. Nouriel Roubini calls Biden’s doctrine “neo-populist” and sees the paradox in the fact that it “has more in common with Trump’s policies than with those of Barack Obama’s administration, in which the current president previously served”.
Indeed, every president from Bill Clinton to Obama favored trade liberalization and a strong dollar while respecting the Fed’s independence. They were also understanding the importance of the moderate fiscal policy (although the practice differed, especially after the financial crisis of 2007-9). They were far from being laissez-faire advocates, but at least they didn’t question the economic orthodoxy.
Then Trump stepped in, inaugurating a trade war with China, and imposing tariffs on goods from other countries as well. He also questioned the Fed’s actions, which supported a weak greenback and ballooned fiscal deficits even before the epidemic started.
Biden’s rhetoric is softer and his actions less erratic, but he has maintained Trump’s tariffs, pursuing similar nationalist and protectionist trade policy. He even widened the already large budget deficit, continuing the spending spree financed by public debt. Although Biden doesn’t openly favor a weak dollar, the current administration is far from pursuing a strong-dollar policy. He also supported large direct cash transfers to citizens that Trump started in response to the pandemic. Last but not least, Biden fights with Big Business, introducing some anti-monopoly policies.
What does it all mean for the gold market? Well, the continuation of neo-populist economic doctrine and shifting away from sound economics (I wrote about this earlier this year) implies generally looser monetary and fiscal policies. Larger debts create a risk of a debt crisis, while downplaying the inflationary pressures (as for populists, price stability is less important than employment gains, rising wages, or reducing inequalities) increases the odds of inflation crisis or even stagflation (big government and huge indebtedness could hamper the pace of GDP growth).
As we know from Latin America, the rules of populists and MMT-like policies never end well. And, as we know from the 1970s, constant stimulation of the economy (because there is still some slack) and neglecting the dangers of inflation could be disastrous. So, Bidenomics should be generally supportive of gold.
Having said that, investors should remember that many more factors influence gold prices than just the President’s actions. A part of Biden’s presidency will coincide with the economic expansion from the pandemic recession and normalization of the interest rates that will likely create downward pressure on the yellow metal.
Thank you for reading today’s free analysis. If you enjoyed it, and would you like to know more about the links between the economic outlook, and the gold market, we invite you to read the September Gold Market Overview report. Please note that in addition to the above-mentioned free fundamental gold reports, and we provide premium daily Gold & Silver Trading Alerts with clear buy and sell signals. We provide these premium analyses also on a weekly basis in the form of Gold Investment Updates. In order to enjoy our gold analyses in their full scope, we invite you to subscribe today. If you’re not ready to subscribe yet though and are not on our gold mailing list yet, we urge you to sign up. It’s free and if you don’t like it, you can easily unsubscribe. Sign up today!
Arkadiusz Sieron, PhD
Sunshine Profits: Effective Investment through Diligence & Care.-----
Disclaimer: Please note that the aim of the above analysis is to discuss the likely long-term impact of the featured phenomenon on the price of gold and this analysis does not indicate (nor does it aim to do so) whether gold is likely to move higher or lower in the short- or medium term. In order to determine the latter, many additional factors need to be considered (i.e. sentiment, chart patterns, cycles, indicators, ratios, self-similar patterns and more) and we are taking them into account (and discussing the short- and medium-term outlook) in our Gold & Silver Trading Alerts.
-
If Post-1971 Monetary System Is Bad, Why Isn’t Gold Higher?
September 17, 2021, 9:24 AMAugust marked the 50th anniversary of Nixon’s abandonment of the gold standard. It caused so many problems for the economy…and gold didn’t take over?
Last month marked the 50th anniversary of President Nixon’s suspension of the convertibility of US dollars into gold. This move broke the last, thin link between world currencies and the yellow metal, effectively ending the ersatz of the gold standard that we still had back then (the official end came in March 1973, marking the start of an era of freely-floating fiat currencies).
I wrote about the collapse of the Bretton Woods in the last edition of the Gold Market Overview, but as it was a truly revolutionary event that paved the way for today’s monetary conditions, it’s worth mentioning the topic again.
You see, as weak the diluted post-war version of the gold standard was, it limited the US central bank’s ability to increase the money supply, as there was still a possibility that other participants of the system would redeem their dollars for gold. But Nixon “suspended temporarily” the convertibility of the dollar into gold, and while gold is away, the mice will play. Without any true constraints, the pace of annual money growth hit double digits. The CPI inflation rates followed, and the great stagflation of 1970s emerged, as the chart below shows.
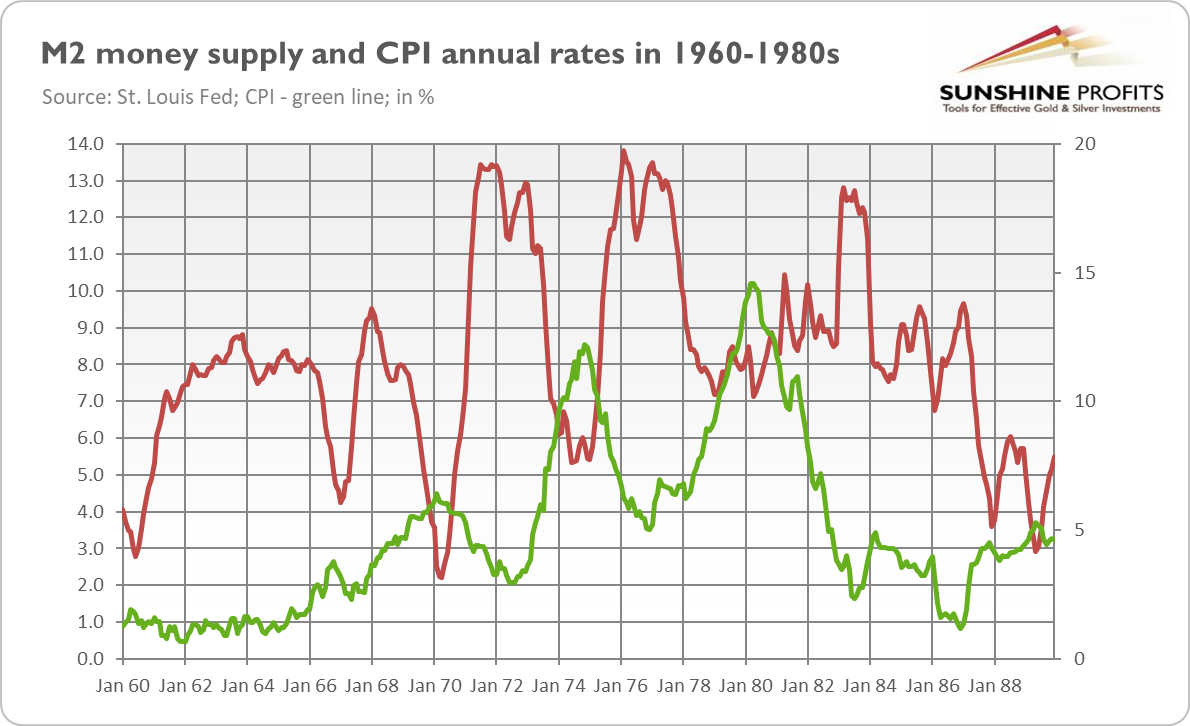
What’s more, without the discipline imposed by the gold standard, the central bank could much easier monetize the public debt. The governments could spend more, maintain fiscal deficits and increase their indebtedness. In short, without gold as an anchor for monetary policy, we got more money printing, more debt, higher inflation, and more severe financial crises.
Now, one could ask: if the current monetary system, or – as some analysts prefer to call it – non-system is so bad, why isn’t the price of gold higher? Shouldn’t it be rallying, indicating how rotten our fiat-money-debt-fueled economy is?
Well, there are many answers to this questions. First of all, let’s note that the price of gold has already surged about 4100%, or more than 7.7% annually, on average, since 1971 (see the chart below), which is really something!
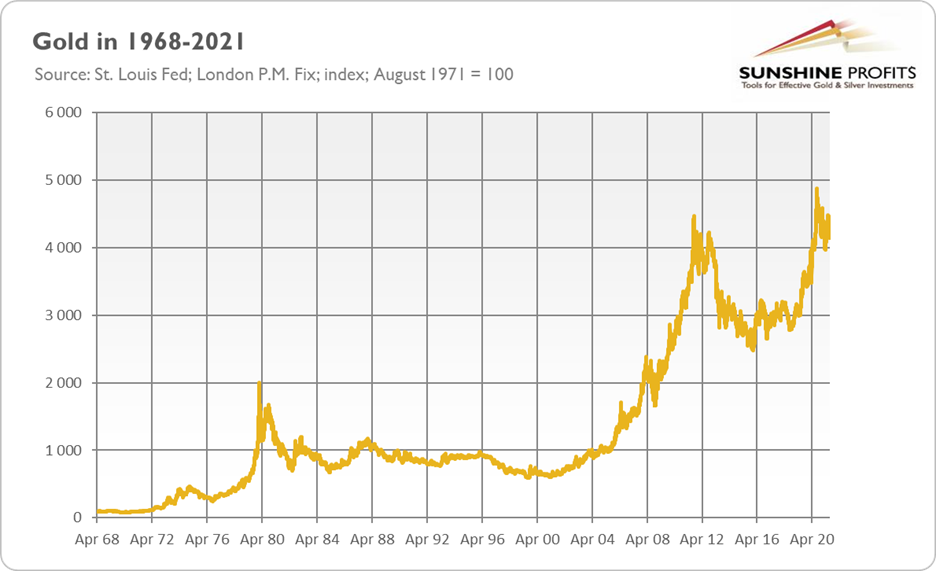
Second, financial markets are great supporters of the current monetary system, as they love loose monetary policy and liquidity drips from the central banks. Please remember that the US stock market welcomed the closure of the gold window by increasing 3% the next day after Nixon’s infamous speech.
Third, even poor systems can work for a while. Communist economies didn’t collapse immediately, despite their obvious inefficiency. The Breton Woods worked for almost 30 years despite its evident flaws. Furthermore, there were some institutional changes implemented in order to strengthen the current system, such as central banks’ independence, inflation targeting, prohibition of direct monetization of public debt, etc.
However, probably the most important reason is that the gold standard was in a way replaced by the US dollar standard, as the greenback substituted gold as the world’s reserve currency. In such a system, there is simply no alternative to the US dollar as a global reserve. This is because America became even more central to global finance than it was in 1971 and because practically all countries conduct similarly unsound monetary and fiscal policies (and some central banks like the ECB or BoJ are even more radical than the Fed). The greenback’s strength limits dollar-denominated gold prices.
However, it’s worth remembering that unlike the gold standard, under which currencies were backed by gold (or: they were actually defined as units of gold’s weight), today’s currencies are backed only by the reputation of their issuers, which is not set in stone. This is actually why the Breton Woods eventually collapsed. Initially, the US enjoyed a great reputation, and no one even dared to question Uncle Sam’s ability to convert dollars to gold. But the prolonged war in Vietnam, Johnson’s great social programs, increased government spending and growing deficits undermined this reputation, and other countries started to demand gold for their dollars.
The same may happen in the future, especially given that Trump has left some scratches on America’s reputation. With Biden continuing his predecessor’s populist economic doctrine, the greenback should face further headwinds. What’s more, with ultra-low interest rates and a mammoth pile of debt, the room for inflating the economic bubble is limited. Although the return to the gold standard seems unlikely, the recurring business cycles and economic crises are more than certain. That’s great news for gold.
In other words, the current system persists mainly thanks to the faith in the central banks’ ability to control inflation, even without the discipline of the gold standard. However, this belief can break down one day. The Fed might be right that the current high inflation is temporary. But if not, we could have “Powell’s shock”, which could strengthen gold, just as Nixon’s shock did.
Thank you for reading today’s free analysis. If you enjoyed it, and would you like to know more about the links between the economic outlook, and the gold market, we invite you to read the September Gold Market Overview report. Please note that in addition to the above-mentioned free fundamental gold reports, and we provide premium daily Gold & Silver Trading Alerts with clear buy and sell signals. We provide these premium analyses also on a weekly basis in the form of Gold Investment Updates. In order to enjoy our gold analyses in their full scope, we invite you to subscribe today. If you’re not ready to subscribe yet though and are not on our gold mailing list yet, we urge you to sign up. It’s free and if you don’t like it, you can easily unsubscribe. Sign up today!
Arkadiusz Sieron, PhD
Sunshine Profits: Effective Investment through Diligence & Care.-----
Disclaimer: Please note that the aim of the above analysis is to discuss the likely long-term impact of the featured phenomenon on the price of gold and this analysis does not indicate (nor does it aim to do so) whether gold is likely to move higher or lower in the short- or medium term. In order to determine the latter, many additional factors need to be considered (i.e. sentiment, chart patterns, cycles, indicators, ratios, self-similar patterns and more) and we are taking them into account (and discussing the short- and medium-term outlook) in our Gold & Silver Trading Alerts.
-
Stagflation: A Stagnation Breaker?
September 10, 2021, 9:36 AMOne word shakes the markets, causing a lot of fear: stagflation. Is it coming? Will it push gold out from stagnation? Let’s find out.
One of the greatest risks cited currently by the markets is stagflation. The term means a situation in which there is high inflation and stagnation at the same time. So far, we have only had high inflation (CPI annual rate has soared 5.4%, and almost 5% if we take the quarterly average), but some analysts believe that inflation has already peaked. However, the economic growth is fast (the GDP surged 12% in Q2 2021 year-over-year), as the chart below shows. So, why bother?
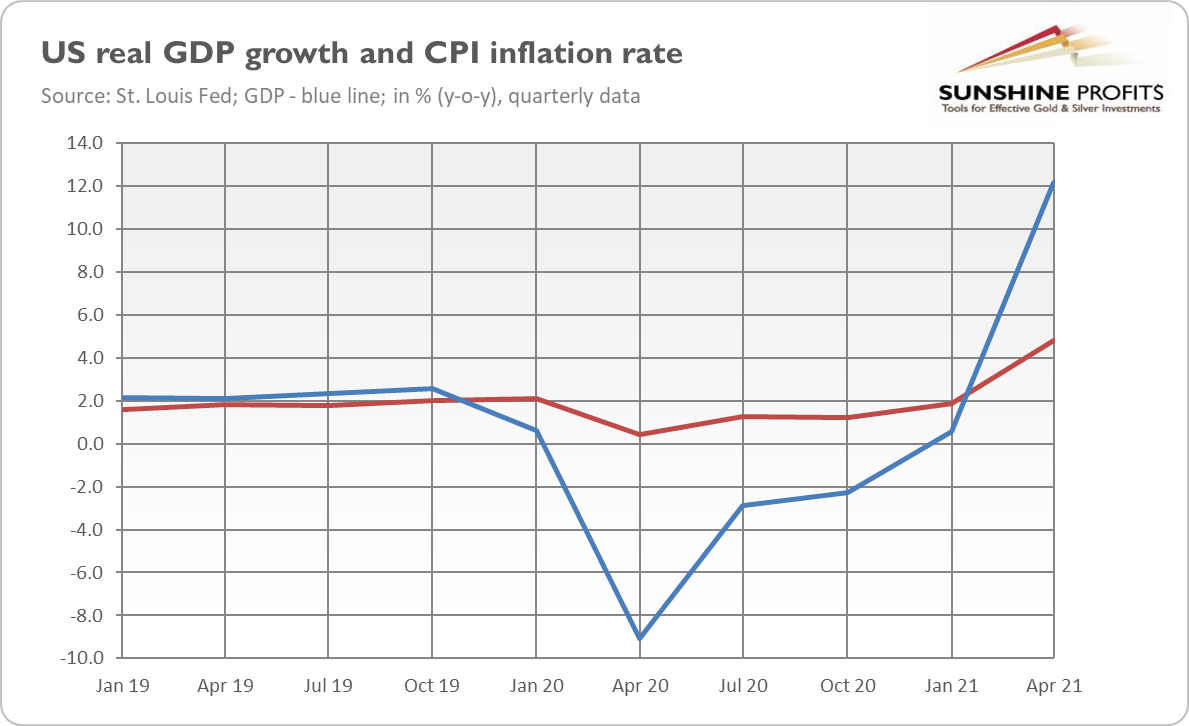
Well, although a recession is rather not lurking around the corner, slowing economic momentum quite clearly is. The GDP growth for the second quarter (although impressive) came below expectations, the consumer confidence declined, and, more generally, the index of US data surprises has recently turned negative.
Among negative surprises, we should point out the decline in retail sales by 1.1% in July, which was worse than expected (0.3%) and the drop in the New York Fed’s Empire Manufacturing Index from 43.0 in July to 18.3 in August, much below the expected 29.0. So, the recent decline in the bond yields may not be as nonsensical as it may seem.
I warned my readers a long time ago that the recovery from the pandemic would be spectacular but short-lived and caused mainly by the low last year’s base. If you lock the economy, it plunges; when you open it, it soars, simple as that. Now the harsh reality steps in, and it’s yet to be seen how the US economy will perform in a post-pandemic reality with the spreading Delta variant of the coronavirus, a slowdown in China’s economy, and without government stimulus.
When it comes to the price front, it’s also highly uncertain. Inflation has softened a bit in July, but it remains high, and I’m afraid that it could prove to be more persistent than it’s believed by the Fed and some analysts. The latest Empire Index, mentioned above, tells us: although the index of manufacturing activity fell more than expected, the inflationary pressure strengthened. As the report says, “input prices continued to rise sharply, and the pace of selling price increases set another record”.
What’s disturbing in all this – and this is why inflation may stay with us for longer – is that the Fed is downplaying the inflation risk. And even the monetary policy 101 says that the best way of preventing inflation is acting early as inflation pressure builds up. Friedrich Hayek, a great economist and a Nobel Laureate, once compared taming inflation to catching a tiger by the tail – it’s not an easy task when the cat has already escaped the cage. The problem is that when central bankers wait to see the whites of inflationary tiger’s eyes before acting, it’s already too late. If you stare at the tiger in the eyeballs, you are probably to be eaten soon – unless you hike interest rates abruptly, choking economic growth off.
Going into specifics, the Fed’s view that inflation is transitory mainly rests on the belief that price increases are caused by supply disruptions related to the epidemic. However, inflation is not limited to just a few feverish components — it’s broad-based. In particular, the cost for shelter, the largest component of the CPI, has also been gradually rising, even though the owner’s equivalent rent component doesn’t reflect properly the recent record surge in U.S. home prices (see the chart below). If this is not inflation, I don’t know what is!
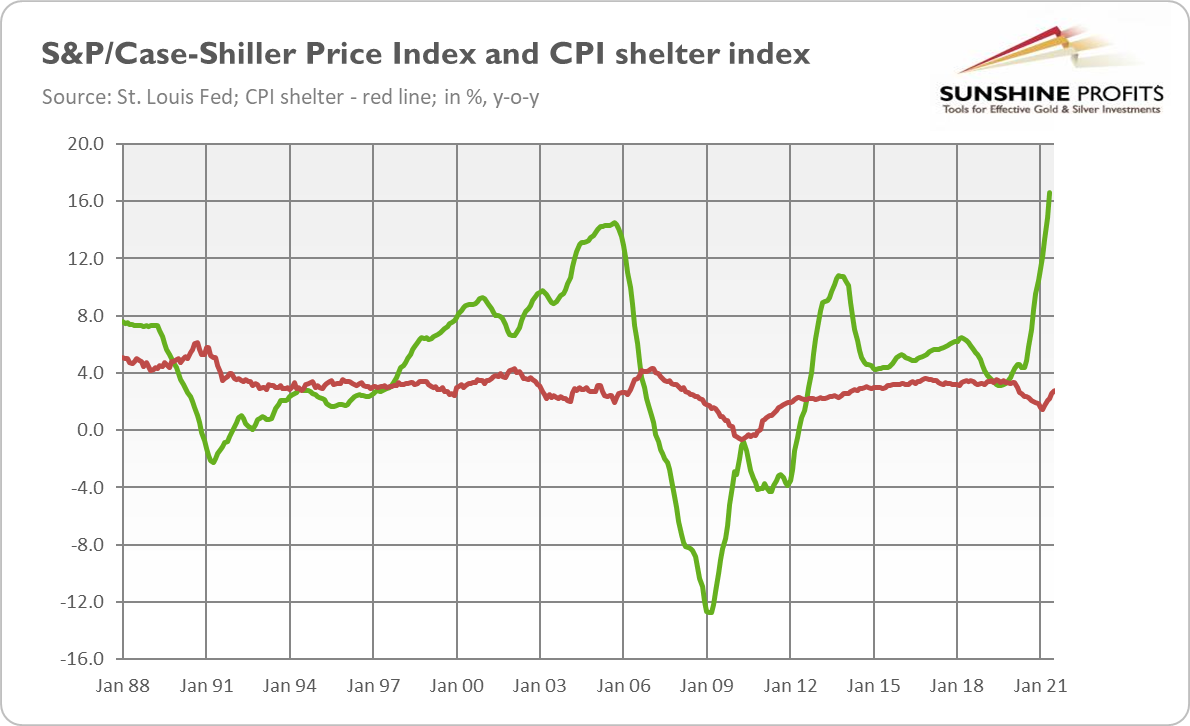
The increase in house prices is important here, as Gita Gopinath, Chief Economist and Director of the Research Department, IMF, admitted at the end of July: “More persistent supply disruptions and sharply rising housing prices are some of the factors that could lead to persistently high inflation”.
What does it all mean for the gold market? Well, stagflation should be negative for almost all assets. When we have a stagnant economy coupled with high inflation, stocks and bonds are selling off together. In such an environment gold shines, as it is a safe haven uncorrelated with other assets.
Stagflation is so terrifying because the Fed won’t be able to rescue Wall Street simply by cutting interest rates, as it could only add fuel to the inflation fire. The only viable solution would be to engineer another ‘Volcker moment’ and tighten monetary policy decisively to combat inflation. Given that debts are much higher than in the 1970s and some analysts even point to a debt trap, it could put the economy into a severe economic crisis. So far, investors seem not to worry about high inflation, but just as things go well until they don’t, investors are relaxed until they don’t. For all these reasons, it seems smart to own such portfolio diversifiers as gold.
Thank you for reading today’s free analysis. If you enjoyed it, and would you like to know more about the links between the economic outlook, and the gold market, we invite you to read the September Gold Market Overview report. Please note that in addition to the above-mentioned free fundamental gold reports, and we provide premium daily Gold & Silver Trading Alerts with clear buy and sell signals. We provide these premium analyses also on a weekly basis in the form of Gold Investment Updates. In order to enjoy our gold analyses in their full scope, we invite you to subscribe today. If you’re not ready to subscribe yet though and are not on our gold mailing list yet, we urge you to sign up. It’s free and if you don’t like it, you can easily unsubscribe. Sign up today!
Arkadiusz Sieron, PhD
Sunshine Profits: Effective Investment through Diligence & Care.-----
Disclaimer: Please note that the aim of the above analysis is to discuss the likely long-term impact of the featured phenomenon on the price of gold and this analysis does not indicate (nor does it aim to do so) whether gold is likely to move higher or lower in the short- or medium term. In order to determine the latter, many additional factors need to be considered (i.e. sentiment, chart patterns, cycles, indicators, ratios, self-similar patterns and more) and we are taking them into account (and discussing the short- and medium-term outlook) in our Gold & Silver Trading Alerts.
-
Bond Conundrum - Boom or Bust for Gold?
September 3, 2021, 9:41 AMInflation has risen, but bond yields have declined. Such a divergence is strange — beware gold bulls!
Would you like to see something mysterious? If yes, please look at the chart below. It shows the yields on 10-year US Treasuries (red line) and CPI annual inflation rates (blue line) in recent years. As you can see, a huge divergence emerged this year: while inflation surged above 5%, nominal bond yields declined from 1.6% to 1.3%.
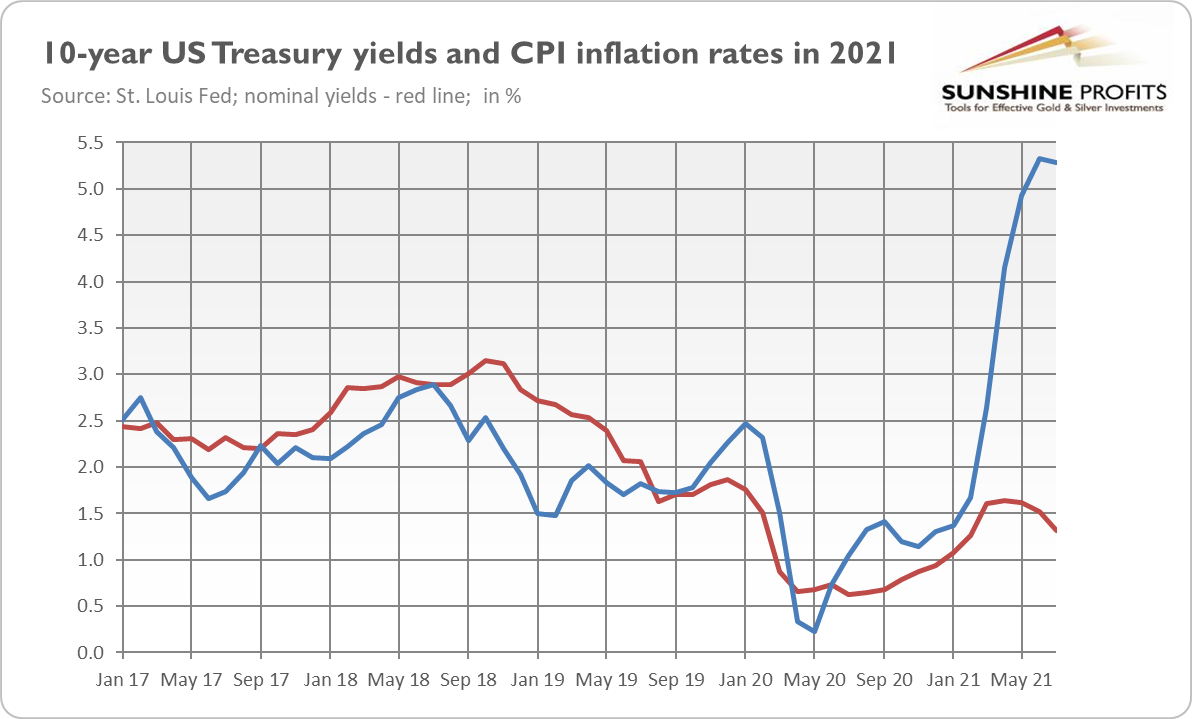
Why is it so strange? Well, economic theory says that when inflation goes up, it erodes the purchasing power of bonds’ coupon payments. Thus, the price of bonds declines, and yields increase. In other words, when inflation accelerates, investors demand higher inflation premium to protect their real returns.
But now we can observe rising inflation and declining bond yields at the same time. The yield on the 10-year Treasury is 1.3%, which is 4 percentage points below the inflation rate, so investors who buy bonds lose a lot of money in real terms. Something is clearly wrong here. Let’s solve this bond conundrum!
The first potential explanation is that bond investors trust the Fed and believe that high inflation is mainly transitory. If so, the bond yields are more or less accurate and could stay around current low levels, and the inflation rates will adjust. The supply disruptions caused by the pandemic will eventually resolve, while the Fed is going to tighten its monetary policy, adding to disinflationary forces.
At first glance, the scenario in which inflation is declining seems to be negative for the yellow metal, as it implies lower demand for gold as an inflation hedge. However, in this case, interest rates could stay at very low levels for a long time. And gold likes the environment of low yields.
The second possible reason for the decline in interest rates is that bond investors expect slower economic growth than previously thought. Indeed, recent data suggests that the pace of GDP growth could be peaking. The spread of the delta variant of the coronavirus, smaller infrastructure plan than initially outlined, a slowdown in China’s economic growth and the Fed’s tightening cycle – all these factors could soften the US growth prospects, translating into lower yields.
It goes without saying that this scenario would be very positive for gold prices. High inflation plus a slowdown in economic growth equals stagflation, a dream environment for gold. However, the stock market didn’t weaken, as one could expect after a downward revision of investors’ growth prospects. On the other hand, the spread between yields on 10-year and 2-year Treasuries has narrowed substantially since March, as the chart below shows. The flattening of the yield curve often indicates a slowdown in economic growth.
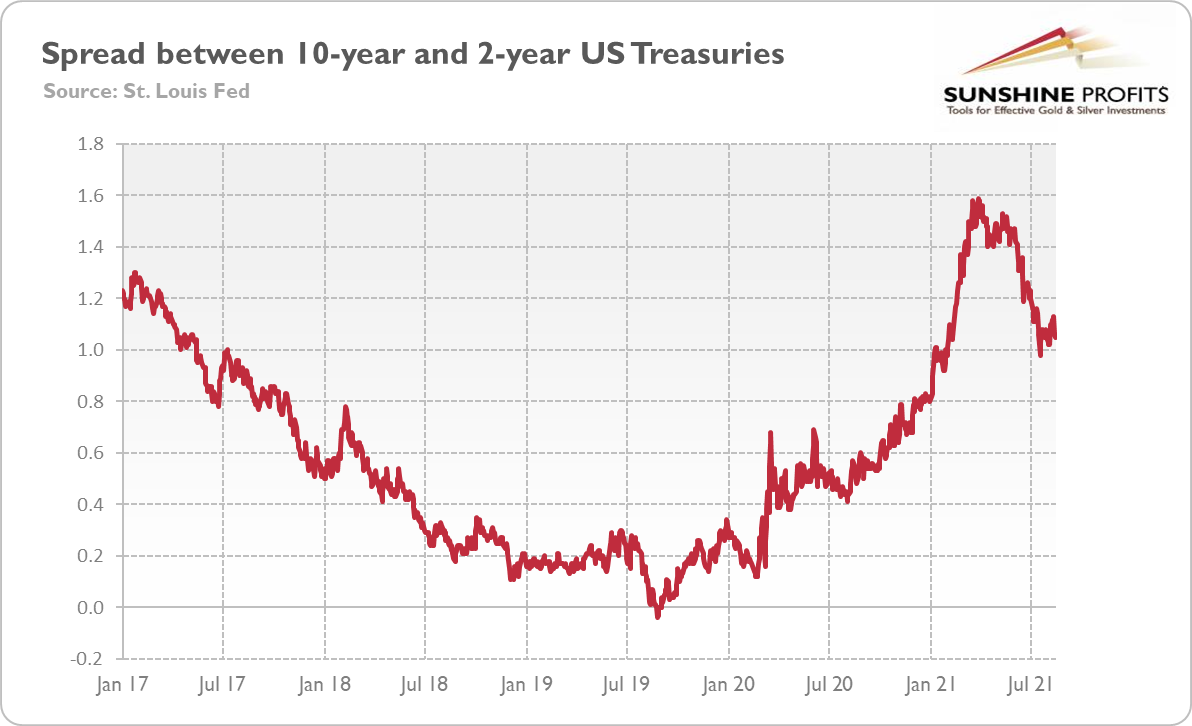
But it’s also possible that technical factors or the central bank’s interventions trumped the fundamentals. Strong demand for the US Treasuries that pushed yields down despite rising inflation could be the case here. After all, the Fed has been purchasing $80 billion a month in Treasuries (and $40 billion in mortgage-backed bonds) since June 2020. In other words, quantitative easing could disrupt the functioning of the bond market.
Indeed, the unprecedentedly easy monetary policy conditions with ultra-low interest rates and abundant liquidity could explain why both stock and bond prices are so high right now (and bond yields so low). In an environment of negative real interest rates created by Powell and his colleagues, asset managers search for yield in every possible asset, even if it is not economically viable — including cryptocurrencies that are just memes (like Dogecoin) or bonds with yields lower than inflation rates.
What does it all imply for the gold market? Well, I have good and bad news. So, the bad news is that the real interest rates seem to be excessively low (see the chart below) and they are likely to move up over the economic expansion (especially when the Fed tightens its monetary stance), whereas inflation expectations could ease somewhat later this year. Unfortunately for gold bulls, the increase in the real interest rates would likely push gold prices lower.
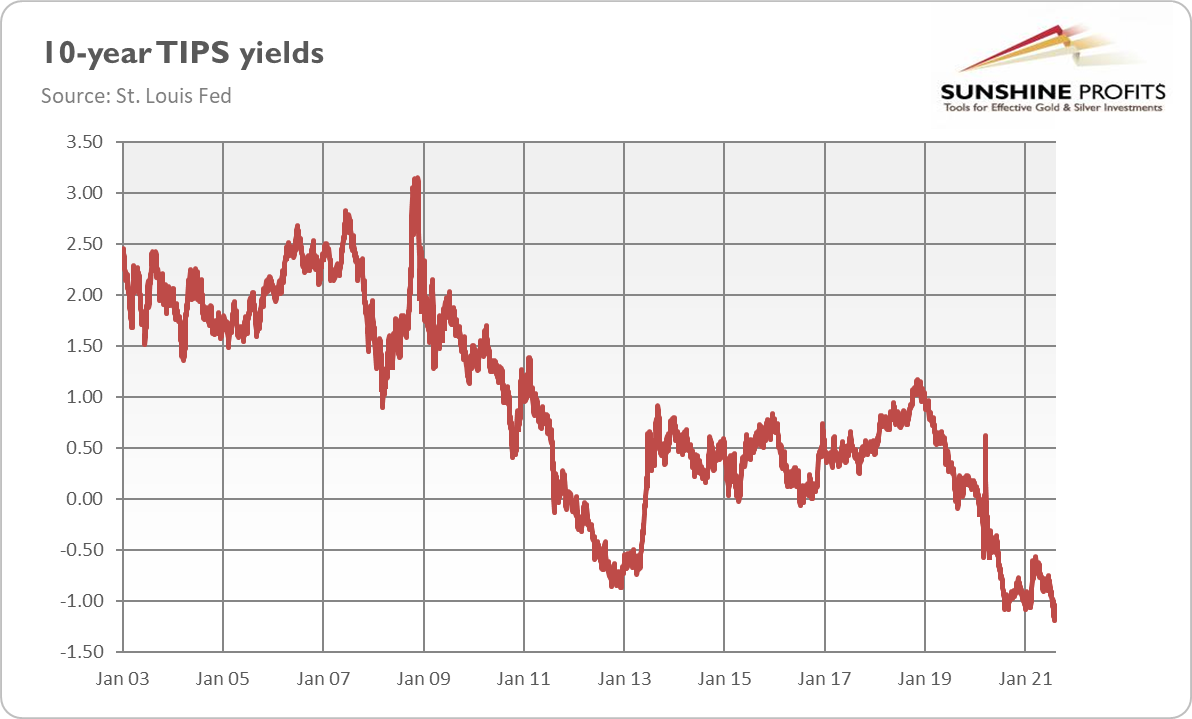
The good news is that that an increase in interest rates would put the governments and other debtors in a very difficult position, potentially leading to a debt crisis. Asset valuations could decline and financial crisis could follow suit. In other words, the Fed’s tightening cycle could sow the seeds of another recession and rally in gold.
Having said that, we have just recovered from one economic crisis, and it will take some time for another to unfold. Until that happens, real interest rates may normalize somewhat without entailing substantial perturbations, which would be negative for gold prices.
Thank you for reading today’s free analysis. If you enjoyed it, and would you like to know more about the links between the economic outlook, and the gold market, we invite you to read the September Gold Market Overview report. Please note that in addition to the above-mentioned free fundamental gold reports, and we provide premium daily Gold & Silver Trading Alerts with clear buy and sell signals. We provide these premium analyses also on a weekly basis in the form of Gold Investment Updates. In order to enjoy our gold analyses in their full scope, we invite you to subscribe today. If you’re not ready to subscribe yet though and are not on our gold mailing list yet, we urge you to sign up. It’s free and if you don’t like it, you can easily unsubscribe. Sign up today!
Arkadiusz Sieron, PhD
Sunshine Profits: Effective Investment through Diligence & Care.-----
Disclaimer: Please note that the aim of the above analysis is to discuss the likely long-term impact of the featured phenomenon on the price of gold and this analysis does not indicate (nor does it aim to do so) whether gold is likely to move higher or lower in the short- or medium term. In order to determine the latter, many additional factors need to be considered (i.e. sentiment, chart patterns, cycles, indicators, ratios, self-similar patterns and more) and we are taking them into account (and discussing the short- and medium-term outlook) in our Gold & Silver Trading Alerts.
-
Nixon’s Closure of Gold Window Still Supports Gold Prices
August 27, 2021, 8:28 AMAugust marks the 50th anniversary of Nixon’s closure of the gold window, the end of the gold standard that still affects the global economy.
It’s been 50 years since one of the most important events in contemporary – or, perhaps, all of – economic history. And, no, I don’t mean the foundation of the Nasdaq stock exchange nor the bankruptcy and nationalization of Rolls-Royce. Half a century ago, on August 15, 1971, President Richard Nixon closed the gold window. It meant that America unilaterally canceled the convertibility of the US dollar to gold. Nixon’s action was a nail in the coffin of the Breton Woods system and the beginning of the current monetary system (or, actually, the current non-system) based on freely floating fiat currencies (the ultimate end of the gold standard came in 1973). So, for the first time in history, money ceased to have any intrinsic value, use value, and any links to the precious metals or other commodities. Humankind has begun an experiment with national fiat monies that weren’t in any, even the loosest way, backed by gold.
How did this experiment go then? Not very well… The idea was that unshackling the dollar from gold would allow the Fed to conduct independent and ‘scientific’ monetary policy to boost economic growth and provide full employment while avoiding harmful recessions. Nixon’s shock was also presented as an action that would halt inflation and strengthen the stability of the dollar. As President Nixon promised himself in a television speech on August 15, 1971:
The third indispensable element in building the new prosperity is closely related to creating new jobs and halting inflation. We must protect the position of the American dollar as a pillar of monetary stability around the world (…)
I have directed Secretary Connally to suspend temporarily the convertibility of the dollar into gold or other reserve assets, except in amounts and conditions determined to be in the interest of monetary stability and in the best interests of the United States. (…)
The effect of this action, in other words, will be to stabilize the dollar.
Well, it didn’t work out as planned. The greenback plunged by a third during the 1970s. It also lost a lot of its domestic purchasing power. The average annual inflation rate between August 1971 and May 2021 was almost 4%, generating a cumulative price increase of about 560%. Indeed, as the chart below shows, the Consumer Price Index is now 6.6 times higher than in mid-1971.
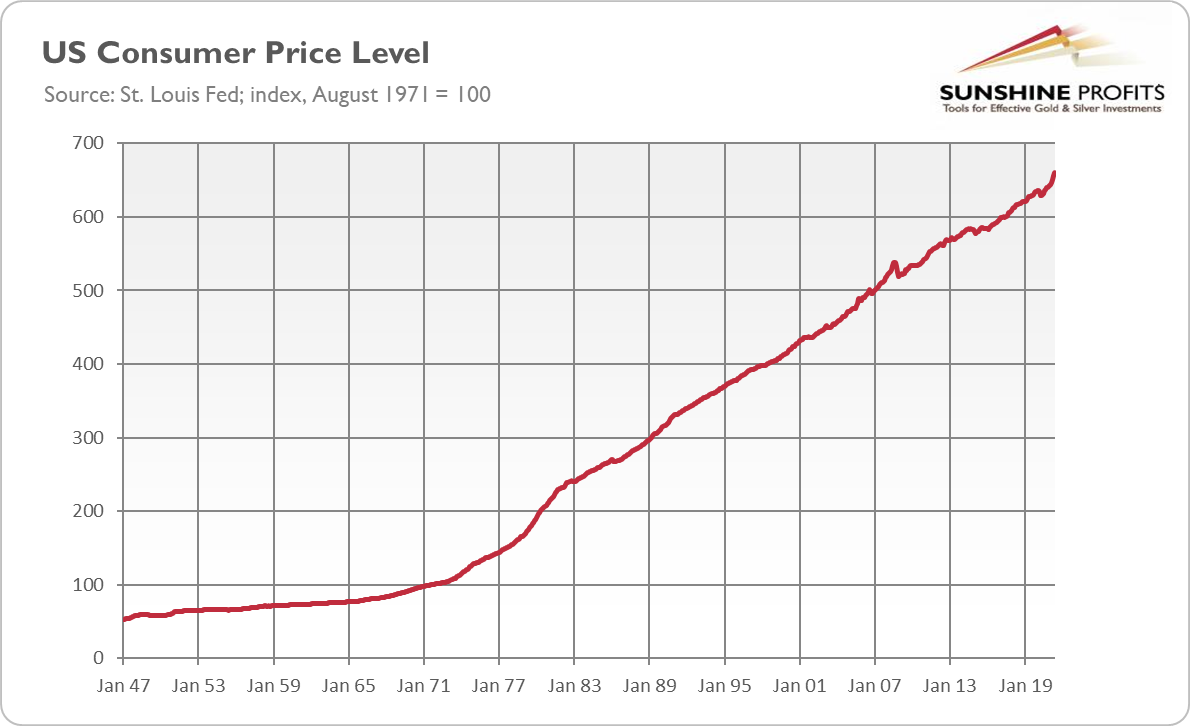
It means that $1 then is equivalent in purchasing power to about $6.6 today, an increase of $5.6. In other words, a dollar today only purchases less than 18% of what it could buy back then (so, it has lost more than 82%of its purchasing power since 1971). So much about curbing inflation and stabilizing the dollar.
Other promises have also been broken. The unemployment rate was, on average, higher, while the GDP growth was slower in the period after 1971. And since Nixon terminated the gold standard, there have been a lot of financial instability and several economic crises, including the stagflation in the 1970s and the global financial crisis in 2008-09.
The post-1971 monetary system was good at only one thing: at boosting the money supply and the public debt. Without the gold anchor, the Fed could create money (as well as the Treasury) and spend it more freely than under the gold standard. Indeed, as the chart below shows, both the monetary base and the federal debt have accelerated since the 70s, surging to a level about 650 times greater.
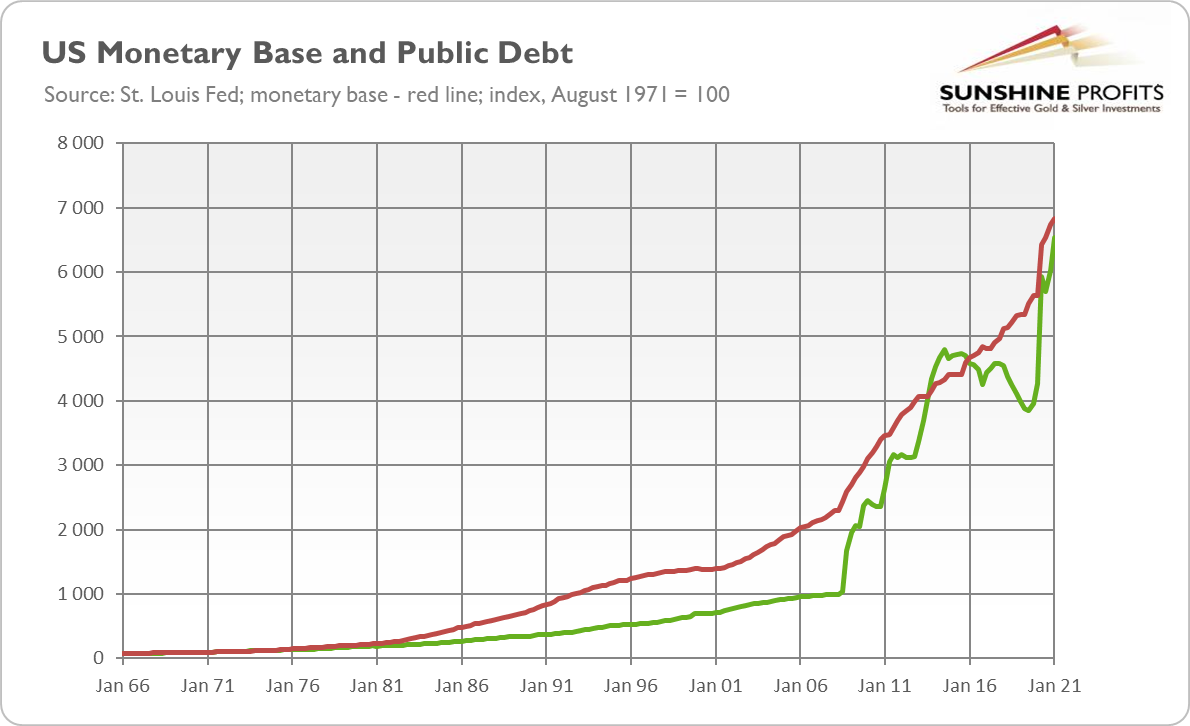
Hence, the closure of the gold window still has an impact on the global economy and the precious metals markets. If gold continued to serve as the ultimate money, monetary and fiscal policies would be more rational and the public debt wouldn’t exceed 100% of GDP in peacetime.
It means that the lack of the gold standard is, somewhat paradoxically, good for gold prices. When Nixon killed the Breton Woods, some analysts claimed that the price of the yellow metal would decline without being linked to the dollar. As we all know, and as the chart below shows, the opposite happened.
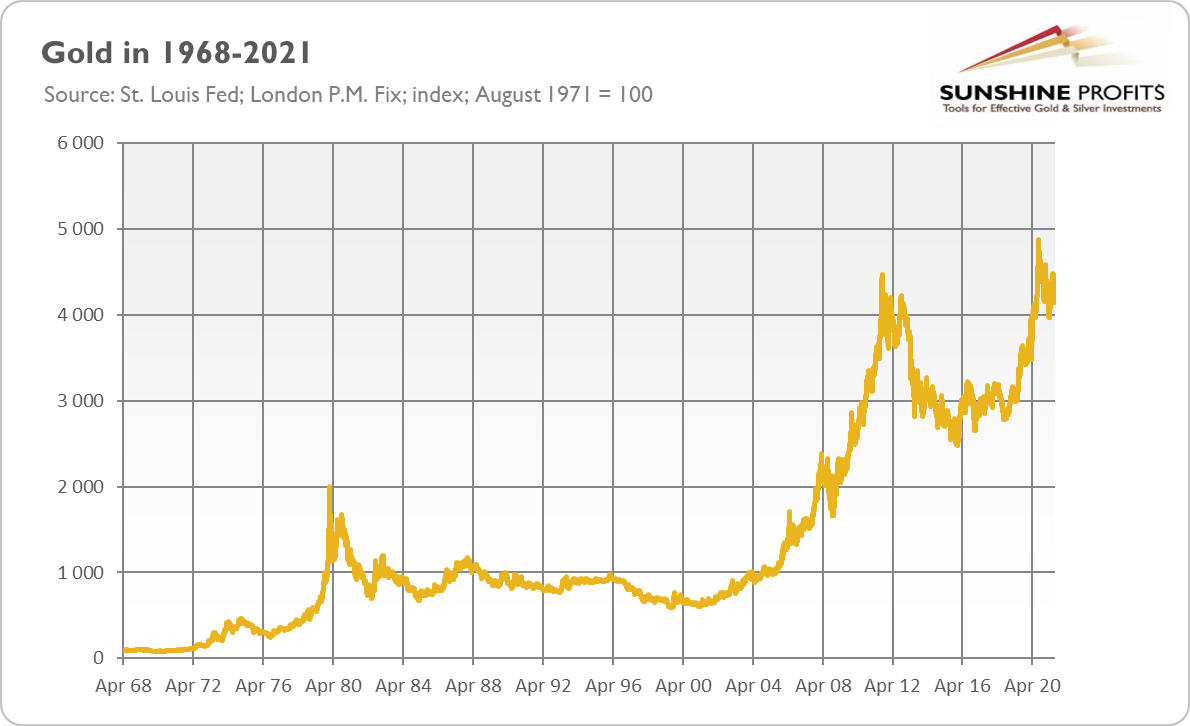
Over the past fifty years, the price of gold has soared about 4100% – or more than 7.7% annually, on average. Additionally, given all the instabilities present in the contemporary monetary system based on fiat currencies, unlimited money-printing and monetization of debt, in the long run, the price of gold may only continue its upward trend.
Thank you for reading today’s free analysis. If you enjoyed it, and would you like to know more about the links between the economic outlook and the gold market, we invite you to read the August Gold Market Overview report. Please note that in addition to the above-mentioned free fundamental gold reports, we provide premium daily Gold & Silver Trading Alerts with clear buy and sell signals. We provide these premium analyses also on a weekly basis in the form of Gold Investment Updates. In order to enjoy our gold analyses in their full scope, we invite you to subscribe today. If you’re not ready to subscribe yet and are not on our gold mailing list yet, we urge you to sign up. It’s free and if you don’t like it, you can easily unsubscribe. Sign up today!
Arkadiusz Sieron, PhD
Sunshine Profits: Effective Investment through Diligence & Care.-----
Disclaimer: Please note that the aim of the above analysis is to discuss the likely long-term impact of the featured phenomenon on the price of gold and this analysis does not indicate (nor does it aim to do so) whether gold is likely to move higher or lower in the short- or medium term. In order to determine the latter, many additional factors need to be considered (i.e. sentiment, chart patterns, cycles, indicators, ratios, self-similar patterns and more) and we are taking them into account (and discussing the short- and medium-term outlook) in our Gold & Silver Trading Alerts.


Gold Market
Free Newsletter
with details not available
to 99% investors
+ 7 days of Gold Alerts
Gold Alerts
More-
Status
New 2024 Lows in Miners, New Highs in The USD Index
January 17, 2024, 12:19 PM -
Status
Soaring USD is SO Unsurprising – And SO Full of Implications
January 16, 2024, 8:40 AM -
Status
Rare Opportunity in Rare Earth Minerals?
January 15, 2024, 2:06 PM

