

Please log in to read the entire text.
If you don’t have a login yet, please select your access package.
Twin deficits could negatively affect the U.S. economy, thereby supporting the yellow metal.
Twins. Many parents will tell you that they double the blessing. But economists would disagree, claiming that twins – i.e., twin deficits – could be negative for the economy. The recent deterioration in the U.S. current account and fiscal balance has sparked renewed debate over the twin deficit and its impact on the exchange rate – and the price of gold.
A twin deficit occurs when large fiscal deficits coexist with big trade deficits. The former happens when the government spends more money than it raises with taxes, while the latter is the result of imports exceeding exports. A historical example of the U.S. twin deficit occurred in the 1980s, when a significant expansion in the federal budget deficit accompanied a sharp deterioration in the nation’s current account balance. According to the Institute for International Economics’ report, “from 1980 to 1986, the federal budget deficit increased from 2.7 percent of GDP to 5 percent of GDP ($220 billion) and the current account deficit increased from 0 to 3.5 percent of GDP ($153 billion).”
Another example might be the 2000s. According to the New York Fed’s research paper, from 2001 to 2005, the U.S. current account and fiscal balances plunged by 3 and 4 percent of GDP, respectively. So, there is some correlation between these two. And some economists even believe that there is a causal relationship, i.e., that increases in budget deficits cause an increase in current account deficits. The link is believed to work as follows: higher deficits increase consumption, so imports expand and the trade deficit widens. However, both deficits actually have a common root: the increase in the money supply. When the Fed creates money ex nihilo to monetize the federal debt, it enables America to both borrow and consume more goods from abroad.
Regardless, in absolute terms, these old twin deficits were miniscule compared to the current one. As the chart below shows, the U.S. current account deficit (green line) has expanded significantly under Trump (despite all the trade wars!) and is approaching the historical record of $800 billion seen in 2006.
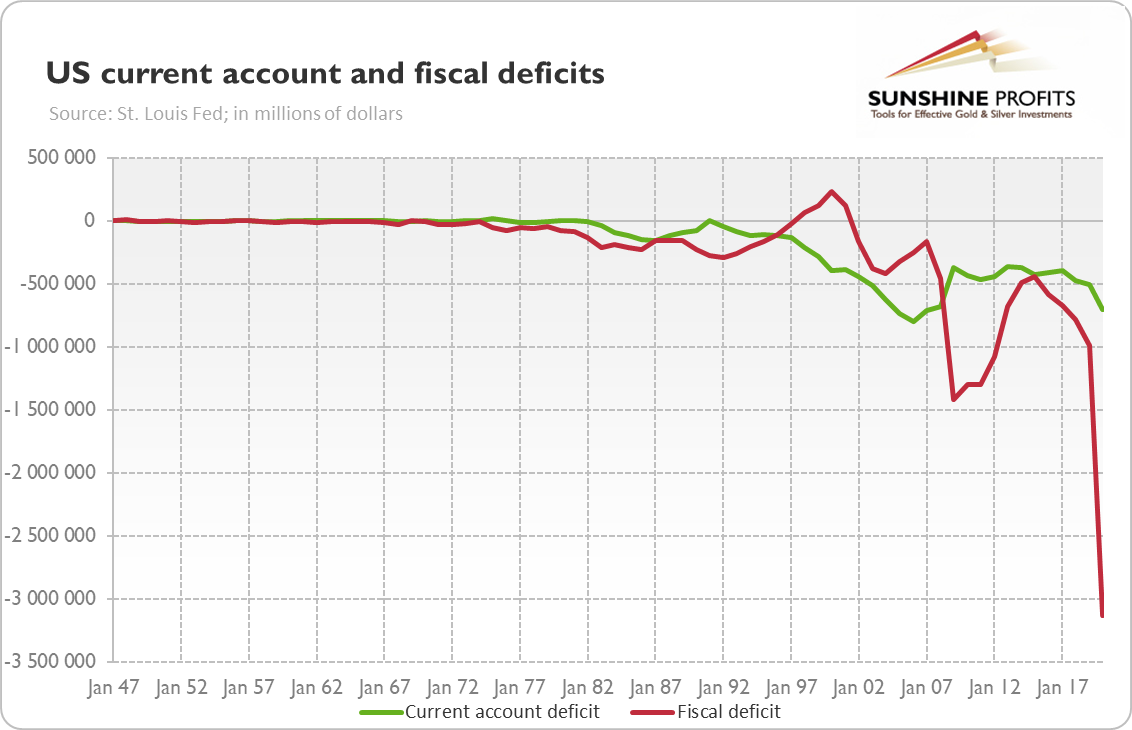
But what happened to the U.S. trade deficit is nothing compared to the fiscal deficit! As you can see in the chart above, it ballooned from $984 billion in fiscal year of 2019 to $3.1 trillion in 2020!
So, if we simply add these two deficits together, we will see that that the U.S. twin deficits have reached a record level. As the chart below shows, it has expended from $850 billion in 2014 to $3.8 trillion in 2020!
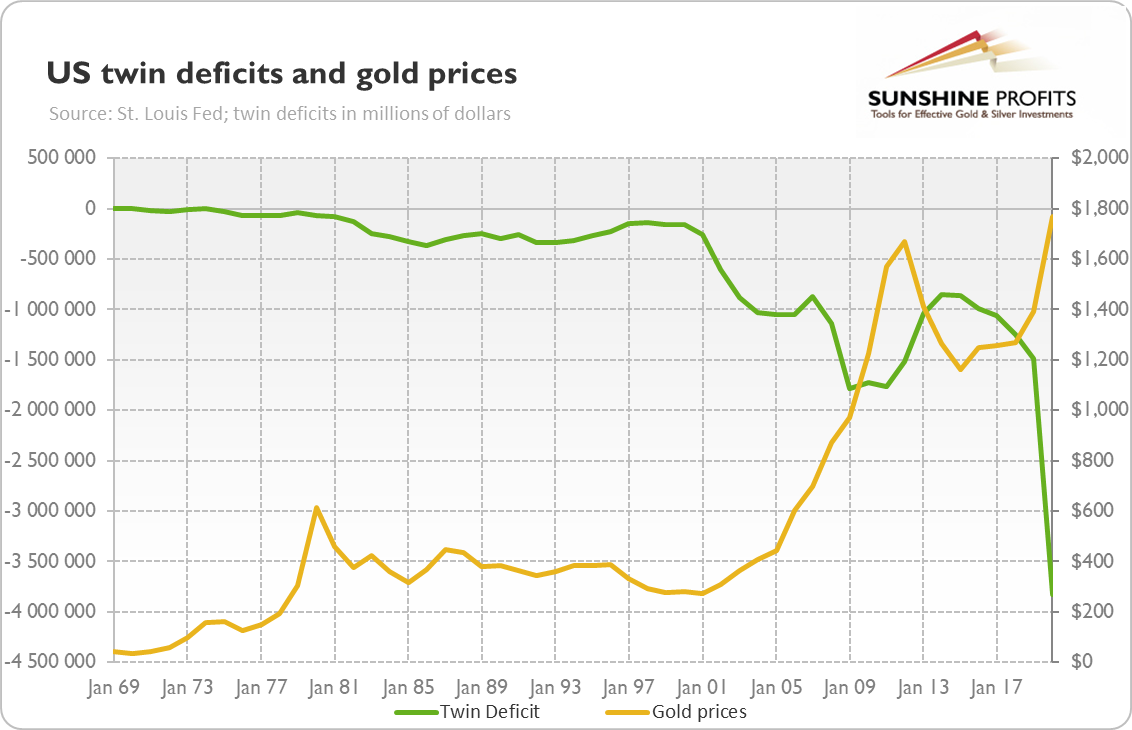
Now, the question is how the twin deficits could affect the price of gold. Well, from looking at the chart above, it’s hard to tell. Gold rallied in the 1970s, when the twin deficit was miniscule, while it entered a bear phase when the twin deficit started to increase. However, the yellow metal skyrocketed both in the 2000s and in the 2020s, when the twin deficit ballooned.
The key issue is what distinguishes the 1980s from the 2000s (and 2020)? I’ll tell you. In the former period, expansionary fiscal policy coincided with tight monetary policy. In consequence, the real interest rates increased, which encouraged capital inflows and strengthened the U.S. dollar. So, gold was melting.
Luckily for the yellow metal, this time, the easy fiscal policy is accompanied by the accommodative monetary policy. The Fed has already slashed the federal funds rate and it’s conducting quantitative easing to suppress the bond yields. Actually, some analysts believe that the U.S. central bank will implement the yield curve control to prevent any significant increases in the interest rates.
Hence, the combination of American monetary drunkenness and fiscal irresponsibility that largely contributed to the great expansion in the twin deficits should result in the weakening of the greenback. This, at least, is what we observed in the 2000s, as the chart below shows.
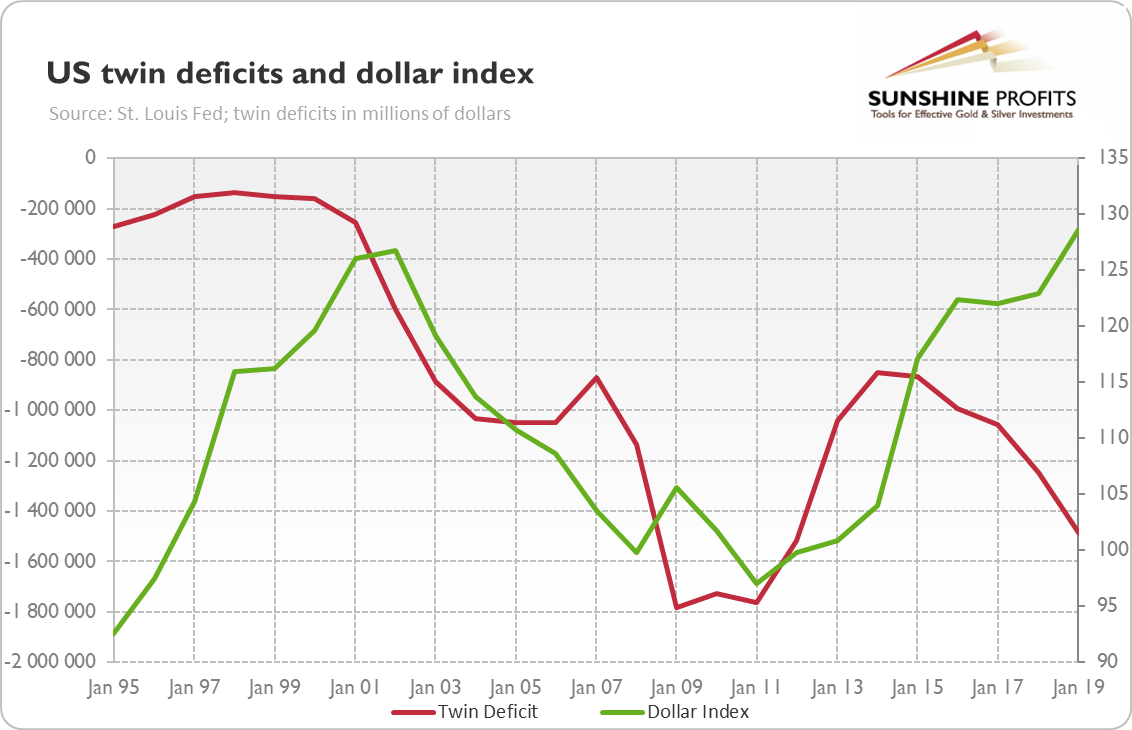
And this depreciation of the U.S. dollar should ultimately support gold prices, especially if we see reflation and the next commodity boom. It’s true that since its peak in August 2020, gold has been positively correlated with the greenback, but the inverse relationship can be restored one day. Investors shouldn’t forget that the dollar is not the only driver of gold prices – other factors also play a role. In the second half of the past year, both the real yields and the risk appetite increased, which outweighed the impact of the weakening dollar. Luckily, the Fed is ready to prevent any significant upward pressure on the Treasury yields coming from the twin deficits. That’s good for gold.
Thank you for reading today’s free analysis. If you enjoyed it, and would you like to know more about the links between the economic outlook, the current (past?) crisis and the gold market, we invite you to read the March Gold Market Overview report. Please note that in addition to the above-mentioned free fundamental gold reports, and we provide premium daily Gold & Silver Trading Alerts with clear buy and sell signals. We provide these premium analyses also on a weekly basis in the form of Gold Investment Updates. In order to enjoy our gold analyses in their full scope, we invite you to subscribe today. If you’re not ready to subscribe yet though and are not on our gold mailing list yet, we urge you to sign up. It’s free and if you don’t like it, you can easily unsubscribe. Sign up today!
Arkadiusz Sieron, PhD
Sunshine Profits: Effective Investment through Diligence & Care.
-----
Disclaimer: Please note that the aim of the above analysis is to discuss the likely long-term impact of the featured phenomenon on the price of gold and this analysis does not indicate (nor does it aim to do so) whether gold is likely to move higher or lower in the short- or medium term. In order to determine the latter, many additional factors need to be considered (i.e. sentiment, chart patterns, cycles, indicators, ratios, self-similar patterns and more) and we are taking them into account (and discussing the short- and medium-term outlook) in our Gold & Silver Trading Alerts.

