

-
Gold Investment Update - Gold's Long-term Turning Point is Here
June 22, 2020, 8:56 AMHistorical precedents are in many a technician's toolbox - and it's a tool they reach for with success repeatedly. Does the yellow metal offer any interesting parallels?
Gold had declined and it recovered, but the above simply prolongs the 2008-2020 analogy; it doesn't invalidate it. Today, gold is attempting to break above the previous highs, but it's not being successful in that.
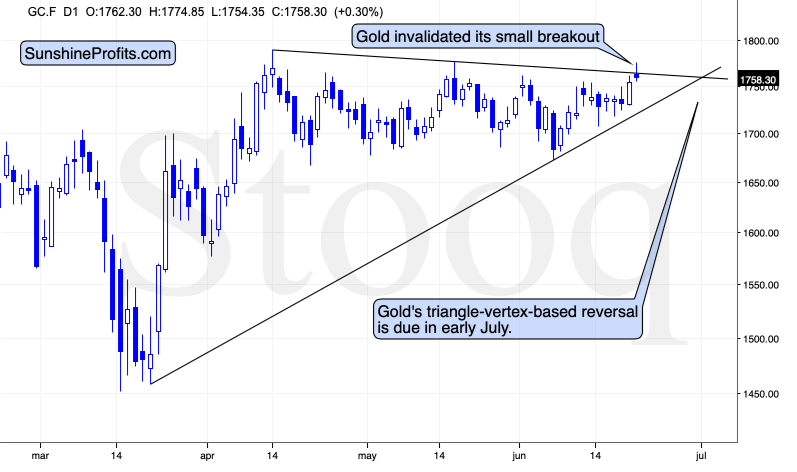
Gold topped about a dollar below the May high and just like it was the case in May, and in April, gold quickly moved down from these levels. Gold futures are at $1,756 at the moment of writing these words, which means that gold invalidated the small breakout above the declining resistance line that's based on the April and May highs.
This is a bearish sign pointing to the repeat of the pattern - gold is likely to once again decline from the current levels to at least $1,680 or so. The emphasis here goes on "at least" as given the bearish support from the media (spreading the coronavirus fear) and the short-term breakout in the USD Index.
The resistance line, above which gold tried to break and the rising support line based on the March and June lows cross more or less in the first days of July. The triangle-vertex-based reversals have pointed to many important tops and bottoms in the recent weeks and months, so perhaps the above-mentioned target date will be the date when gold finally bottoms. If gold slides from here this week, the above will become the most likely outcome.
Speaking of target dates, there's also another very important target date, which is likely to translate into an important reversal.
It's more or less right now, and the technique that is applied here is gold's long-term turning point.
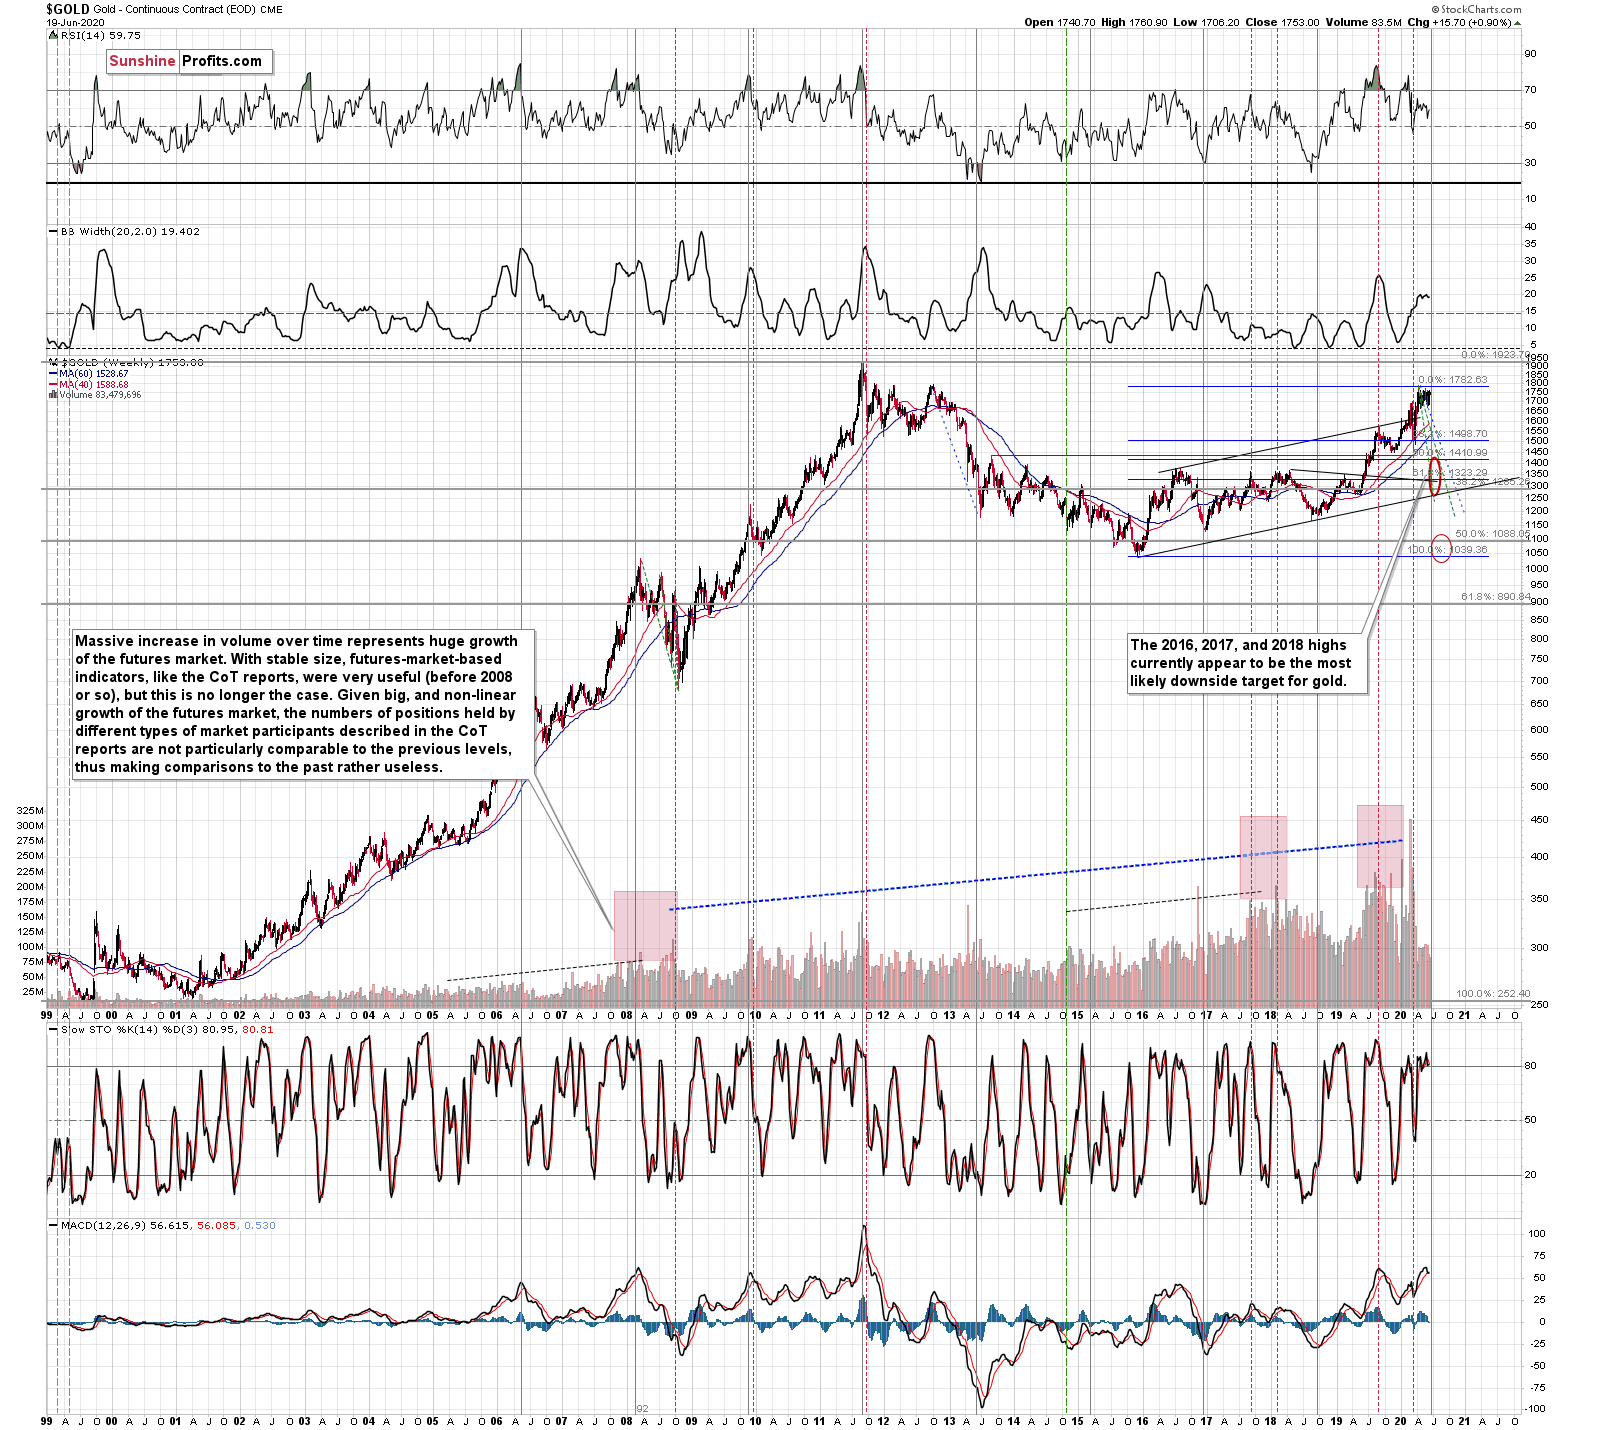
Until the 2011 top, these turning points were tops, and after the 2011 top - in each case - these turning points corresponded to major bottoms. We marked them with vertical, solid, gray lines.
The above means that the upcoming turning point had a slightly bigger chance of being a local bottom, but the most important thing is that there is likely to be some kind of extreme regardless of what type of extreme it is (that's the key difference between turning points and cycles - the latter have tops and bottoms after each other, while turning points could work in either way).
This means that what we saw earlier today might have been much more than just a temporary attempt to move higher. It might have been a major long-term top after which gold is going to slide in a profound manner.
Since the slide in gold is not likely to take long, but rather be relatively quick (similar to what we saw in March, and similar to the final slide that we saw in 2008), it could be the case that both the major top, and the major bottom will be close to the turning point. That's exactly what happened in 2011, which was also the only time when gold was trading above $1,500 during the turning point.
Back then, gold plunged almost $400 in less than a month. Since this kind of decline followed somewhat similar technical development, it's not out of the question that a big and sharp move could happen also in the following 1-3 weeks.
The above also suggests that our "crazy downside targets" are not so crazy after all.
Cup and Handle in Progress?
Naturally, the long-term outlook remains extremely bullish, especially given the possibility of seeing a cup-and-handle formation in gold. The 2011 - now price movement could indeed be the "cup". Generally, the bigger, more symmetrical, and rounder the "cup" is, the more profound and more bullish the implications are.
There is, however, something that's missing from the pattern... We have the cup, but we're missing the handle!
The decline in gold which we wrote about previously would serve as the perfect handle for the massive cup that gold formed in the previous nine years. That's in perfect tune with what we've been expecting for gold anyway - we have been expecting one final slide before the move to new highs, and we would like to stress that getting it would not invalidate the long-term bullishness at all. Conversely, it would confirm it through the cup-and-handle pattern.
Today's Gold Investment Update is based on the flagship Gold & Silver Trading Alert, and includes multiple details, but most importantly, it includes the clear discussion of what will be the sign telling one that gold's move lower is almost certainly completely over. That's the detail, we think you might enjoy, want, and need right now.
Subscribe at a discount today and read today's issue ASAP.
Sincerely,
Przemyslaw Radomski, CFA
Editor-in-chief, Gold & Silver Fund Manager -
Gold Investment Update - Striking Signs for the Second Wave of Profits Just Ahead
June 15, 2020, 8:11 AMAvailable to subscribers only.
-
Gold Investment Update - Gold's Shocking Weakness vs. the USD
June 8, 2020, 9:36 AMAvailable to subscribers only.
-
Gold Investment Update - The Implications of the Monthly Reversal in HUI
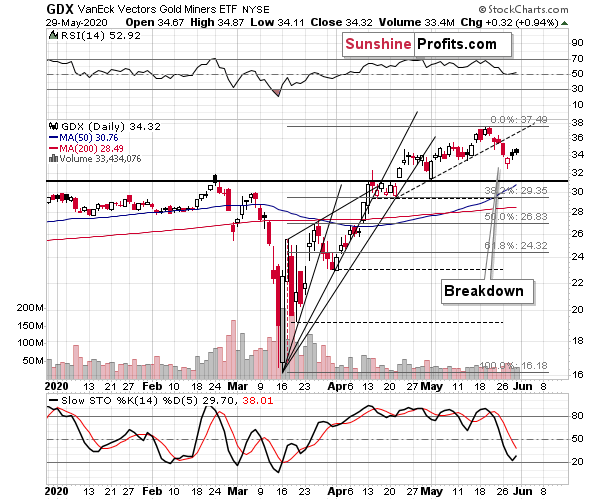
June 1, 2020, 7:47 AMThere is a laser-precision technique that tells us whether the precious metals market is going to move higher or lower, and it could take form of a confirmation or invalidation of a major breakout. We just had the make-or-break situation in gold mining stocks, and previously described the HUI Index - flagship proxy for the gold miners - in the following way:
The HUI Index declined significantly, and then it rebounded significantly.
Both are likely linked. Miners first declined more sharply than they did in 2008, so the rebound was also sharper. Based on the stimulus and gold reaching new yearly highs, miners also rallied, and tried to move to new yearly highs. It's not surprising.
However, if the general stock market is going to decline significantly one more time, and so will gold - and as you have read above, it is very likely - then miners are likely to slide once again as well. This would be in tune with what happened in 2008.
At this time, it may seem impossible or ridiculous that miners could slide below their 2015 lows, but that's exactly what could take place in the following weeks. With gold below their recent lows and the general stock market at new lows, we would be surprised not to see miners even below their 2020 lows. And once they break below those, their next strong resistance is at the 2016 low. However, please note that miners didn't bottom at their previous lows in 2008 - they moved slightly lower before soaring back up.
Please note that the HUI Index just moved to its 2016 high which serves as a very strong resistance. Given the likelihood of a very short-term (1-2 days?) upswing in stocks and perhaps also in gold (to a rather small extent, but still), it could be the case that gold miners attempt to rally above their 2016 high and... Spectacularly fail, invalidating the move. This would be a great way to start the next huge move lower.
And what happened last week?
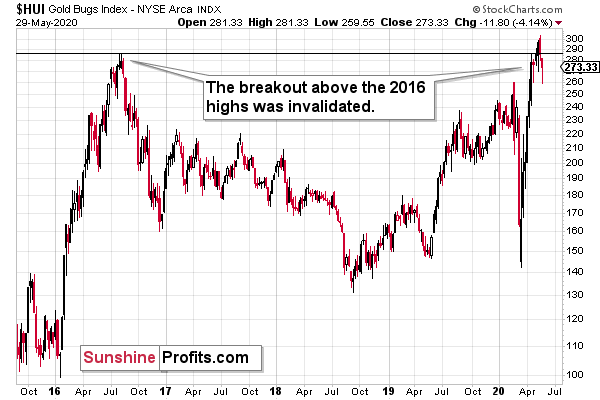
The HUI Index invalidated the breakout above its 2016 high in terms of the weekly closing prices and also in terms of the monthly closing prices.
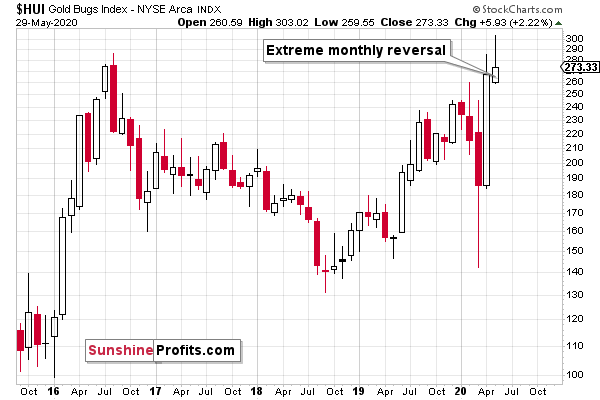
This is a perfectly bearish sign, especially since the HUI Index has been forming an extremely clear monthly shooting star candlestick. This is a clear formation with clear implications - gold miners are likely to decline in June.
It's important to note that on a daily basis, miners have barely moved higher on Friday. They had a good reason to do so - even two reasons. Both: general stock market and - most importantly - gold / GLD moved higher so miners should have rallied as well. They didn't, which shows that they are much more likely to decline in the short term instead.
Combining two key gold trading tips: silver's exceptional strength with miners' exceptional weakness provides us with a great trading opportunity.
Thank you for reading today's free analysis. Please note that it's just a small fraction of today's full Gold Investment Update.. The latter includes multiple details, but most importantly, it includes the clear discussion of what will be the sign telling one that gold's move lower is almost certainly completely over. That's the detail, we think you might enjoy, want, and need right now.
Subscribe at a discount today and read today's issue ASAP.
Sincerely,
Przemyslaw Radomski, CFA
Editor-in-chief, Gold & Silver Fund Manager -
Gold Investment Update - Signs from Gold, USDX and Stocks Just Keep Coming In
May 27, 2020, 5:34 AMWhile every year is unique in its own right, looking at a series of them offers quite some tendencies that can be profitably exploited by the astute trader and investor. This is where seasonality comes, and precious metals are no exception. What message does the history send for the PMs complex in June?
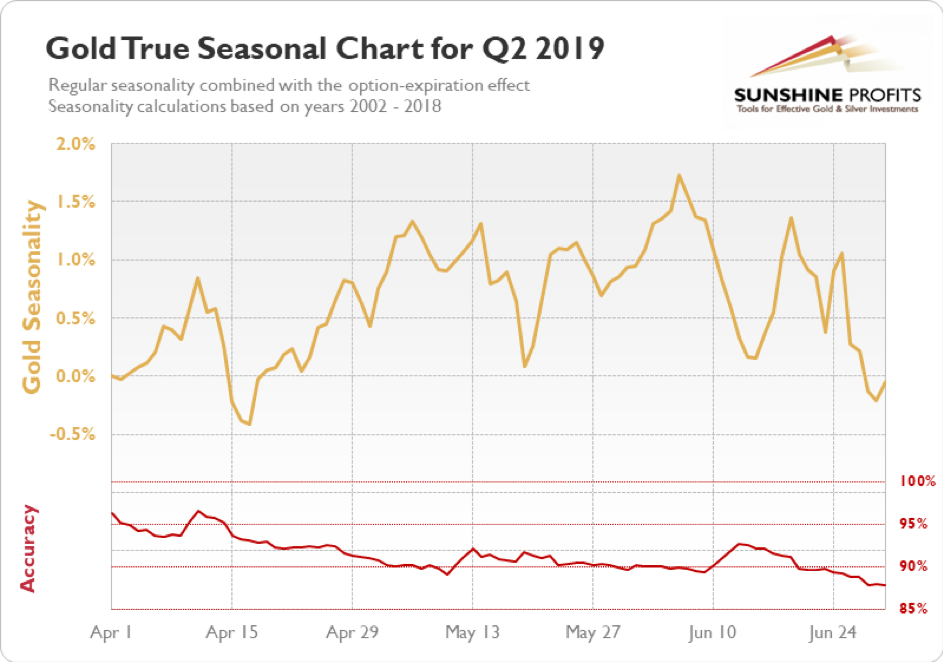
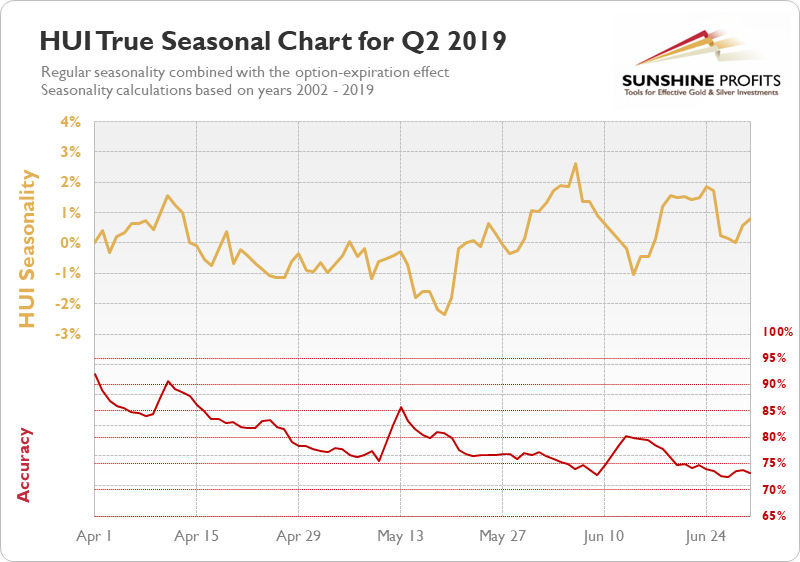
Gold (seasonally) and gold miners (seasonally) move tend to top in early June, so it might be the case that we'll see another attempt to move higher here, and then the decline would take place during June.
Interestingly, there were usually two triggers for these moves: one from the USD Index, and the other from the stock market.
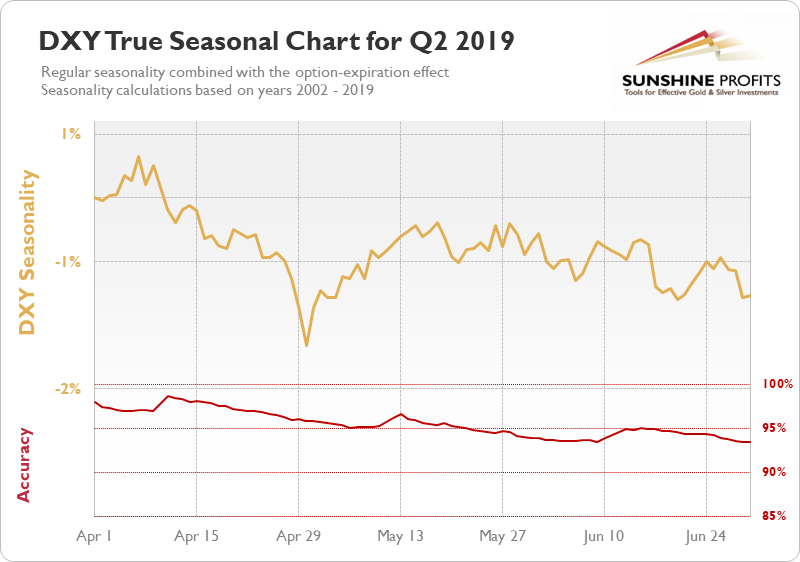
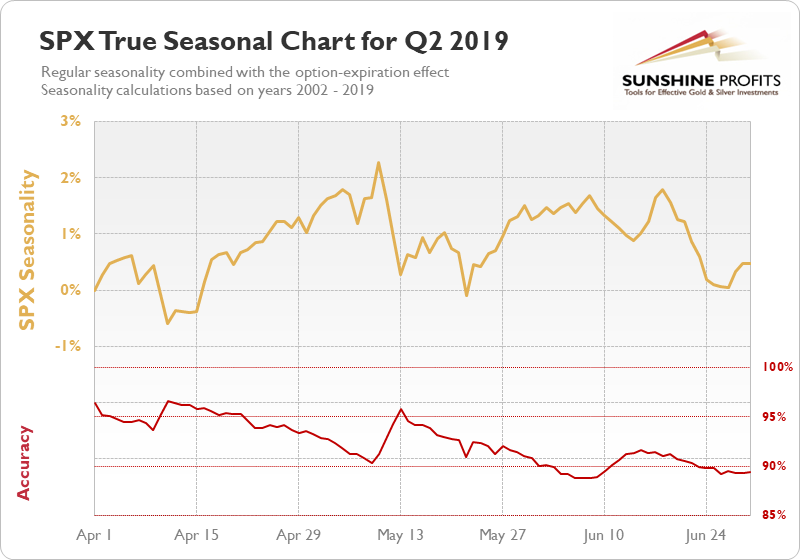
The USDX (seasonally) tends to bottom in early June, while stocks (seasonally) tend to form a local top. These moves are not huge, though, and the accuracy for the seasonality-based forecasts is lowest in the entire quarter.
This means that while a bottom in the USD Index and a top in stocks is likely to be "somewhere near", it doesn't have to take place exactly after May ends. In other words, we should already be on the lookout for either bullish or bearish signs, instead of blindly trusting the seasonal factors. They shed some light but the light itself it dimmed, like the one provided by a candle, instead of one being provided by a laser pointer.
Gold Miners' and Their 2016 High
The laser-precision technique that tells us whether the precious metals market is going to move higher or lower, could take form of a confirmation or invalidation of a major breakout. And we currently have this exact make-or-break situation in case of gold mining stocks. We previously described the above HUI Index - flagship proxy for the gold miners - in the following way:
The HUI Index declined significantly, and then it rebounded significantly.
Both are likely linked. Miners first declined more sharply than they did in 2008, so the rebound was also sharper. Based on the stimulus and gold reaching new yearly highs, miners also rallied and tried to move to new yearly highs. It's not surprising.
However, if the general stock market is going to decline significantly one more time, and so will gold - and as you have read above, it is very likely - then miners are likely to slide once again as well. This would be in tune with what happened in 2008.
At this time, it may seem impossible or ridiculous that miners could slide below their 2015 lows, but that's exactly what could take place in the following weeks. With gold below their recent lows and the general stock market at new lows, we would be surprised not to see miners even below their 2020 lows. And once they break below those, their next strong resistance is at the 2016 low. However, please note that miners didn't bottom at their previous lows in 2008 - they moved slightly lower before soaring back up.
Please note that the HUI Index just moved to its 2016 high which serves as a very strong resistance. Given the likelihood of a very short-term (1-2 days?) upswing in stocks and perhaps also in gold (to a rather small extent, but still), it could be the case that gold miners attempt to rally above their 2016 high and... Spectacularly fail, invalidating the move. This would be a great way to start the next huge move lower.
And what happened last week?
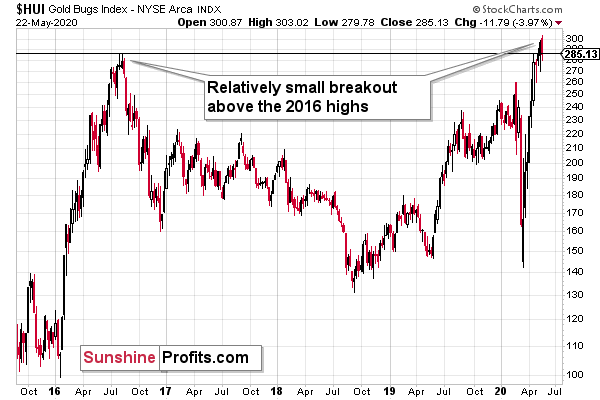
The HUI Index invalidated the breakout above the 300 level, and it also invalidated the breakout above the 2016 high (286.05) in intraday terms by closing at 285.13. This made the bearish picture for gold miners more bearish. The final confirmation of the top being in, will be gold stocks index's close below the highest weekly close of 2016 - 278.61.
The reason we're giving so much attention to the 2016 high right now and so little to anything else - at least in case of the gold stocks - is that what happens with regard to it really is the key to the miners' technical outlook. Confirmed breakout above the 2016 high would be likely to result in a bigger move higher, while its invalidation is likely to result in a bigger move lower.
Given the fact that gold is not moving up despite USD Index's sizable daily decline, it seems that we might see declines in gold and gold miners shortly (as soon as the USDX regains strength), and the decline below HUI's highest weekly close of 2016 will serve as a great bearish confirmation for gold, silver, and miners alike.
Thank you for reading today's free analysis. Please note that it's just a small fraction of today's full Gold Investment Update. The latter includes multiple details, but most importantly, it includes the clear discussion of what will be the sign telling one that gold's move lower is almost certainly completely over. That's the detail, we think you might enjoy, want, and need right now.
Subscribe at a discount today and read today's issue ASAP.
Sincerely,
Przemyslaw Radomski, CFA
Editor-in-chief, Gold & Silver Fund Manager
Gold Alerts
More-
Status
New 2024 Lows in Miners, New Highs in The USD Index
January 17, 2024, 12:19 PM -
Status
Soaring USD is SO Unsurprising – And SO Full of Implications
January 16, 2024, 8:40 AM -
Status
Rare Opportunity in Rare Earth Minerals?
January 15, 2024, 2:06 PM
Dear Sunshine Profits,


