

-
Gold Investment Update - It's Ready, Steady, Go for the PMs
April 15, 2020, 10:38 AMIt's certainly a safe bet to say that gold and the dollar don't move in random ways. That's an understatement as the USD moves exert great influence on the yellow metals' prices, like it or not. The changing strength and direction of their relationship is a telling factor, so it pays off to ask what message it's sending these days.
On April 6th, we wrote that gold could first rally to or slightly above its 2020 high and decline in a volatile manner shortly thereafter. The former has already taken place, and now it seems that the latter will take place.
Since the USD Index is such an important piece of the puzzle, let's take a look at its charts.
More on the USD Index and Gold
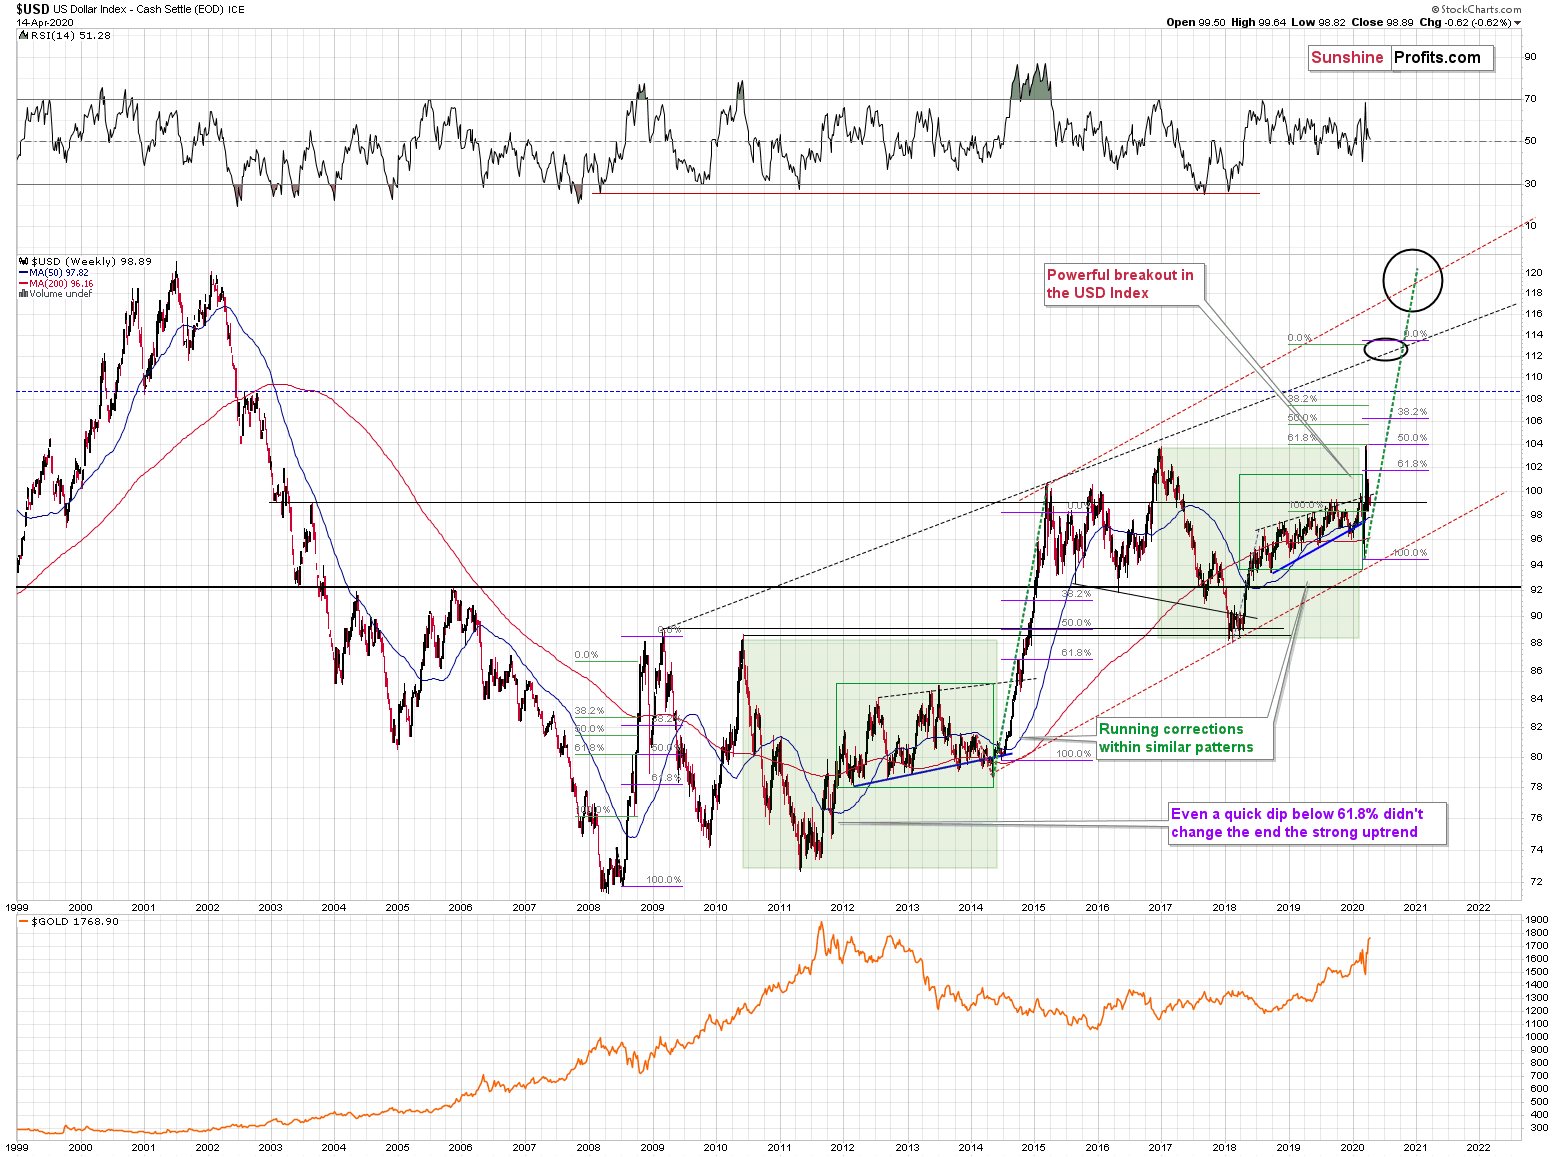
You already saw the most important USD Index chart 2 charts ago - the USDX is after a major, long-term breakout that was confirmed a few times, so it's now in a strong long-term uptrend. Let's keep in mind that it doesn't mean that the situation in the US is perfect - it means that it's better than in other territories - mostly in the EU and Japan. And that does seem to be the case.
Having said that let's take a look at the above chart. Quoting our previous comments on it appears justified as practically all the long- and medium-term points remain up-to-date.
The USD Index was previously (for the entire 2019 as well as parts of 2018 and 2020) moving up in a rising trend channel (all medium-term highs were higher than the preceding ones) that formed after the index ended a very sharp rally. This means that the price movement within the rising trend channel was actually a running correction, which was the most bullish type of correction out there.
If a market declines a lot after rallying, it means that the bears are strong. If it declines a little, it means that bears are only moderately strong. If the price moves sideways instead of declining, it means that the bears are weak. And the USD Index didn't even manage to move sideways. The bears are so weak, and the bulls are so strong that the only thing that the USD Index managed to do despite Fed's very dovish turn and Trump's calls for lower USD, is to still rally, but at a slower pace.
We previously wrote that the recent temporary breakdown below the rising blue support line was invalidated, and that it was a technical sign that a medium-term bottom was already in.
The USD Index soared, proving that invalidation of a breakdown was indeed an extremely strong bullish sign.
Interestingly, that's not the only medium-term running correction that we saw. What's particularly interesting is that this pattern took place between 2012 and 2014 and it was preceded by the same kind of decline and initial rebound as the current running correction.
The 2010 - 2011 slide was very big and sharp, and it included one big corrective upswing - the same was the case with the 2017 - 2018 decline. They also both took about a year. The initial rebound (late 2011 and mid-2018) was sharp in both cases and then the USD Index started to move back and forth with higher short-term highs and higher short-term lows. In other words, it entered a running correction.
The blue support lines are based on short-term lows and since these lows were formed at higher levels, the lines are ascending. We recently saw a small breakdown below this line that was just invalidated. And the same thing happened in early 2014. The small breakdown below the rising support line was invalidated.
Since there were so many similarities between these two cases, the odds are that the follow-up action will also be similar. And back in 2014, we saw the biggest short-term rally of the past 20+ years. Yes, it was bigger even than the 2008 rally. The USD Index soared by about 21 index points from the fakedown low.
The USDX formed the recent fakedown low at about 96. If it repeated its 2014 performance, it would rally to about 117 in less than a year. Before shrugging it off as impossible, please note that this is based on a real analogy - it already happened in the past.
In fact, given this month's powerful run-up, it seems that nobody will doubt the possibility of the USD Index soaring much higher. Based on how things are developing right now, it seems that the USD Index might even exceed the 117 level, and go to 120, or even higher levels. The 120 level would be an extremely strong resistance, though.
Based on what we wrote previously in today's analysis, you already know that big rallies in the USD Index are likely to correspond to big declines in gold. The implications are, therefore, extremely bearish for the precious metals market in the following months.
On March 23rd, we wrote that the USD Index was ripe for a correction, and that was indeed the case.
However, a few weeks passed, and the USD Index now appears to be ready for another powerful upswing.
We saw the first very strong short-term signs of it yesterday. Here's what we wrote:
Speaking of early March... The USD Index just did something that it also did back then.
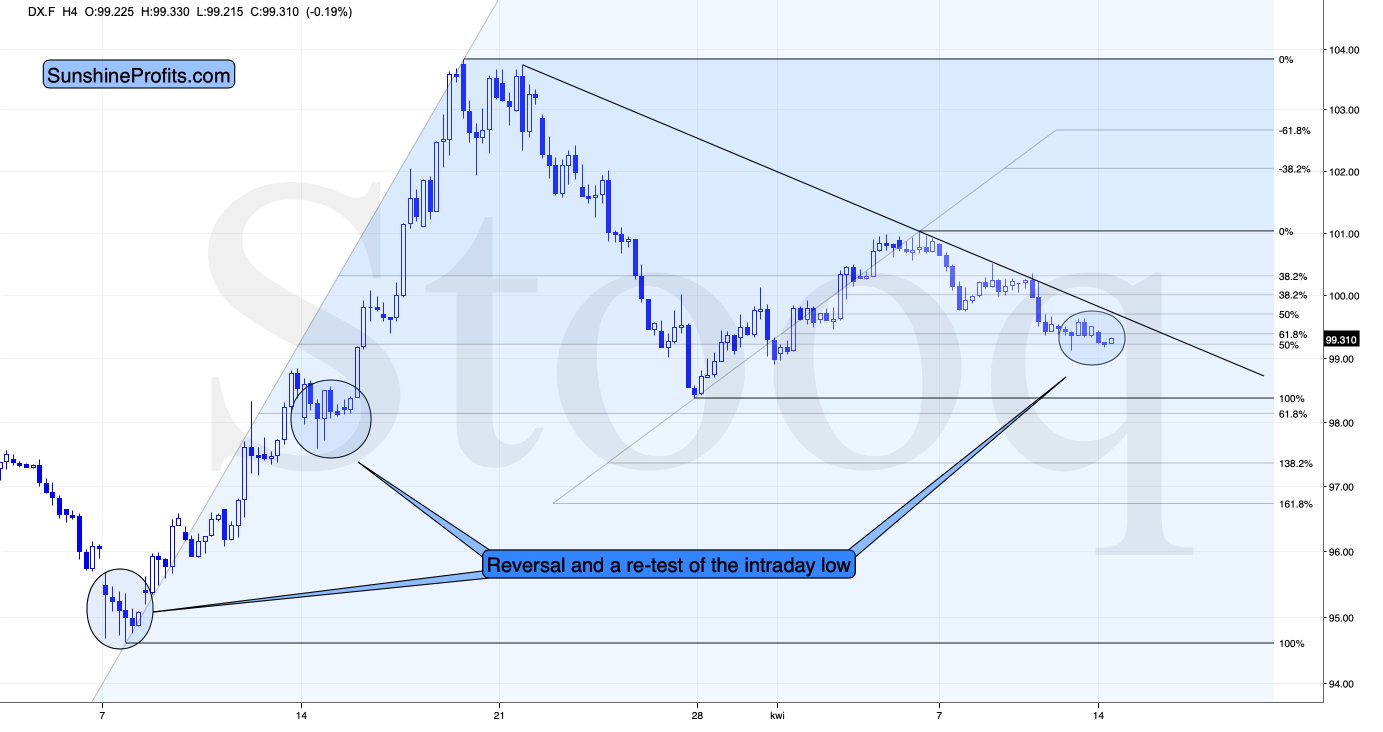
Looking at the 4-hour candlestick chart, we see that the USD Index just formed a reversal and is now testing the previous lows. There were very few 4-hour reversals in the recent days, but when we saw them, big and fast rallies followed. The early-March bottom is particularly similar to the current situation as the USD Index is - just like back then - after a visible decline, and the 4h reversal was followed by a re-test of the intraday low.
What happened next?
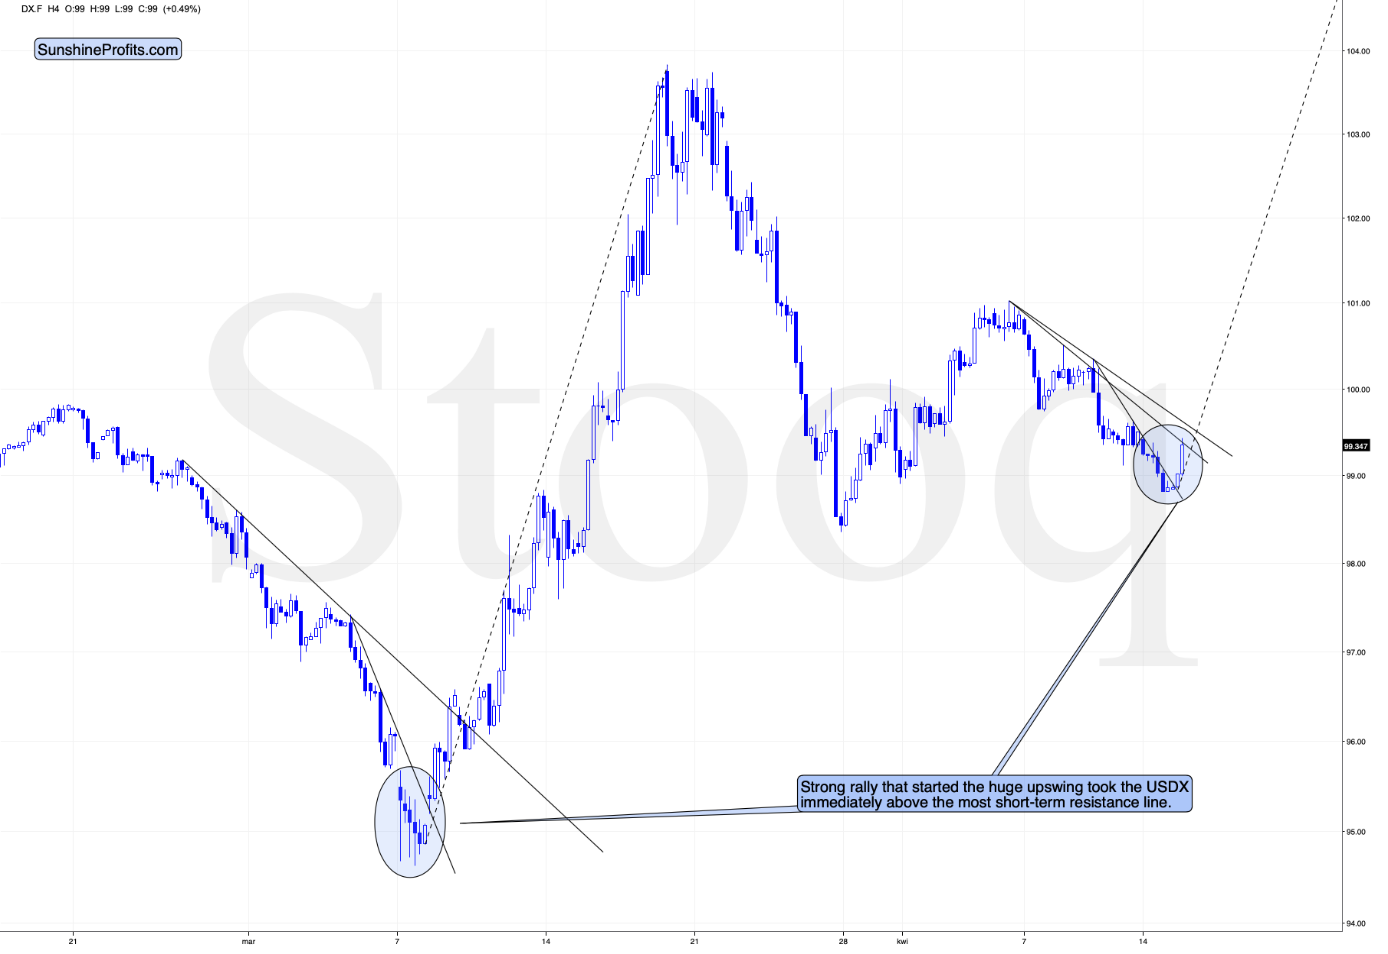
The USD Index moved below the intraday low of the reversal and then soared back up - exactly as it did in early March. And just like what it did back then, the USDX rallied immediately after the bottom and it did so in a sharp manner, especially right after breaking above the most short-term declining resistance line.
At the same time, the USD Index invalidated the small breakdown below the April 1st low.
Once the USD Index soars above the upper declining resistance line (currently at about 99.6) it will be relatively clear that the short-term bottom is already in and another big upswing has just begun.
That line will be the final short-term confirmation, though. The most important line is the one that the USX is testing right now. It's the one based on the April 6th and April 8th tops. Once the USDX breaks above it, the short-term odds will be on the bulls' side and it will be clearly visible for many traders, not only for those who pay attention to the price pattern analogies and are able to detect the bottoms earlier (such as us). It could be the case that when you read this, the breakout above this line is already confirmed.
How could the above translate into a gold price prediction?
The 2008 USD - Precious Metals Lesson
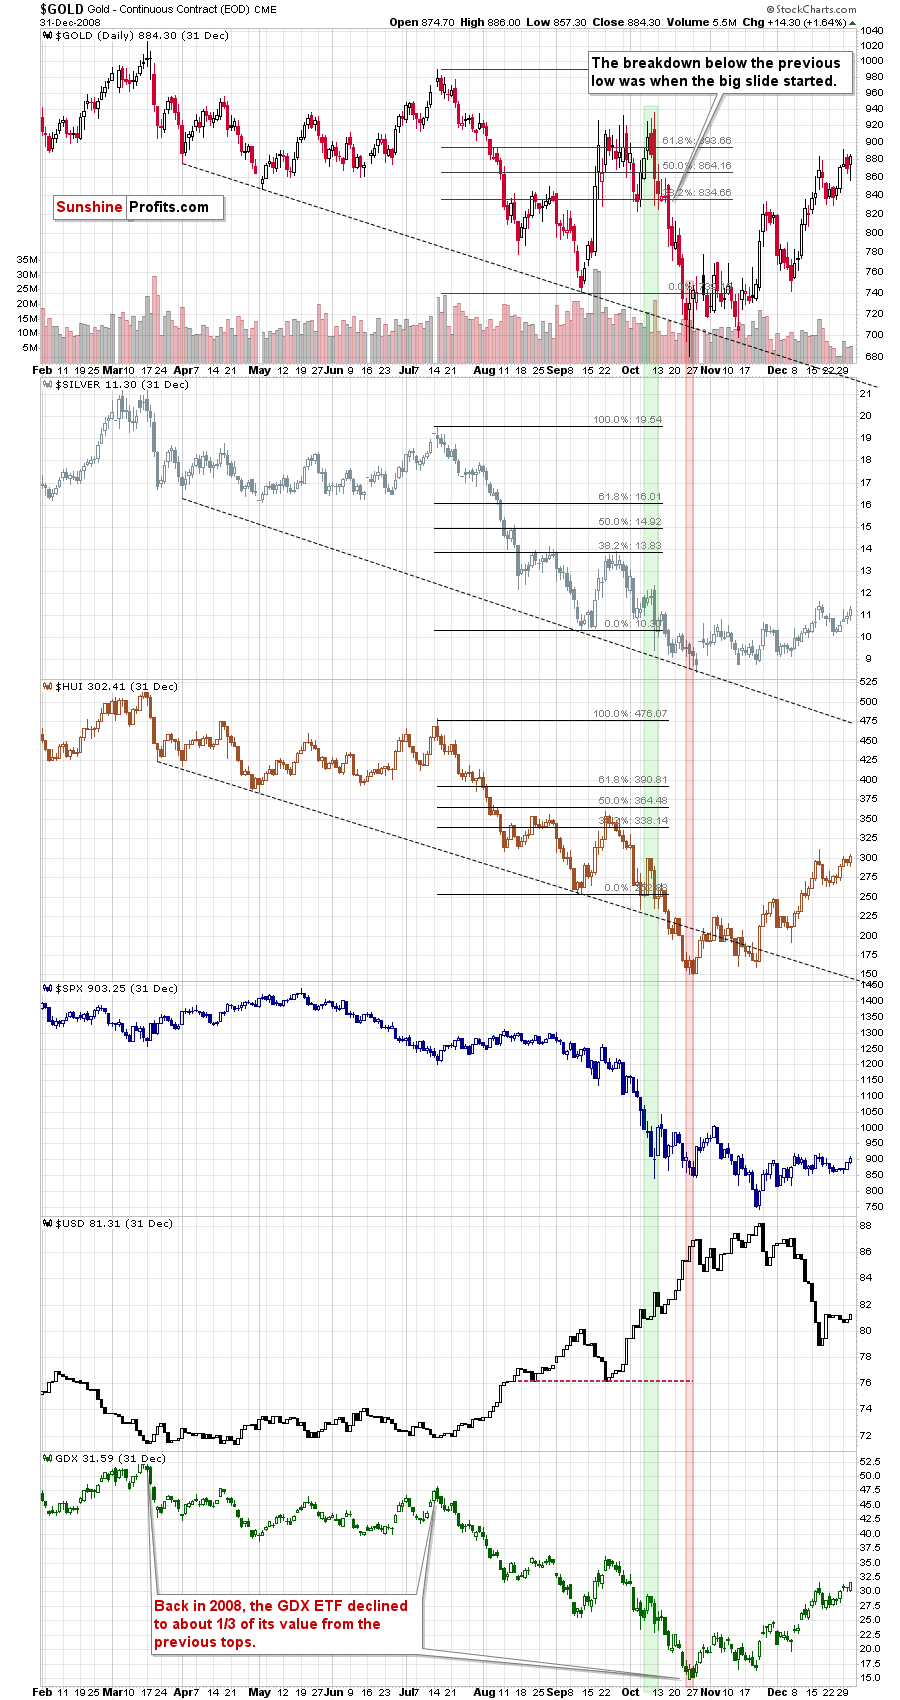
Please note what triggered the final decline in gold, silver, and mining stocks. It was the continuation of the rally in the USD Index. The first part of the decline in gold took place when the USD Index was rallying, and it soared back up when the USDX corrected.
Interestingly, the yellow metal ignored the first (late-September) rally in the USD Index and gold topped once the USD Index paused, likely based on the assumption that the USDX uptrend was already over at that time.
We saw something similar right now. Gold generally ignored USD's early-April upswing. When the USD Index corrected, gold soared, likely based on the assumption that the USDX uptrend was already over.
Right now, the USD Index seems to have started to take off once again. And this time, gold is reacting to it - just like it did in early October 2008. At the moment of writing these words, the USD Index is up by 0.55%, while gold is down by 1.83% (over $30). This may not seem much, but it's the biggest intraday decline in gold that we saw this month. And there are still a few hours left before the markets open in the US today. Also, silver is down by 3.3% and it just - once again - invalidated the breakout above $16.
As the USD Index rally unfolds, the precious metals market is likely to slide, just like it did in 2008.
Thank you for reading today's free analysis. If you'd like to supplement the above with details regarding the details of our current trading positions (and the upcoming ones), or the targets of the upcoming sizable moves in gold, silver and the miners for that matter, we encourage you to subscribe to our Gold & Silver Trading Alerts. You might also be interested in our new service - weekly Gold Investment Updates, which we have recently introduced, and which we provide at promotional terms. Try them out today.
Thank you.
Sincerely,
Przemyslaw Radomski, CFA
Editor-in-chief, Gold & Silver Fund Manager -
Special Week-end Gold Investment Update
April 11, 2020, 10:28 PMAvailable to premium subscribers only.
-
Gold Investment Update - The Powerful and Applicable 2008 Lessons Finetuned
April 6, 2020, 9:57 AMThe yellow metal and its fiat nemesis. Gold and the dollar certainly move not in a random relation to each other. The strength and direction of one taking the cue from the other changes over time, but what does it tell us about the present moment?
The key point with regard to the US currency is that it appears to have already ended its pullback and is now ready to soar well above its previous 2020 high.How do we know that the pullback is most likely over?
Because the USD Index already rallied for (actually more than) two consecutive trading days.
USDX on the Rise
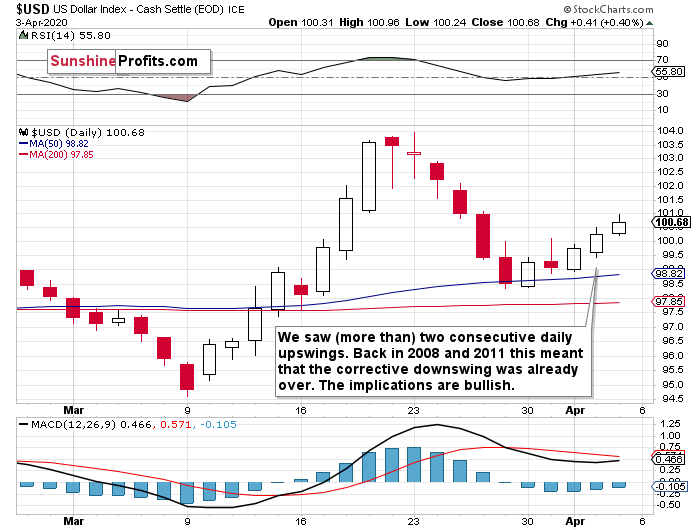
The USD Index just posted a daily rally and it was the third daily rally in a row. This may not seem significant at first sight, but it is significant, because that was what confirmed that the downward correction was already over in case of both similar price moves: the 2008 and 2011 one.
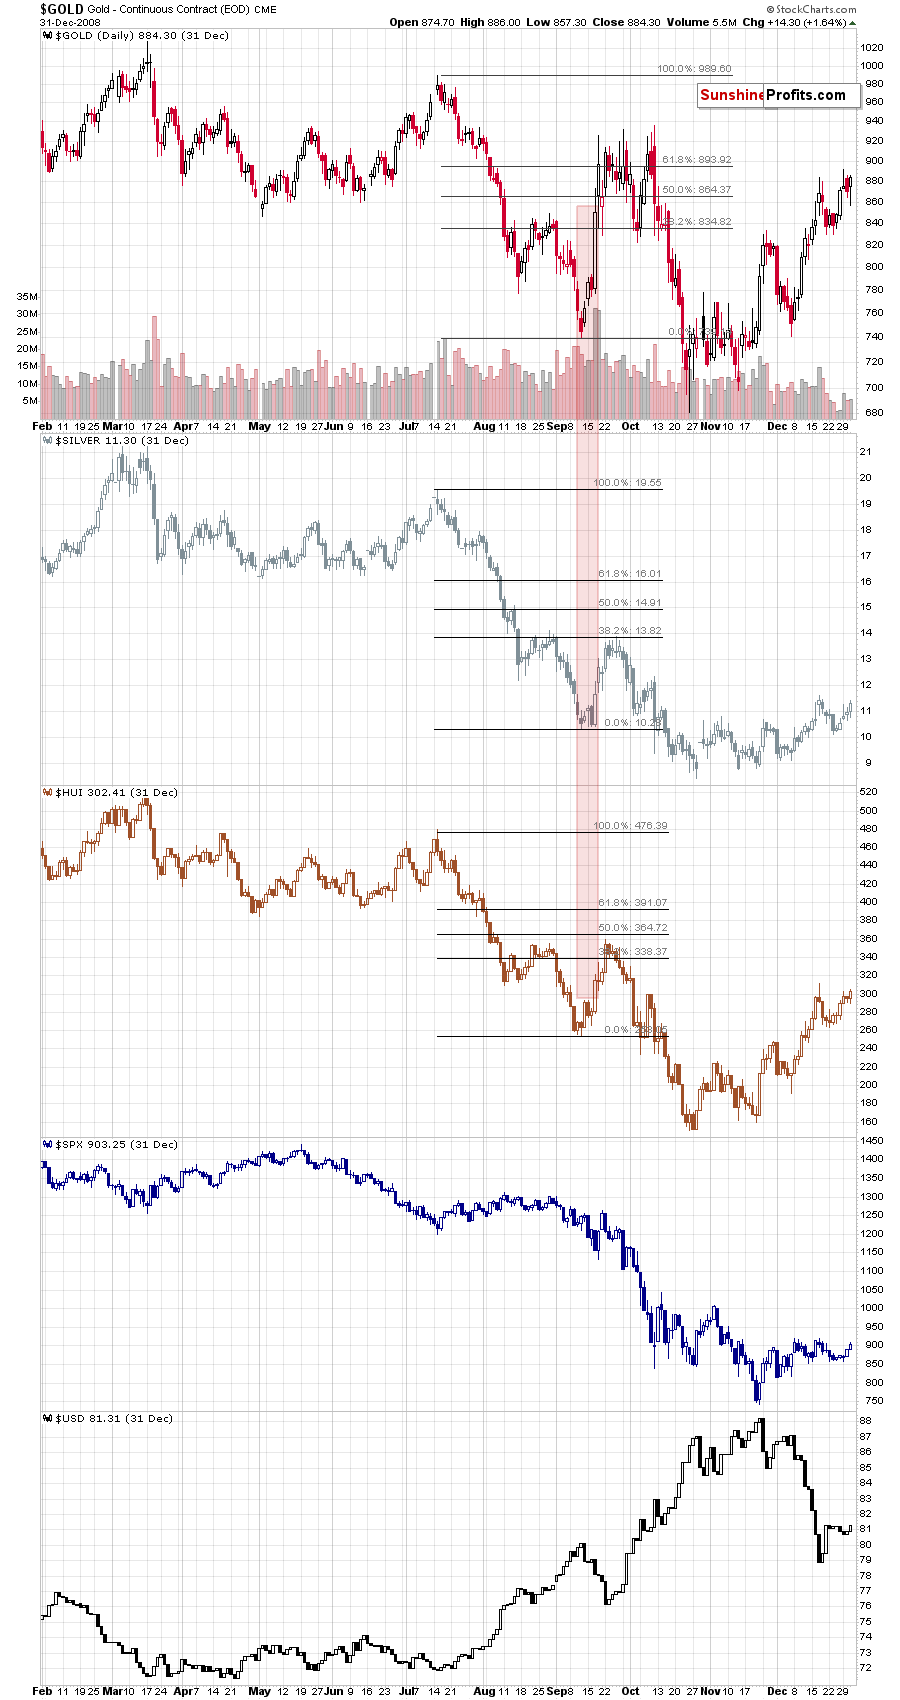
We compared the corrections in similar times and here's what we found.

Based on the above chart, we see that there were two similar cases to what we see today - one in 2008 and the other in 2011. These years are also similar due to the fact that in both cases we saw major tops in gold.
Given the size of the most recent rally, the 2014-2015 rally might appear similar, but the correction that we saw back then, was not big enough and the preceding rally was not sharp enough to be really comparable. That's why we're focusing on 2008 and 2011.
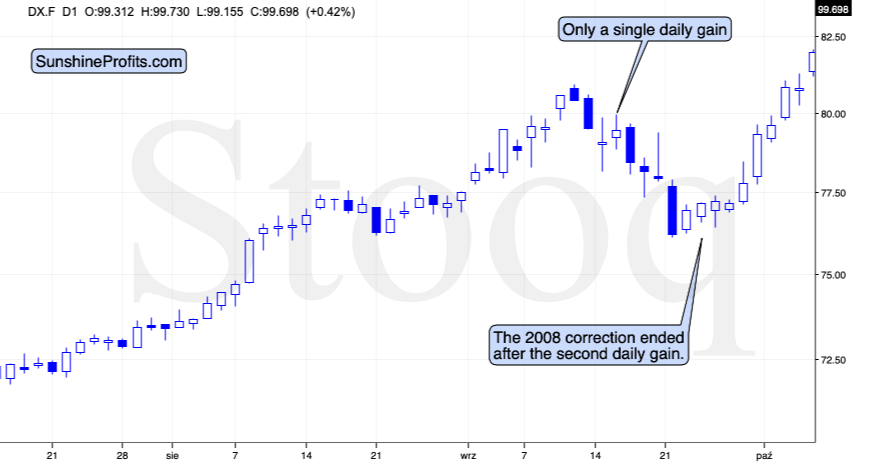
In 2008, the USDX corrected a bit below its 50% retracement, but not to its 61.8% retracement - just like it did recently. There were moves both up and down during the corrective downswing, and the thing that confirmed its end, was the second daily gain.
And in 2011?
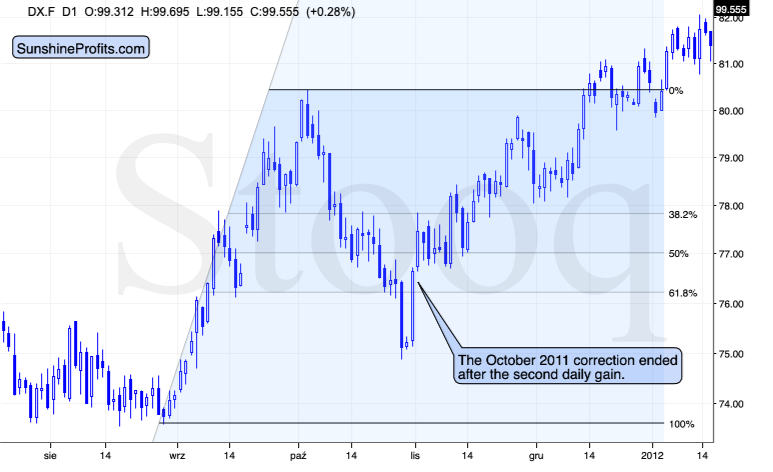
Exactly the same thing was the case. The shape of the decline was different, and the decline was deeper (it moved below the 61.8% retracement but the USDX stayed there for just 2 trading days), but once we saw two daily gains in a row, it served as a confirmation that the decline was over.
We already got this bullish confirmation, so the USD Index's rally is now likely to continue.
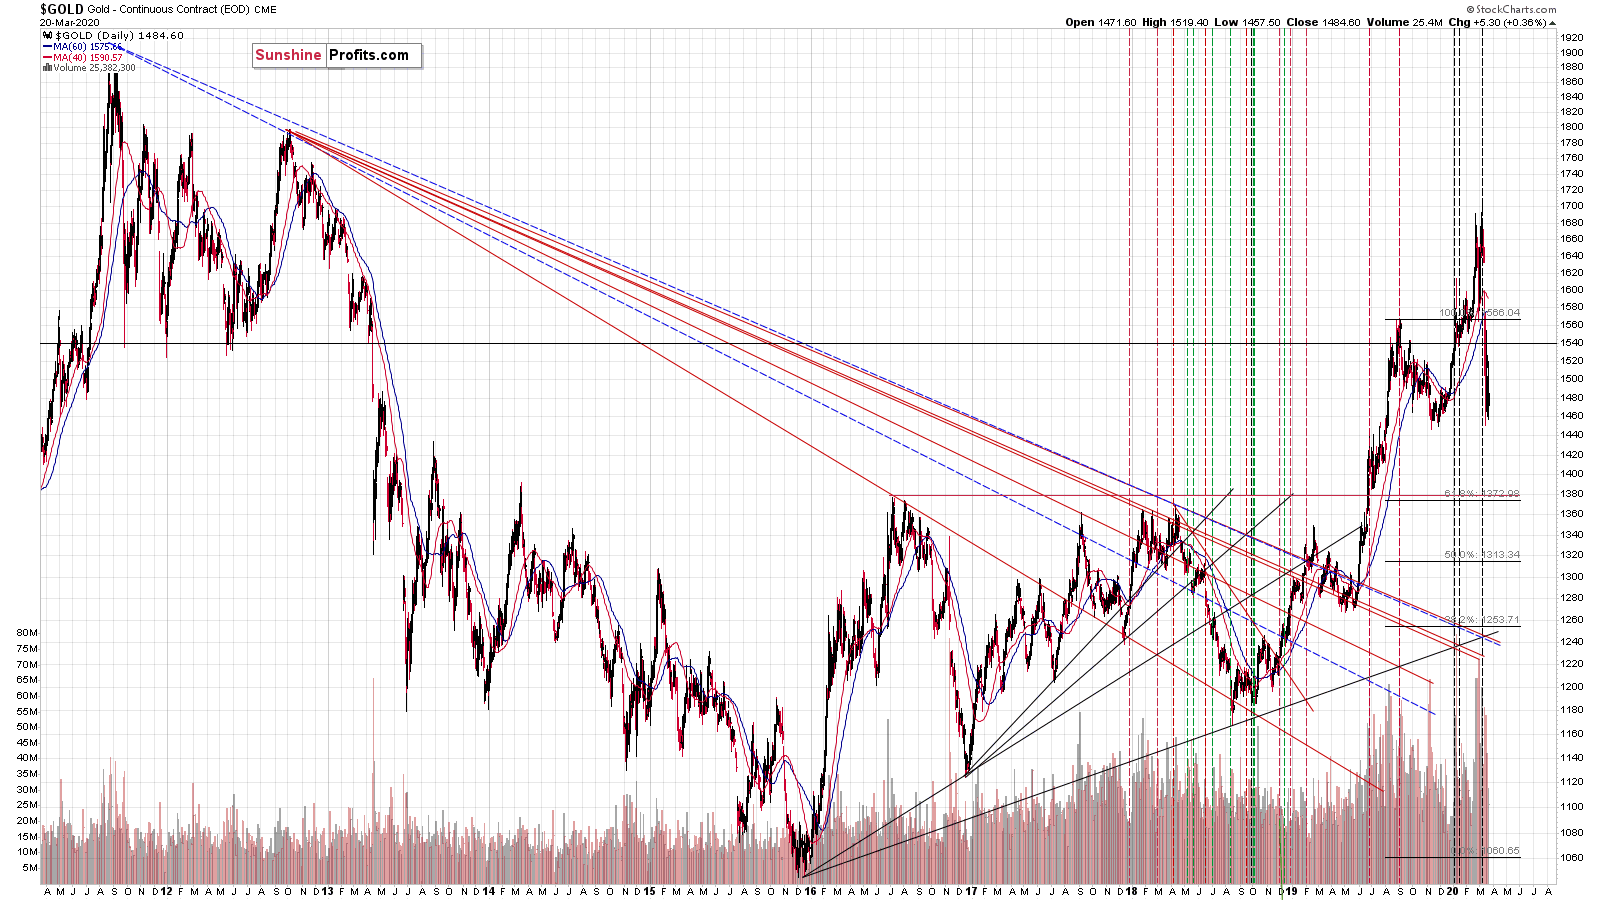
The good news is that since we know that the correction is most likely over, we can use Fibonacci extension tools based on the previous rally and the correction to estimate how high the USD Index is likely to move before this significant, yet short-term rally is over. Once the short-term rally is over, it would probably be followed by a more meaningful correction and then another wave up, but that's not the key information from the precious metals investor's and trader's point of view, because PMs and miners are likely to bottom even before the USD Index tops.
So, how high would the USD Index be likely to rally in the near term?
Back in 2008, the USD Index topped after it slightly exceeded the level that one would get by doubling the size of the initial sharp upswing. The first, initial top formed slightly above the level that one would get by multiplying the size of the initial sharp correction by 2.618.
Based on these techniques and the analogy to 2008, the USD Index is likely to soar to about 113 before correcting in a more meaningful manner. This level is just above the rising, long-term resistance line that's based on the 2009 and 2015 highs, which is at about 112, so conservatively we will view 112 as our upside target.
The USD Index is at about 100 at the moment of writing these words, so the upside potential is substantial.
And as we wrote in many previous extensive analyses, big moves higher in the USD Index almost always translate into big declines in gold. Consequently, given a high-quality prediction for the USD Index, one is quite likely to make a good gold price forecast as well.
The Big Picture View of the USD Index and Gold
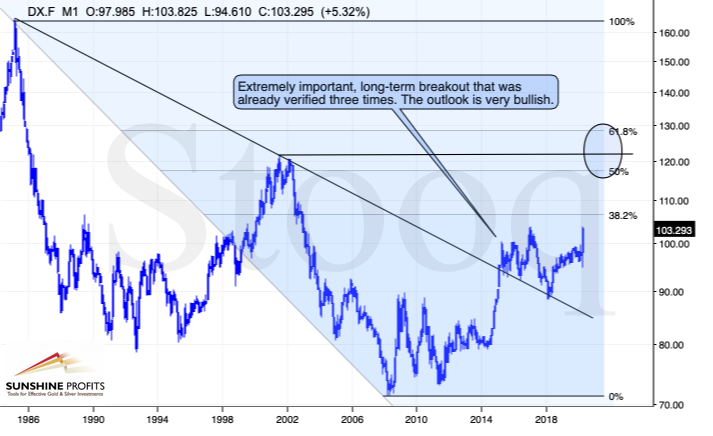
The 2014-2015 rally caused the USD Index to break above the declining very-long-term resistance line, which was verified as support three times. This is a textbook example of a breakout and we can't stress enough how important it is.
The most notable verification was the final one that we saw in 2018. Since the 2018 bottom, the USD Index is moving higher and the consolidation that it's been in for about a year now is just a pause after the very initial part of the likely massive rally that's coming.
If even the Fed and the U.S. President can't make the USD Index decline for long, just imagine how powerful the bulls really are here. The rally is likely to be huge and the short-term (here: several-month long) consolidation may already be over.
There are two cases on the above chart when the USD Index was just starting its massive rallies: in the early 1980s and in mid-90s. What happened in gold at that time?

These were the starting points of gold's most important declines of the past decades. The second example is much more in tune with the current situation as that's when gold was after years of prolonged consolidation. The early 1980s better compare to what happened after the 2011 top.
Please note that just as what we saw earlier this year, gold initially showed some strength - in February 1996 - by rallying a bit above the previous highs. The USD Index bottomed in April 1995, so there was almost a yearly delay in gold's reaction. But in the end, the USD - gold relationship worked as expected anyway.
The USD's most recent long-term bottom formed in February 2018 and gold seems to have topped right now. This time, it's a bit more than a year of delay, but it's unreasonable to expect just one situation to be repeated to the letter given different economic and geopolitical environments. The situations are not likely to be identical, but they are likely to be similar - and they indeed are.
What happened after the February 1995 top? Gold declined and kept on declining until reaching the final bottom. Only after this bottom was reached, a new powerful bull market started.
Please note that the pace at which gold declined initially after the top - in the first few months - was nothing to call home about. However, after the initial few months, gold's decline visibly accelerated.
Let's compare the sizes of the rallies in the USDX and declines in gold. In the early 80s, the USDX has almost doubled in value, while gold's value was divided by the factor of 3. In the mid-90s, the USDX rallied by about 50% from its lows, while gold's value was divided by almost 1.7. Gold magnified what happened in the USD Index in both cases, if we take into account the starting and ending points of the price moves.
However, one can't forget that the price moves in USD and in gold started at different times - especially in the mid-90s! The USDX bottomed sooner, which means that when gold was topping, the USDX was already after a part of its rally. Consequently, when gold actually declined, it declined based on only part of the slide in the USDX.
So, in order to estimate the real leverage, it would be more appropriate to calculate it in the following way:
- Gold's weekly close at the first week of February 1996: $417.70
- USDX's weekly close at the first week of February 1996: 86.97
- Gold's weekly close at the third week of July 1999: $254.50
- USDX's weekly close at the third week of July 1999: 103.88
The USD Index gained 19.44%
Gold lost 39.07% (which means that it would need to gain 64.13% to get back to the $417.70).
Depending on how one looks at it, gold actually multiplied USD's moves 2-3 times during the mid-90 decline.
And in the early 1980s?
- Gold's weekly close at the third week of January 1980: $845
- USDX's weekly close at the third week of January 1980: 85.45
- Gold's weekly close at the third week of June 1982: $308.50
- USDX's weekly close at the third week of June 1982: 119.01
The USD Index gained 39.27%
Gold lost 63.49% (which means that it would need to gain 173.91% to get back to $845).
Depending on how one looks at it, gold actually multiplied USD's moves by 1.6 - 4.4 times during the early-80 decline.
This means that just because one is not using U.S. dollars as their primary currency, it doesn't result in being safe from gold's declines that are accompanied by USD's big upswings.
In other words, the USD Index is likely to soar, but - during its decline - gold is likely to drop even more than the USD is going to rally, thus falling in terms of many currencies, not just the U.S. dollar.
Please note that there were wars, conflicts and tensions between 1980 and 2000. And the key rule still applied. Huge rallies in the USD Index mean huge declines in gold. If not immediately, then eventually.
Consequently, it seems most likely that while the USDX rallies, gold would first rally to or slightly above its 2020 highs (topping today or tomorrow), and decline in a volatile manner shortly thereafter.
For now, it seems most likely that we'll get the final bottom in gold close to the middle of the month or in its second half. Perhaps on Easter Monday, when trading is more difficult in many parts of the world (as the markets are closed there) - that's exactly when silver topped in 2011.
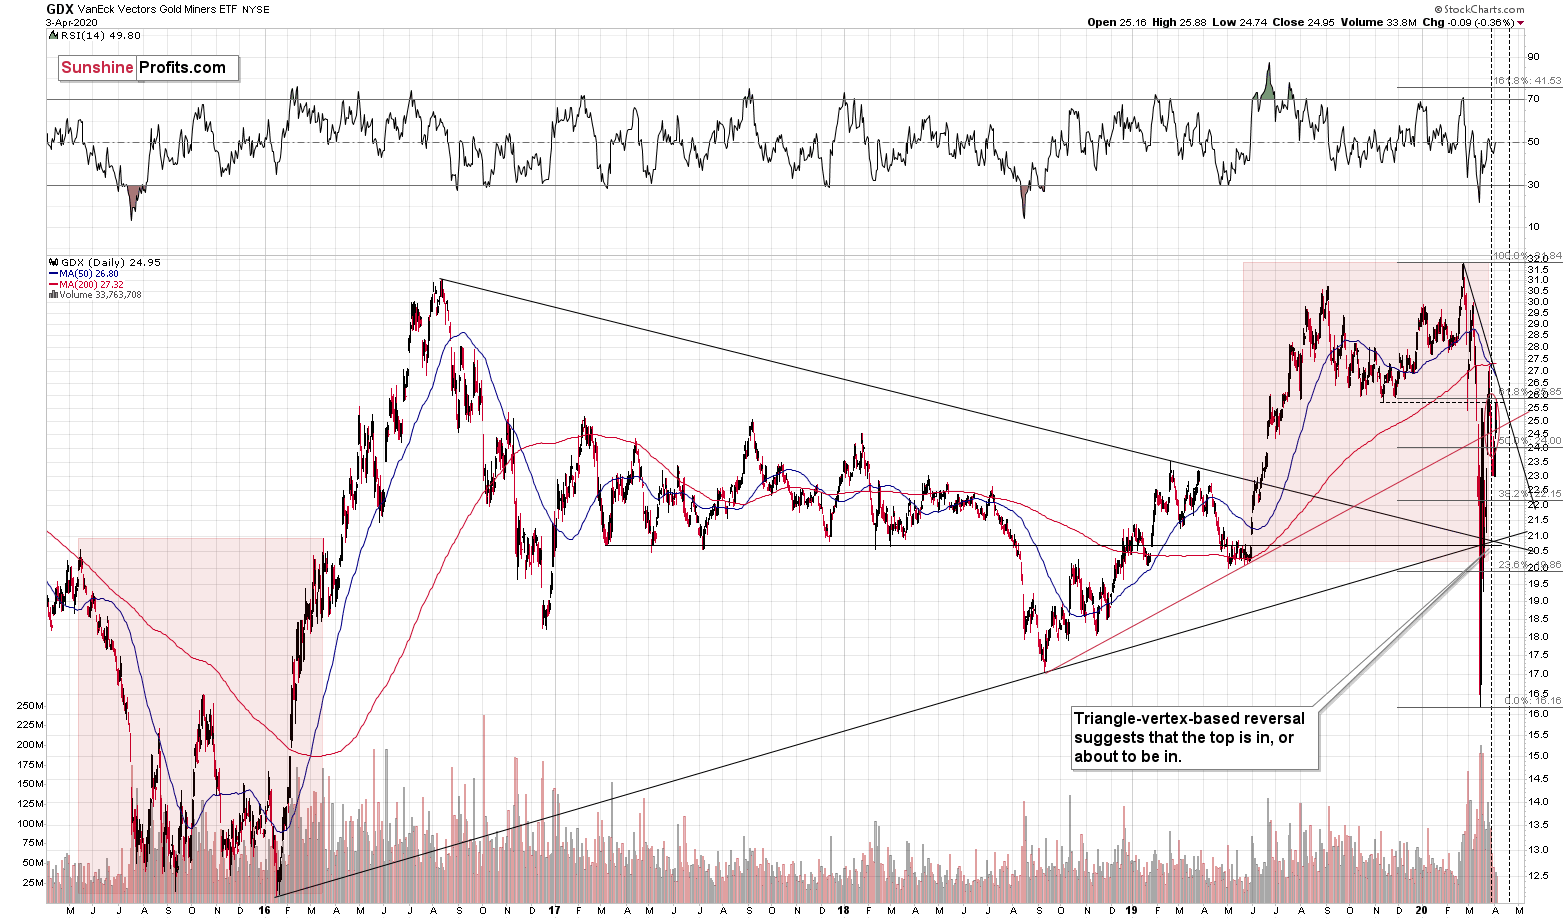
Also, let's keep in mind that we have a medium-term triangle-vertex-based reversal in the middle of the month in the GDX ETF.
What happened in other markets once gold rallied for the final time in 2008? Silver and mining stocks moved higher, but not as significantly as gold. Neither silver, nor mining stocks moved above their previous highs. The general stock market moved back and forth, mostly doing nothing, and the USD Index rallied.
What's happening right now in the stocks and the USD Index? The stocks are moving back and forth, while the USD Index is moving higher and it just rallied for two consecutive days.
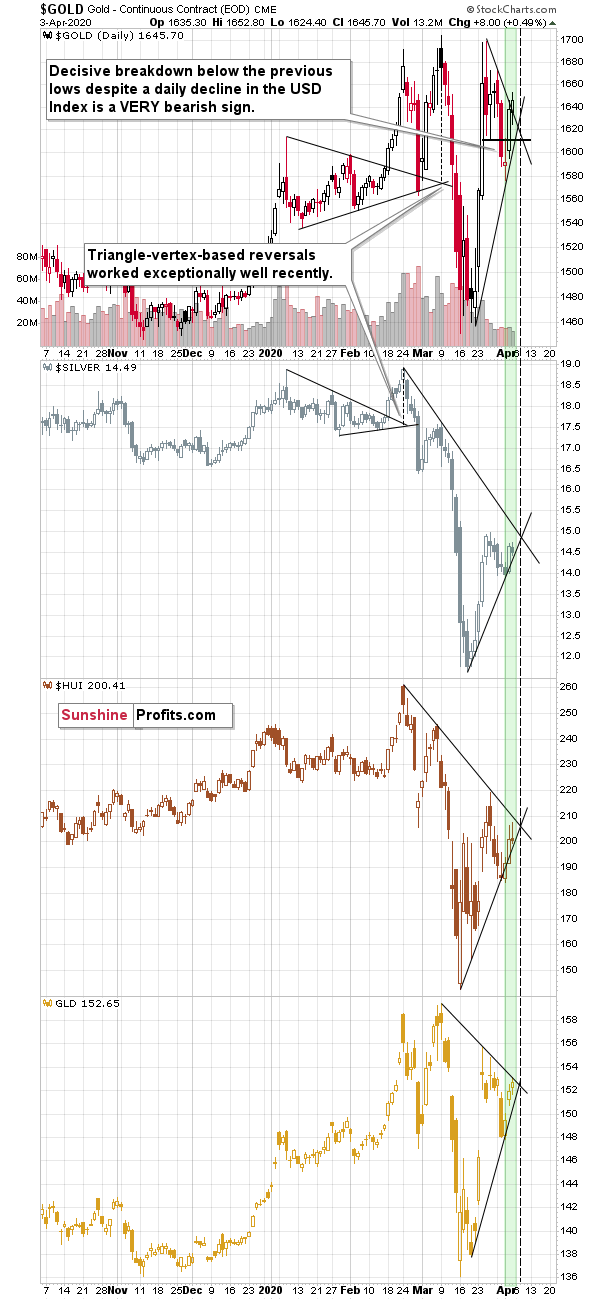
Silver moved higher, but not above its recent high, and miners corrected about half of their most recent downswing. It seems that the two periods in 2008 and 2020 (both marked with green) are indeed very similar.
Note: silver might exceed its recent high temporarily as the market might focus on the industrial demand due to the upcoming infrastructure projects. That's unlikely to be anything more than a temporary development.
As you can see, there are there are triangle-vertex-based reversals early this week in all key parts of the precious metals sector: in gold, in silver, and the mining stocks. We also get the same indication based on the GLD ETF.
This means that - based on this trading technique - it's very likely that we'll see some kind of reversal today or tomorrow. Based on the analogy to 2008, it's likely to be a local top, even despite the rally in the USD Index.
Thank you for reading today's free analysis. If you'd like to supplement the above with details regarding the details of our current trading positions (and the upcoming ones), we encourage you to subscribe to our Gold & Silver Trading Alerts. You might also be interested in our new service - weekly Gold Investment Updates, which we have recently introduced, and which we provide at promotional terms. Try them out today.
Thank you.
Sincerely,
Przemyslaw Radomski, CFA
Editor-in-chief, Gold & Silver Fund Manager -
Gold Investment Update - The Powerful 2008 Lessons That Apply to Gold Today
March 30, 2020, 11:57 AMMark Twain said that history does not repeat itself, but it rhymes. It's certainly true in both life and financial markets. Let's explore how the recent history lessons apply to the precious metals.
The 2008 - Now Link
Let's recount the similarities. We already had gold reversing on huge volume, and we saw it decline very strongly in the first week after the top. We already had another attempt to break above that high and we saw it fail. We also saw rhodium at about $10,000. We already saw silver and miners plunging much more severely than gold did. In fact, silver just plunged almost exactly as it did in 2008 during the analogous part of the slide.
All these factors make the current situation similar to how it was in 2008, at the beginning of one of the biggest declines in the precious metals sector of the past decades.
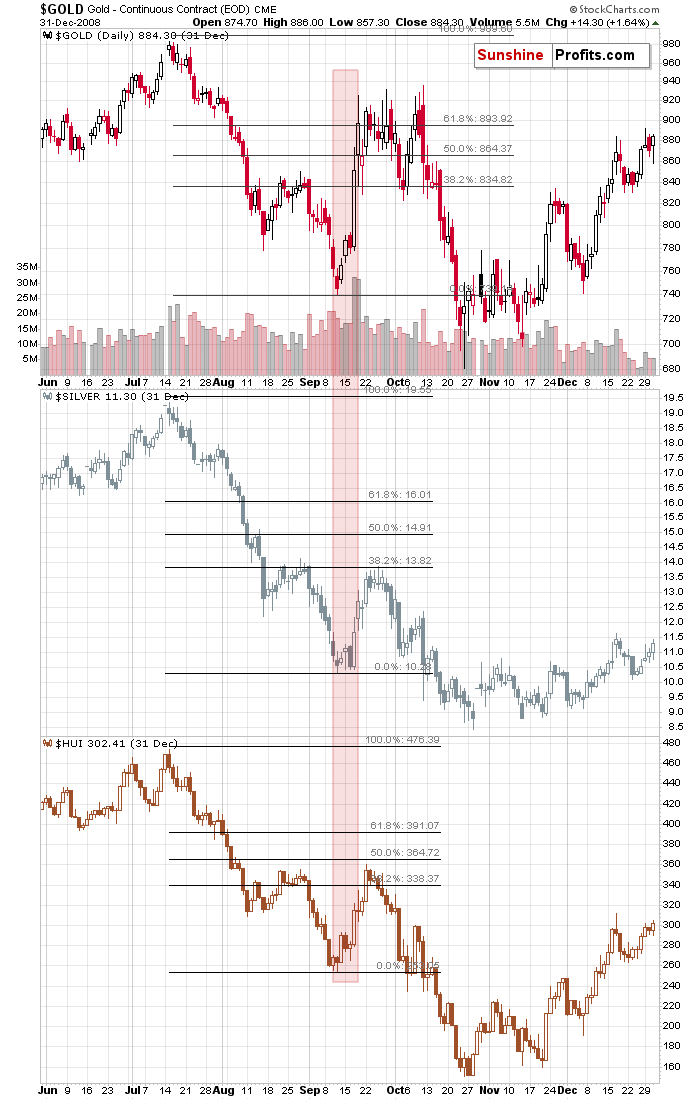
But the very specific confirmation came from the link between gold and the stock market. Stocks plunged along with gold, silver, and mining stocks. That's exactly what was taking place in 2008. The drop in 2008 was very sharp, and silver and miners were hit particularly hard. We expect this to be the case this time as well.
In 2008, the temporary rallies were particularly visible in case of gold, not that much in case of silver, mining stocks, or the general stock market. Gold declined particularly hard only after the USD Index started its powerful rally.
The 2008 decline in the PMs ended only after a substantial (about 20%) rally in the USD Index.
The USDX has just corrected almost 61.8% of its previous decline, and it could be the case that it's now ready to soar much higher. Last week, we wrote that the USD Index could correct based on the 2T stimulus and other monetary, and fiscal steps taken by the US officials.
That's exactly what happened. Yet, it's not likely that these steps will prevent people from raising cash when their fear reaches extreme levels. We're getting there. And we're getting there fast.
As the situation is more severe, the USD Index might rally even more than 20%, and the 120 level in the USD Index (comeback to the 2001 high) has become a quite likely scenario.
Let's keep in mind that it was not only the 2008 drop that was sharp - it was also the case with the post-bottom rebound, so if there ever was a time, when one needed to stay alert and updated on how things are developing in the precious metals market - it's right now.
Last week we supplemented the above with description of the 2008 analogy in terms of the shape of the price moves. On Wednesday, we supplemented it with a more detailed time analysis. It's very important today (and for the rest of the week), so we're quoting our Wednesday's comments:
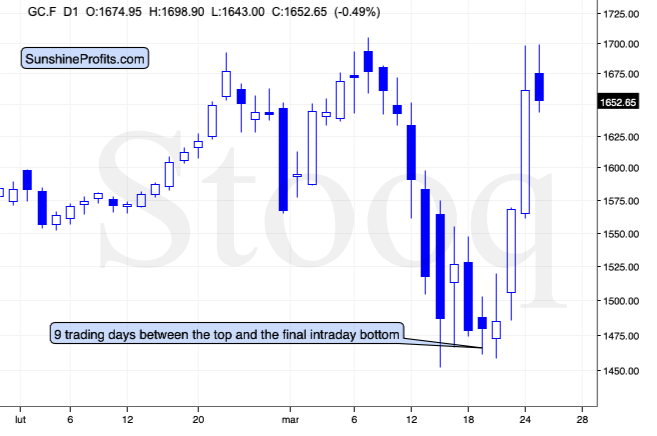
It took 9 trading days for gold to decline from its top to the final intraday bottom, before starting the powerful comeback.
In 2008, it took 41 days. It seems that things are developing about 4.5 times faster now, than they were developing in 2008. More precisely: 41/9 = 4.56 times.
Please note that the decline that preceded the sharp upswing in gold, is also somewhat similar to what we saw recently. There was an initial slide in gold that ended in mid-August 2008, then we saw a correction and then another slide and a bottom in early September. This year, we saw an initial bottom in mid-March, and the final one a few days ago.
Back in 2008, it took 23 trading days for gold to reach its initial bottom and it then took another 18 days for the final short-term bottom to form. 56.1% of the downswing was to the initial bottom, and the 43.9% of the downswing was between the initial and final bottom.
And now? It took 5 out of 9 trading days for gold to reach the initial bottom, and the remaining 4 days were the time between the bottoms. That's 55.6% and 44.4% respectively.
This is very important, because it shows that the shape of the move is indeed very similar now.
This means that we can most likely draw meaningful conclusions for the current situation based on how the situation developed back in 2008.
Back then, gold moved back and forth close to the initial top. That's what gold has been doing so far today - which serves as another confirmation for the analogy.
Back in 2008, gold topped over the period of 16 trading days. Dividing this by 4.56 provides us with 3.5 days as the target for the end of the topping pattern since its start. The pattern started yesterday, which suggests that gold could top tomorrow [Thursday, March 26th] or on Friday.
EDIT: That's exactly what happened - in terms of the daily closing prices, gold has indeed topped on Thursday.
The situation gets more interesting as we dig in more thoroughly...
There are 24 hours in a day. Dividing this by the factor of 4.56 provides us with 5.26. This means that if we could create a chart with 5.26 hour candlesticks, the price moves in gold should be analogous (in terms of how we see them on the chart) to their daily performance from 2008. The closest that we have available are the 4-hour candlesticks.
Let's check how gold performed recently from this perspective, and compare it to its daily performance from 2008.
The price moves are remarkably similar.
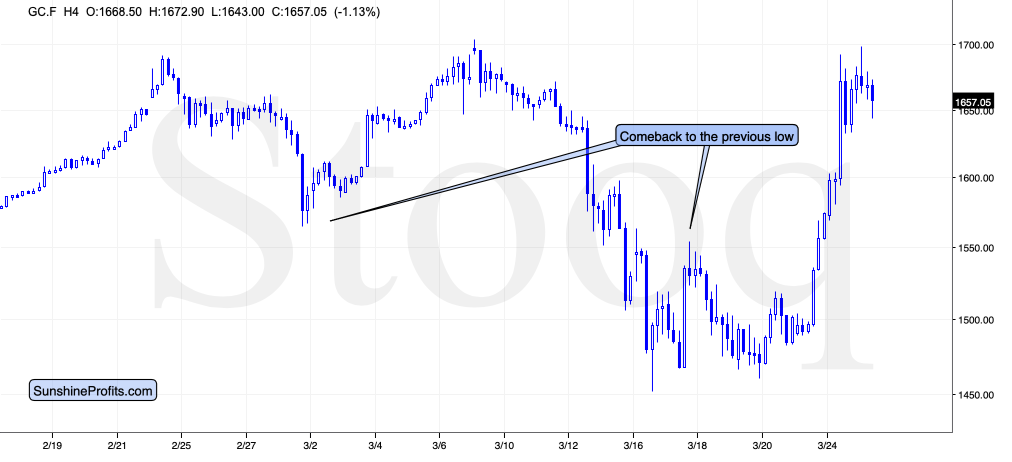
Even the March 17, 2020 upswing took gold to analogous price level! Gold temporarily topped very close to the previous (Feb 28) low. That's in perfect analogy to how high gold corrected in late August 2008 - it moved up to the early May 2008 high.
The link to 2008 truly is the key right now.
Ok, so when are silver and miners likely to top?
Sooner than gold.
Please note that both: silver and mining stocks topped more or less in the middle of gold's topping formation... Which suggests that they should be topping today.
And for the final confirmation - please take a look at what the stock market and the USD Index have been doing at that time. The USD Index was within a pullback while the stock market formed a very short-term upswing. Silver and miners topped along with the stock market.
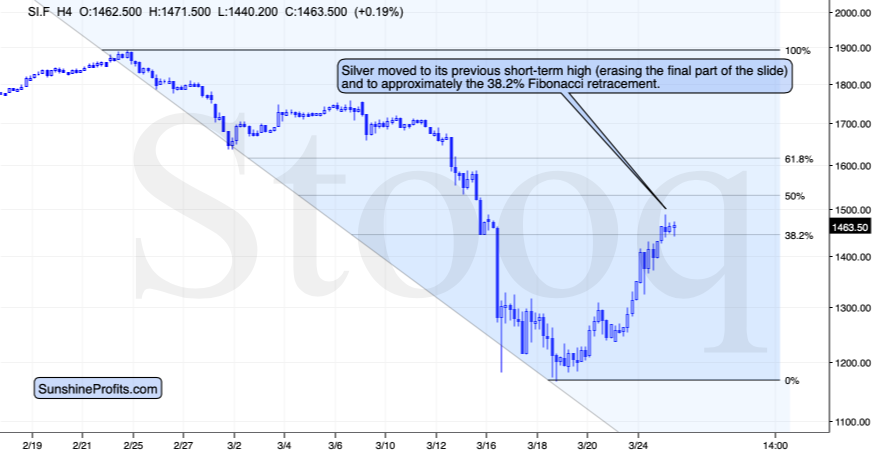
Silver just moved to its previous short-term high (a small high, but the one that preceded the final part of the decline) and it's approximately at its 38.2% Fibonacci retracement.
That's exactly where silver topped in 2008. Back then the analogous high was the late-August high, and it also topped close to its 38.2% Fibonacci retracement.
We are probably looking at a top in silver right now.
This means that miners are likely to top today as well.
EDIT: That's exactly what happened in terms of the daily closing prices. Both: silver and GDX formed the highest daily closing prices on Wednesday - the same day we had published the above.
Please keep in mind that after the 2008 bottom in stocks, it took only two days before they formed an intraday top. Given that this time, the price moves are more volatile, it seems that we could (far from certain) see a powerful reversal (top) as early as tomorrow. This estimate is in perfect tune with the triangle-vertex-based reversal that we see on the GDX and GDXJ charts.
EDIT: Again, that's exactly what happened. The GDX index formed the intraday high on Thursday, one day after we wrote the above. The GDXJ formed the intraday high on Wednesday.
How much clearer could it get that the precious metals market is re-creating its 2008 slide?
Ok, so what does it tell us going forward?
It tells us that the precious metals market is likely going to slide very profoundly, and very quickly. And it might happen as early as this, or the next week.
Thank you for reading today's free analysis. If you'd like to supplement the above with details regarding the details of our current trading positions (and the upcoming ones), we encourage you to subscribe to our Gold & Silver Trading Alerts. You might also be interested in our new service - weekly Gold Investment Updates, which we have recently introduced, and which we provide at promotional terms. Try them out today.
Thank you.
Sincerely,
Przemyslaw Radomski, CFA
Editor-in-chief, Gold & Silver Fund Manager -
Gold Investment Update: Comprehensive Analysis of Precious Metals for Very Volatile Times
March 23, 2020, 11:36 AMTraders consult higher timeframes so as to get a big picture view that filters out some short-term noise. So, what story does the monthly gold chart tell?
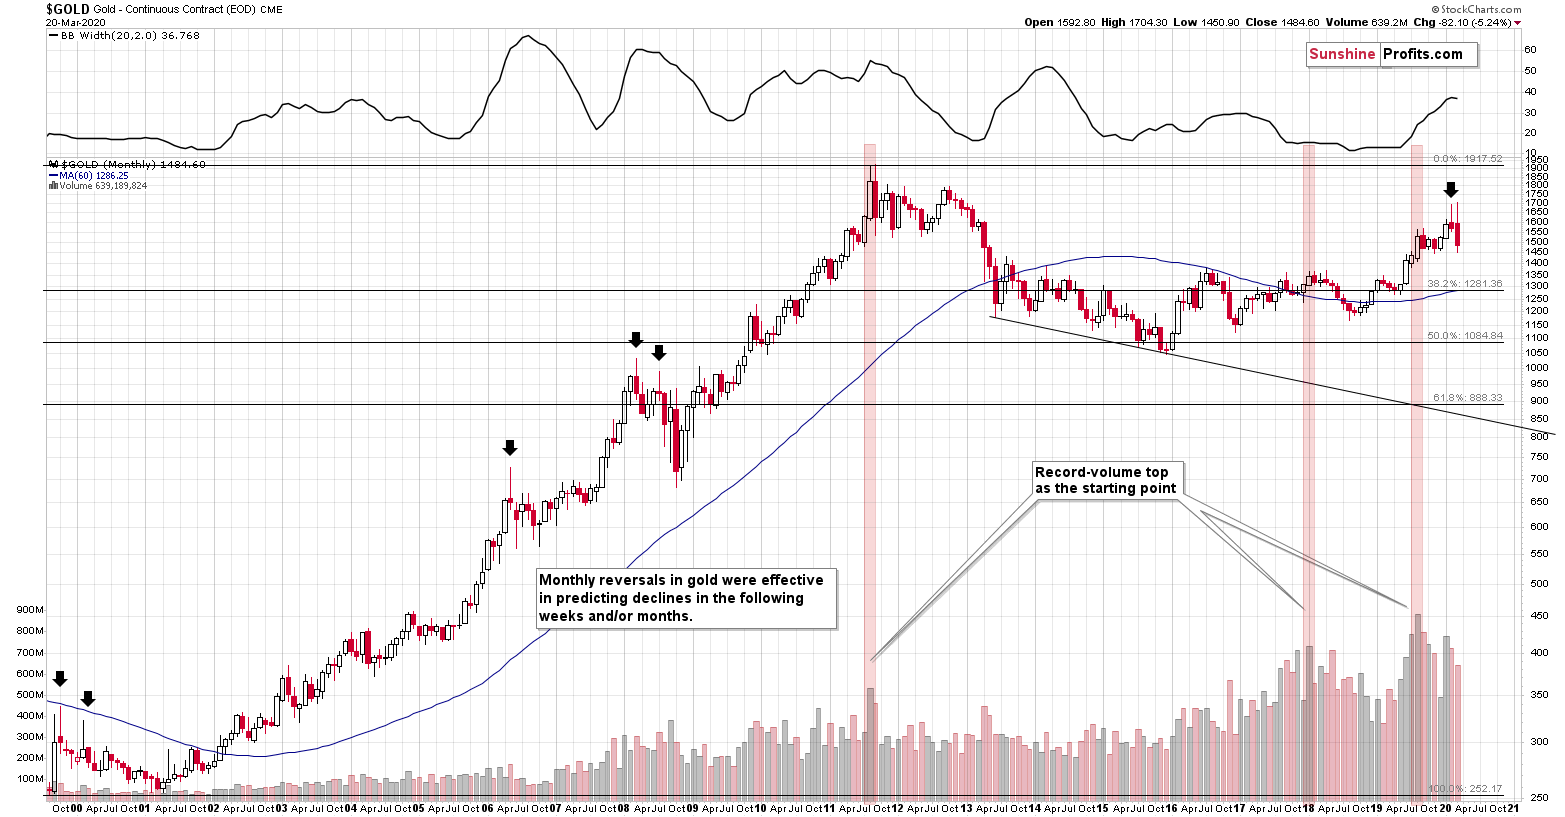
Gold reversed in February, creating a crystal-clear shooting star candlestick. The monthly volume was big, meaning that this candlestick formation is valid. The shooting star is a bearish sign for the following weeks and/or months, especially that in 5 out of 5 previous times that we saw it, such moves lower followed.
The most interesting thing is that two of those five cases formed in 2008, which is yet another link between 2008 and 2020. One of the biggest and sharpest declines in the precious metals sector started with the formation that we just saw. The implications are very bearish - it seems that gold has already formed its final reversal for this medium-term rally.
Please note that March is far from being over, but it seems relatively clear that the top in gold is already in. So far, gold is repeating its February reversal, which has bearish implications for the following weeks and months.
And speaking of major gold moves, please note how perfectly the long-term triangle-vertex-based reversals in gold worked.
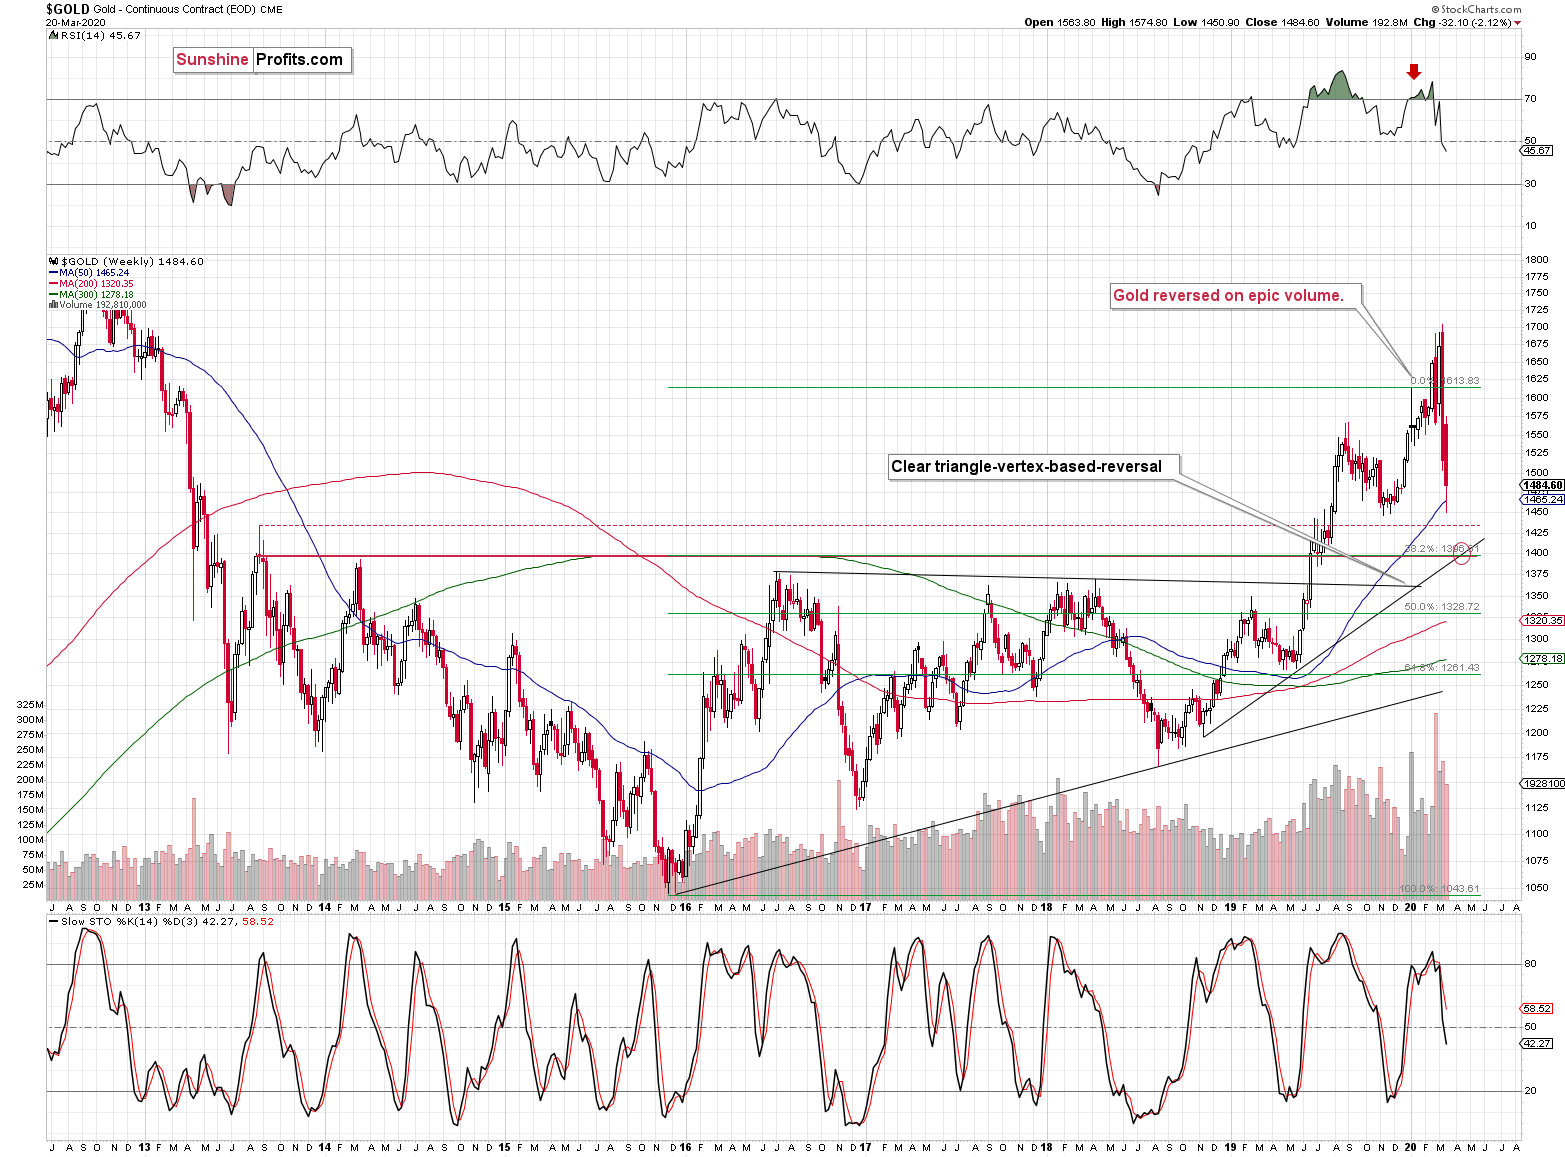
Gold was very likely to reverse, and it did exactly that, just like we had written earlier.
Reversals should be confirmed by big volume, and the volume, on which gold reversed was truly epic, and that's a perfectly bearish confirmation. It was the biggest weekly gold volume EVER.
Well, until two weeks ago, when the record was broken. Gold once again reversed on record-breaking volume. This makes the previous signal even stronger.
We already wrote a lot today about gold and we will write even more, also about silver and miners. We will cover multiple signs that point to lower precious metals prices in the following weeks and months (not days, though). But, the record-breaking-volume reversals are alone enough to make the outlook bearish. That's how significant this reversal-volume combination is.
In addition to the above, the above chart shows the next medium-term target for gold - at about $1,400 level. This target is based on the mid-2013 high in weekly closing prices, the 38.2% Fibonacci retracement based on the 2015 - 2019 upswing, and the rising medium-term support line. Of course, that's just the initial target, gold is likely to decline more after pausing close to $1,400.
The above chart also featured a triangle-vertex-based reversal in early April - about a month from now. It could be the case that gold declines to $1,400 at that time.
Last Monday, we wrote the following:
Still, based on today's pre-market move to $1,451 along with Fed's actions, it seems that we might get a local rebound also early this week. The above price level corresponds to the late-2019 lows, which served as support.
Indeed, we got a local rebound early last week and the abovementioned price of $1,451 was the bottom from which this rebound started. Still, it seems that this rebound is not yet over, as the USD Index has not corrected just yet.
Before moving further, we would like to show you how well the triangle-vertex-based reversal gold trading technique worked recently. We're going to apply it later today
Gold reversed at the beginning of the year (top), then it reversed at the next reversal point (local bottom) and now it seems to have finally topped at the final triangle-vertex-based reversal point.
The final top in intraday terms was incredibly precisely indicated by the triangle vertex reversal point.
The recent top just several dollars above the previous 2020 high is quite in tune with the way the previous major tops formed.
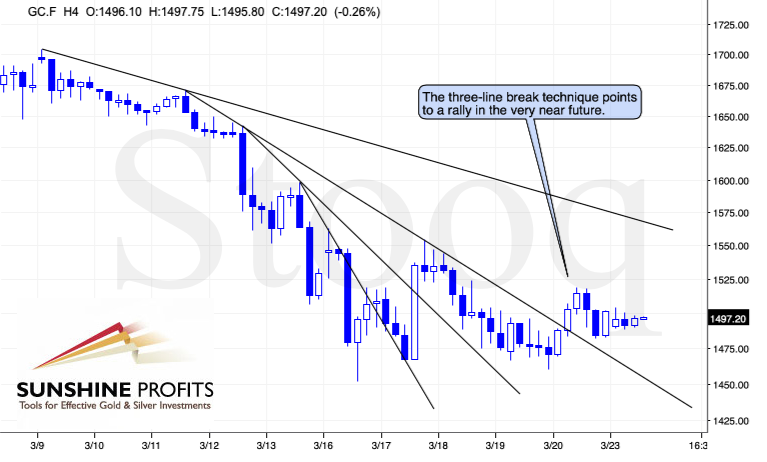
On a short-term basis, we see that gold broke above the third declining resistance line and verified this breakdown by temporarily moving back down and then up again. The "three line break" is one of the technical tools that help to pinpoint the breakouts, and it currently predicts higher gold prices in the near term.
Thank you for reading today's free analysis. If you'd like to supplement the above with details regarding the details of our current trading positions (and the upcoming ones), we encourage you to subscribe to our Gold & Silver Trading Alerts. You might also be interested in our new service - weekly Gold Investment Updates, which we have recently introduced, and which we provide at promotional terms. Try them out today.
Thank you.
Sincerely,
Przemyslaw Radomski, CFA
Editor-in-chief, Gold & Silver Fund Manager
Gold Alerts
More-
Status
New 2024 Lows in Miners, New Highs in The USD Index
January 17, 2024, 12:19 PM -
Status
Soaring USD is SO Unsurprising – And SO Full of Implications
January 16, 2024, 8:40 AM -
Status
Rare Opportunity in Rare Earth Minerals?
January 15, 2024, 2:06 PM
Dear Sunshine Profits,


