

-
Gold Investment Update - Focusing on Gold's Strength Against the Ongoing USDX Rally
October 5, 2020, 4:04 PMOn Friday, we commented on the above gold chart in the following manner:
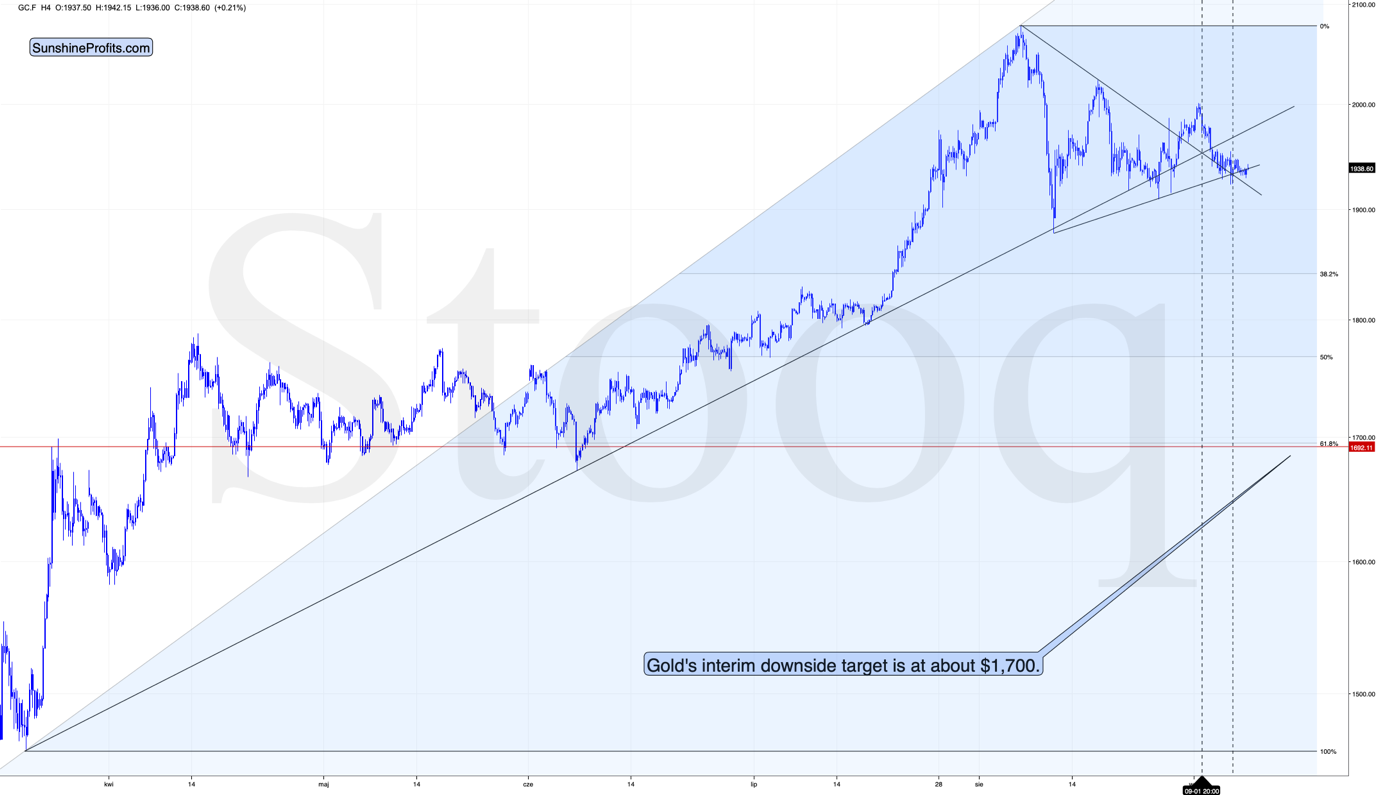
The short-term triangle-vertex-based reversals were quite useful in timing the final moments of the given short-term moves in the past few weeks. Please keep in mind that the early and late September lows developed when the support and resistance lines were crossed.
We can see the same thing happening once more. Based on the recent highs and lows, yesterday, the support and resistance lines both crossed again. And indeed, gold is trading below yesterday's closing price in today's pre-market trading.
Now, this technique might not work on a precise basis, but rather on a near-to basis, and given the highly political character of the current month (before the U.S. presidential elections), things might move in a somewhat chaotic manner... But still, this technique worked multiple times in the previous months and years, and it has worked recently as well. It seems quite likely that the days of this corrective upswing are numbered.
Indeed, gold moved lower in this week's pre-market trading. Therefore, what we've analyzed above remains valid, and the outlook continues to be bearish for the next several weeks - next few months.
Based on the chart above, the likely downside target for gold is at about $1,700, predicated on the previous lows and the 61.8% Fibonacci retracement, based on the recent 2020 rally.
As far as the white metal is concerned, previously, we've indicated the following:
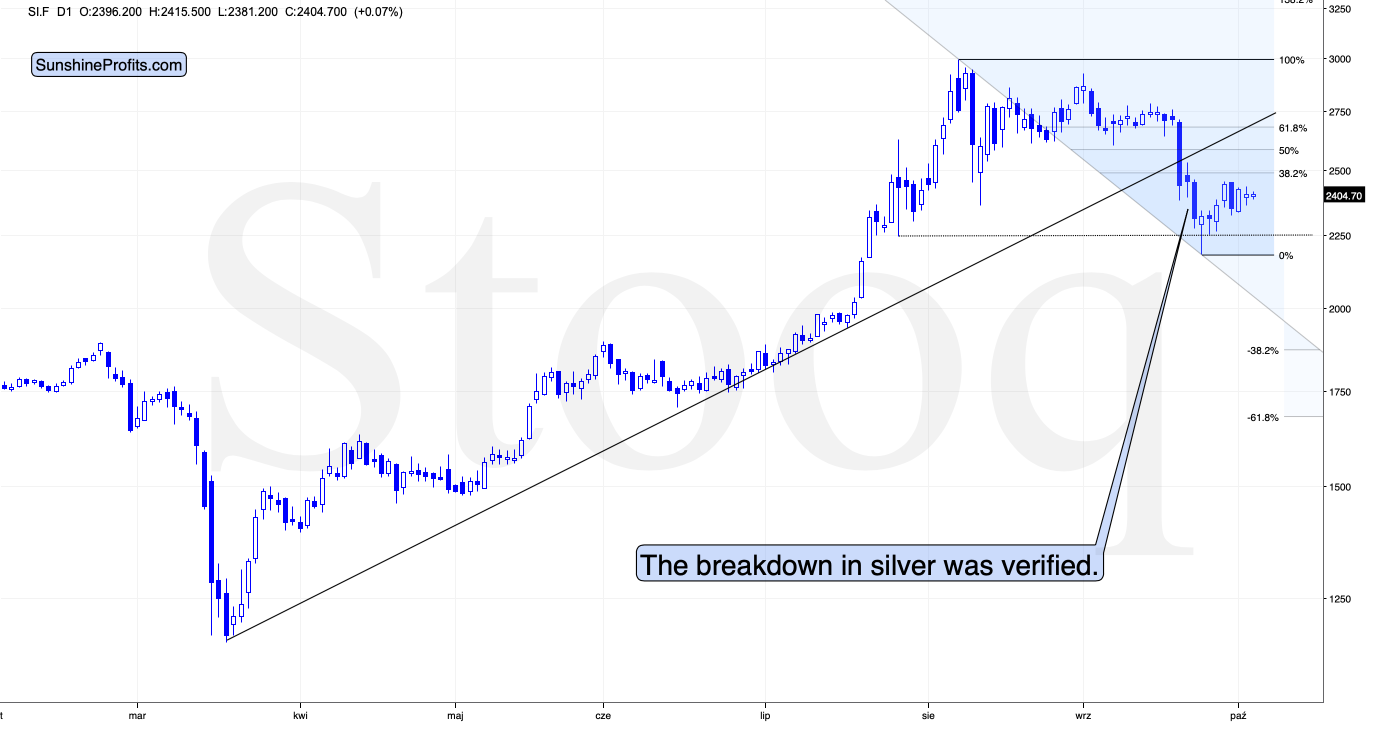
Silver is also after a major breakdown and it just moved slightly below the recent intraday lows, which could serve as short-term support. This support is not significant enough to trigger any major rally, but it could be enough to trigger a dead-cat bounce, especially if gold does the same thing.
Once again, that's exactly what happened.
At this point one might ask how do we know if that really just a dead-cat bounce, and not a beginning of a new strong upleg in the precious metals sector. The reply would be that while nobody can say anything for sure in any market, the dead-cat-bounce scenario is very likely because of multiple factors, and the clearest of them are the confirmed breakdowns in gold and silver, and - most importantly - the confirmed breakout in the USD Index. The invalidation of the breakout above the previous 2020 highs in case of the general stock market is also a bearish factor, especially for mining stocks (and silver).
-
Gold Investment Update - USDX's Strength And Fed's Stimulus Uncertainty Trigger Pause
September 28, 2020, 1:53 PMAvailable to premium subscribers only.
-
Gold Investment Update -What's Behind the USDX Breakout?
September 21, 2020, 1:53 PMWelcome to this week's Gold Investment Update. So far, 2020 has been an incredible and challenging year for the many markets, and that does not exclude gold, arguably one of the most important and most valuable commodities in the world.
The yellow metal's price is influenced by a myriad of obvious and non-obvious short and long-term factors, such as the long-term turning point and its self-similar pattern. In recent months, we've already discussed the presence of gold's long-term turning point in broad detail. Furthermore, only a couple of weeks ago, we've learned about the powerful self-similarity pattern in gold, making sense of similarly shaped patterns in the marketplace over different periods.
In today's update, we'll discuss both, starting with the former. Let's take a look at gold's long-term chart.
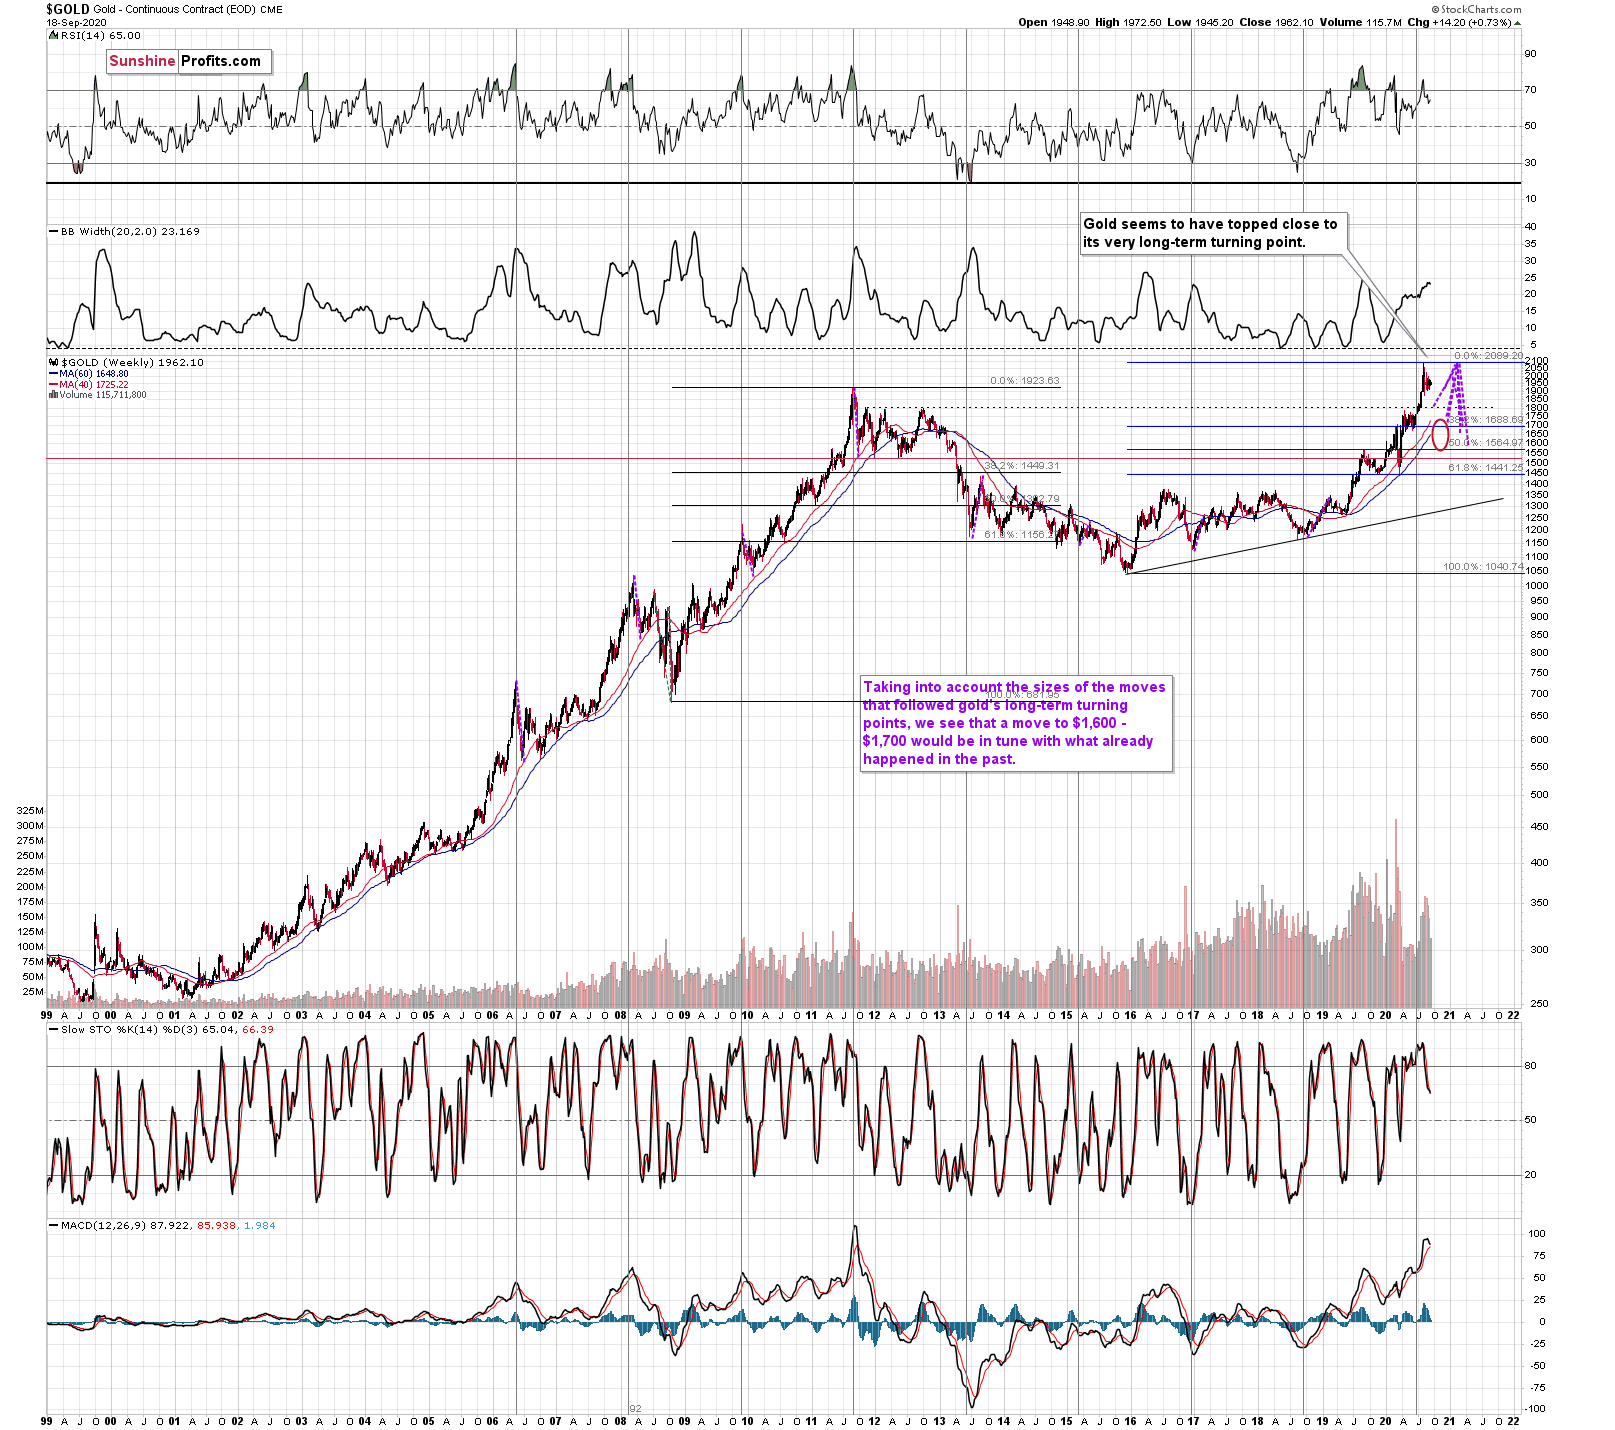
We used the purple lines to mark the previous price moves that followed gold's long-term turning points, and we copied them to the current situation. We copied both the rallies and declines, which is why it seems that some moves would suggest that gold moves back in time - the point is to show how important the turning point is in general.
The big change here is that due to gold's big rally, we moved our downside target for it higher. Based on the information that we have available right now, it seems likely that gold will bottom close to the $1,700 level. That's very much in tune with how much gold moved after the previous long-term turning points.
Having said that, let's take a look at gold's short-term chart.
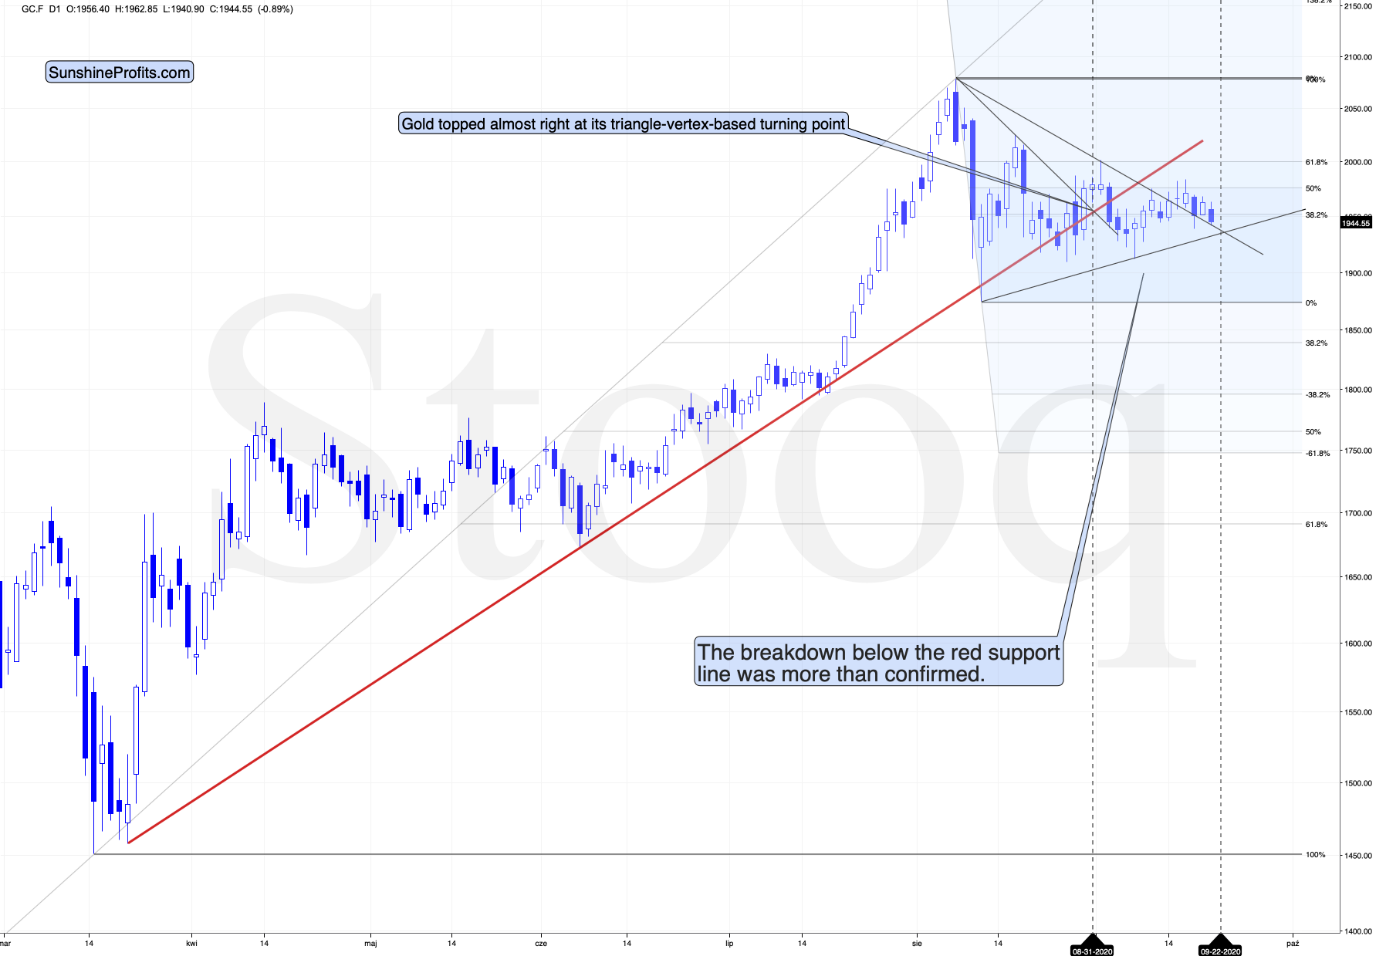
Gold is already after the breakdown below the rising red support line, which makes the short-term outlook bearish, especially that this breakdown was confirmed.
And what about the likely target? Please note that the if gold declines to the 61.8% Fibonacci retracement based on the most recent rally, it would also decline - approximately - to the April - June lows... Making this support very strong. And - guess what - this price target is in tune with what we already wrote above based on the long-term turning point's consequences.
Moreover, that's not the most important thing about the above chart. The most important thing about this chart starts with the reply to one important question:
Do you get the feeling that you have already seen gold perform this way before?
Because you did.
The history rhymes, but this time, the similarity is quite shocking.
We copied the short-term chart and pasted it on the long-term chart above and next to the 2011 top. We pasted it twice, so that you can easily compare gold's performance in both cases in terms of both: price and time.
They are very similar to say the least. Yes, these patterns happened over different periods, but this doesn't matter. Markets are self-similar, which is why you can see similar short-term trends and long-term trends (with regard to their shapes). Consequently, comparing patterns of similar shape makes sense even if they form over different timeframes.
After a sharp rally, gold declined quickly. Then we saw a rebound, and a move back to the previous low. Then, after a bit longer time, gold moved close to the most recent high and started its final decline. This decline was less volatile than the initial slide. That's what happened when gold topped in 2011 (and in the following years), and that's what happened also this year. Ok, after the initial decline from the 2011 top, we saw two initial reactive rallies and in 2020 there was just one, but it didn't change the similarity with regard to time.
The patterns of this level of similarity are rare, and when they do finally take place, they tend to be remarkably precise with regard to the follow-up action.
What is likely to follow based on this pattern, is that we're likely to see the end of the slower decline, which will be followed by a big and sharp decline - similarly to what we saw in 2013.
How low could gold slide based on this similarity? Back in 2013, gold declined approximately to the 61.8% Fibonacci retracement based on the preceding rally (the one that started in 2008), so that's the natural target also this time.
And we already wrote about this particular retracement - it's approximately at the $1,700 level. This has been our downside target for weeks, and it was just confirmed by this precise self-similar technique.
Another interesting point is that gold made an interim low close to the 50% retracement and the previous lows. Applying this to the current situation suggests that we could see a smaller rebound when gold moves to about $1,760 - $1,800.
The interim downside target has very important trading implications. Even though gold's rebound might just be temporal, something much more profound is likely to take place in case of mining stocks and silver. You will find more details in today's flagship Gold & Silver Trading Alert. Subscribe now and read today's issue right away.
Sincerely,
Przemyslaw Radomski, CFA
Editor-in-chief, Gold & Silver Fund Manager -
Gold Investment Update - What Does the Valuable Gold Miners Indicator Say Now?
September 14, 2020, 8:57 AMSome swear by price action, many others rely on indicators. There are actually many gold trading tips built around these techniques. Gold Miners Bullish Percent Index, is one of the rare ones that don't issue signals all that often. And it showed the highest possible overbought reading recently.
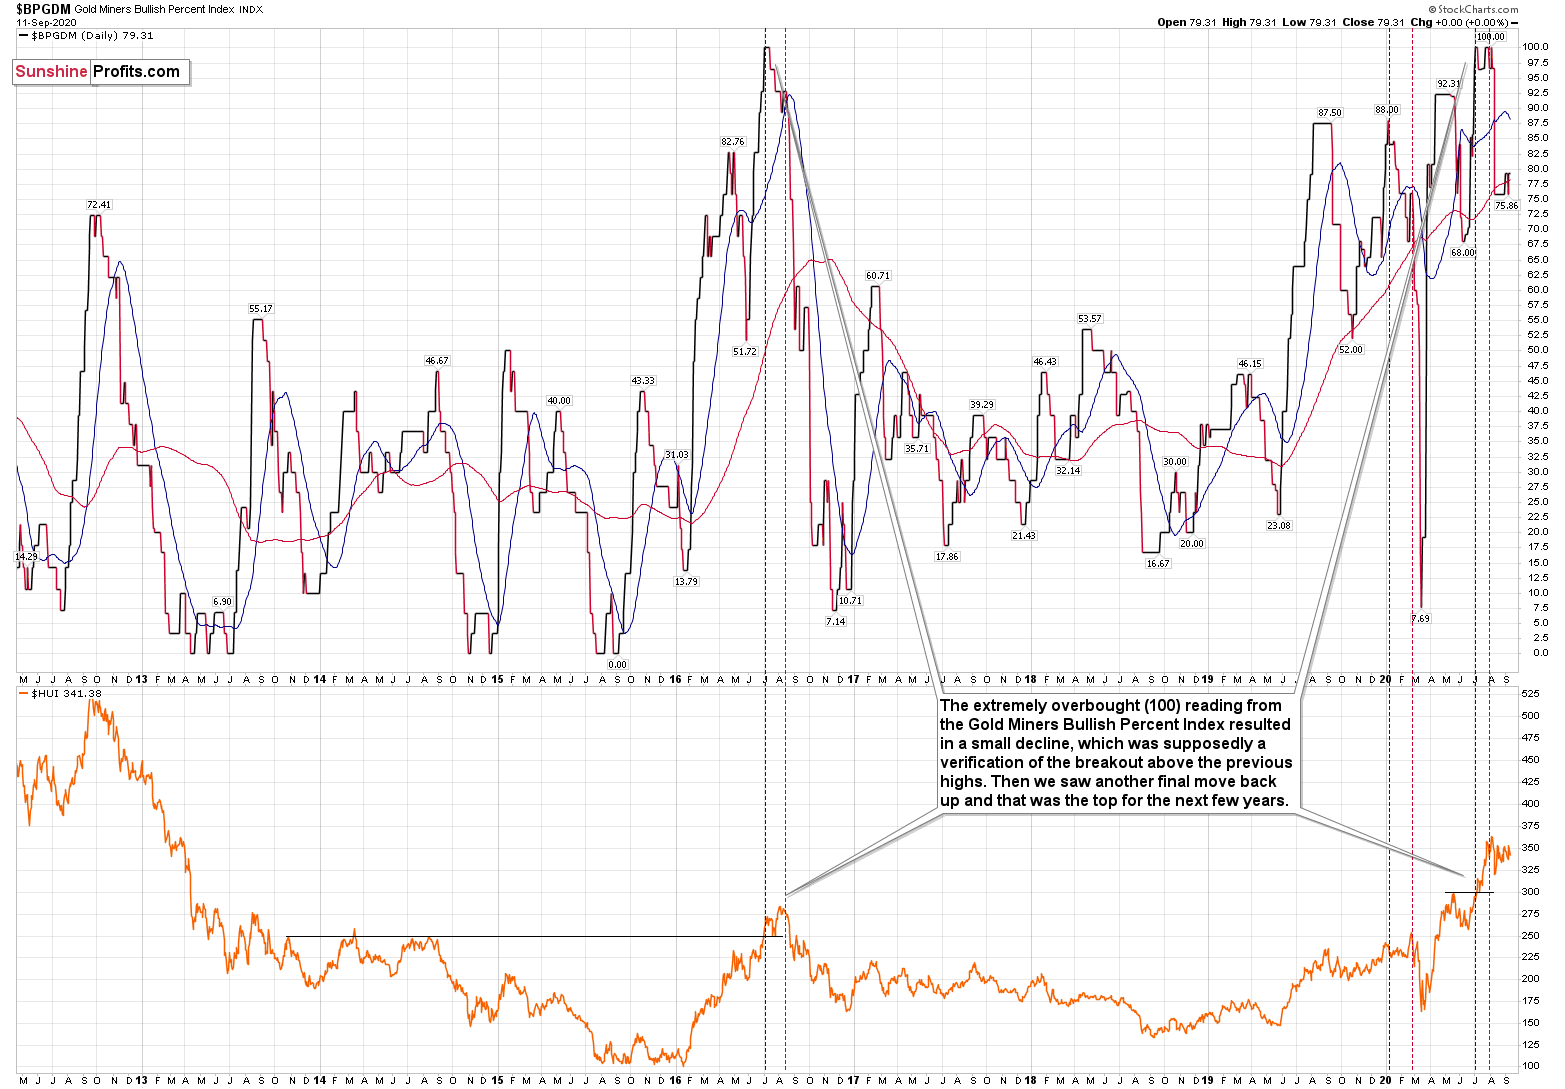
The excessive bullishness was present at the 2016 top as well and it didn't cause the situation to be any less bearish in reality. All markets periodically get ahead of themselves regardless of how bullish the long-term outlook really is. Then, they correct. If the upswing was significant, the correction is also quite often significant.
Please note that back in 2016, there was an additional quick upswing before the slide and this additional upswing has caused the Gold Miners Bullish Percent Index to move up once again for a few days. It then declined once again. We saw something similar also this time. In this case, this move up took the index once again to the 100 level, while in 2016 this wasn't the case. But still, the similarity remains present.
Back in 2016, when we saw this phenomenon, it was already after the top, and right before the big decline. Given the situation in the USD Index, it seems that we're seeing the same thing also this time.
Please note that back in 2016, after the top, the buying opportunity didn't present itself until the Gold Miners Bullish Percent Index was below 10. It's currently above 70, so it seems that miners have a long way to go before they bottom.
Three weeks ago, we commented on the above chart in the following way:
Now, since the general stock market moved above the previous highs and continues to rally, we might or might not see a sizable decline early this week. Back in March, the slide in miners corresponded to the decline in the general stock market, and this could be repeated, or we could see some sideways trading after the slide resumes, once stocks finally decline.
That's exactly what happened. The general stock market continued to move higher, and mining stocks have been trading sideways instead of declining - or rallying. Before miners' pause (and S&P's breakout) miners were repeating their late-February and early-March performance. The implications of the self-similar pattern were bearish, and they continue to be bearish, only the timing changed.
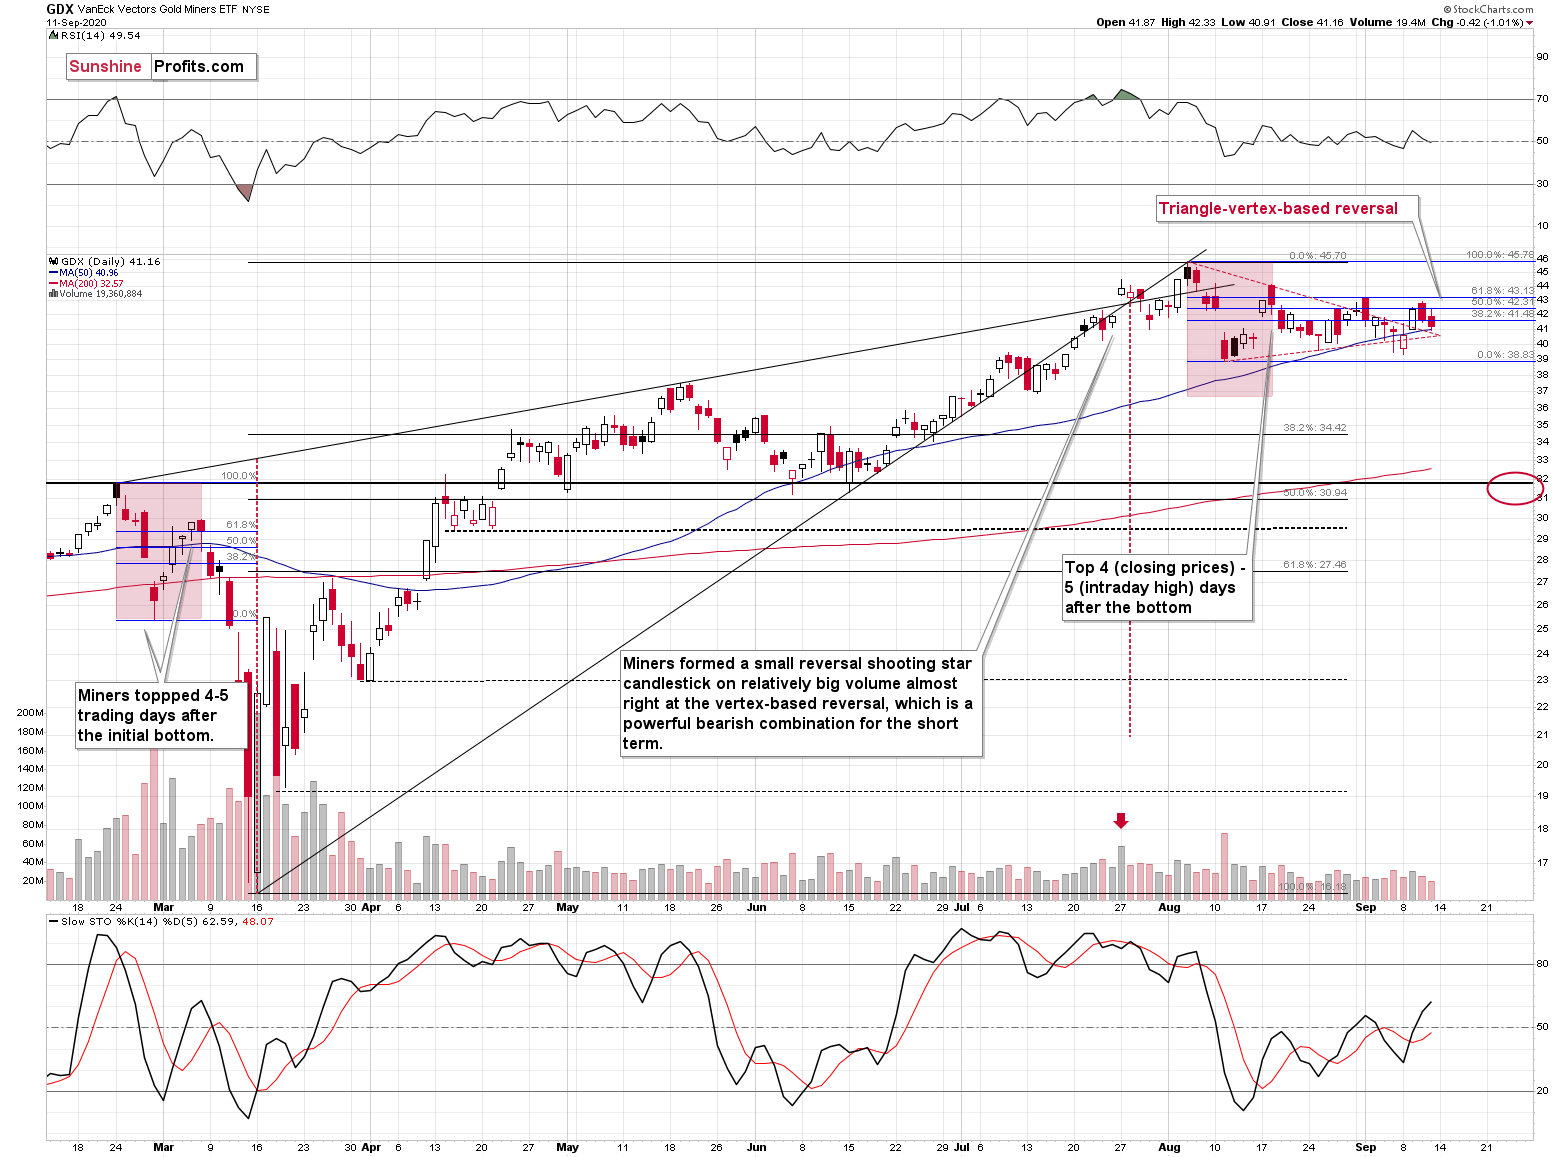
The GDX ETF didn't manage to break below the lower border of the triangle pattern yet, but given the situation in the USD Index and what we're about to show in you case of gold, it's likely that it will move lower shortly.
Based on the triangle (marked with red, dashed lines), we get a vertex. This means that it wouldn't be surprising to see an intraday rally that is followed by a decline later today or tomorrow.
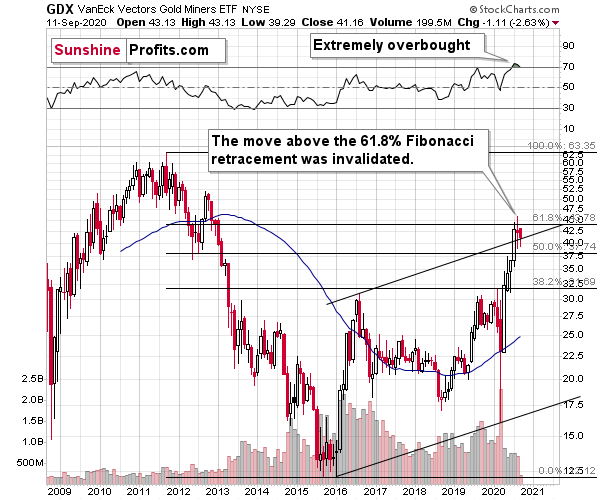
Also, let's not forget that the GDX ETF has recently invalidated the breakout above the 61.8% Fibonacci retracement based on the 2011 - 2016 decline.
When GDX approached its 38.2% Fibonacci retracement, it declined sharply - it was right after the 2016 top. Are we seeing the 2020 top right now? This is quite possible - PMs are likely to decline after the sharp upswing, and since there are only several months left before the year ends, it might be the case that they move north of the recent highs only in 2021.
Either way, miners' inability to move above the 61.8% Fibonacci retracement level and their invalidation of the tiny breakout is a bearish sign.
Everyone and their brother appear to be bullish on the precious metals sector right now, but if everyone is on the same side of the trade, it's usually a good idea to be on the other side. There are quite a few factors pointing to lower precious metals prices on the horizon, and the situation in the mining stocks is one of them.
Thank you for reading today's free analysis. Please note that it's just a small fraction of today's full Gold & Silver Trading Alert. The latter includes multiple details such as the interim target for gold that could be reached in the next few weeks (or even later this week). You will find details in today's flagship Gold & Silver Trading Alert. We invite you to subscribe and read today's issue right away.
Sincerely,
Przemyslaw Radomski, CFA
Editor-in-chief, Gold & Silver Fund Manager -
Gold Investment Update - Powerful Self-Similarity Lesson from Gold
September 8, 2020, 8:56 AMA picture is worth a thousand words, so let's get straight to the gold chart itself.
As far as gold is concerned, we previously wrote the following:
After topping at its triangle-vertex-based reversal, gold declined and is now trading at its declining resistance line, which turned into support. This could generate a rebound, especially that at the same time gold finally broke below the rising medium-term support line. This breakdown is a big deal, as all previous attempts were invalidated.
Since this support is so strong, we expect a rebound, quite possibly back to it. Such a verification (if gold doesn't invalidate the breakdown that is) would be very bearish for the short term.
Gold paused after moving below the above-mentioned support line, and the breakdown was verified. This is very bearish for the short term.
Gold moved back and forth at the most recent triangle-vertex-based reversal, which is a bearish sign. Why would this be the case? Because gold had declined previously, which means that it "should have" rallied at the most recent turning point. It didn't, which shows short-term weakness.
The next support is at $1,700, which is where - approximately - gold topped and bottomed multiple times earlier this year. That's also the 61.8% Fibonacci retracement based on this year's upswing.

The $1,700 level is additionally confirmed by the 38.2% Fibonacci retracement based on the entire 2015 - 2020 rally.
There's also possibility that gold would decline to the $1,500 - $1,600 area or so (50% Fibonacci retracement and the price level to which gold declined initially in 2011), but based on the size of the recent upswing, we no longer think that this scenario is the most likely one.
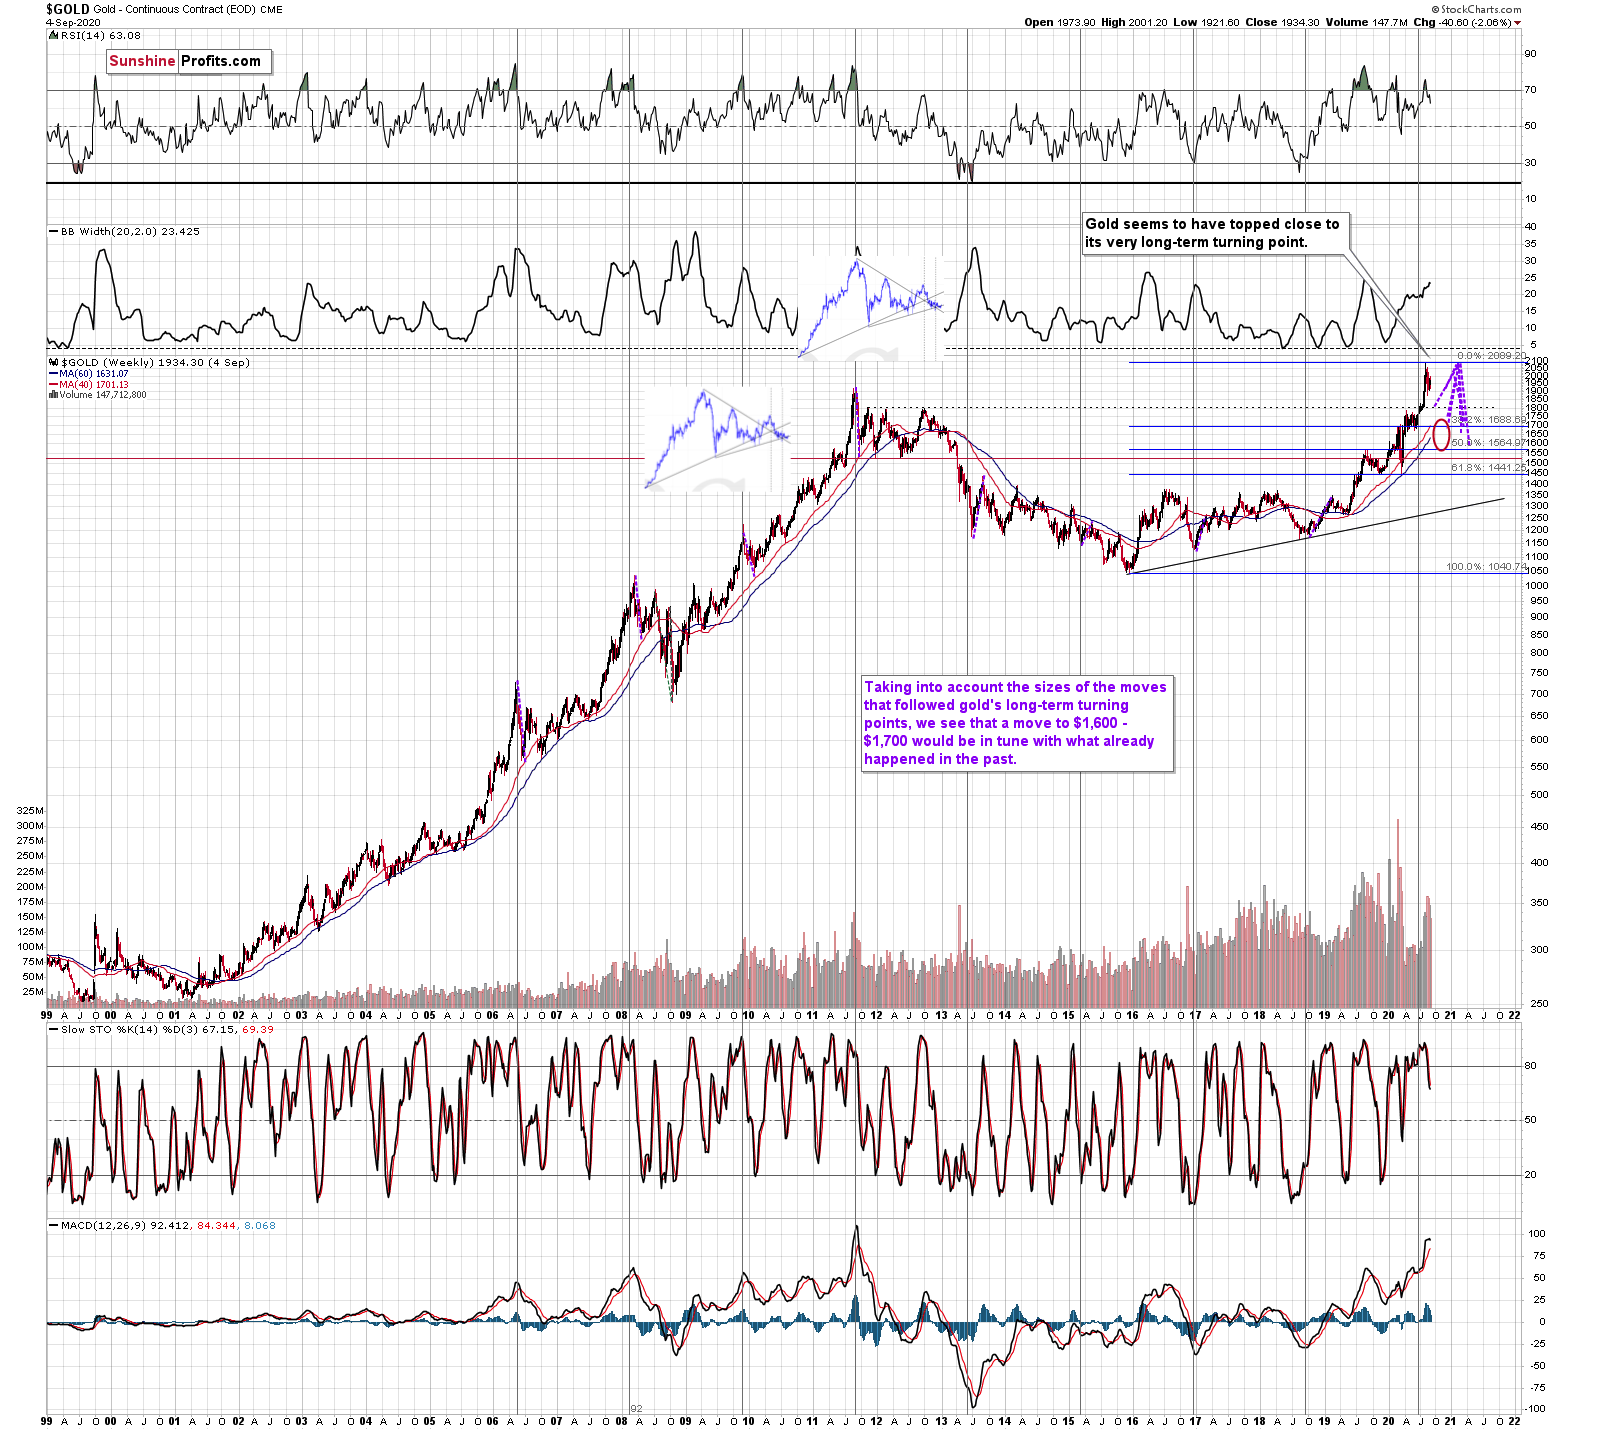
Gold's very long-term turning point is here and since the most recent move has definitely been to the upside, its implications are bearish.
We used the purple lines to mark the previous price moves that followed gold's long-term turning points, and we copied them to the current situation. We copied both the rallies and declines, which is why it seems that some moves would suggest that gold moves back in time - the point is to show how important the turning point is in general.
The big change here is that due to gold's big rally, we moved our downside target for it higher. Based on the information that we have available right now, it seems likely that gold will bottom close to the $1,700 level. That's very much in tune with how much gold moved after the previous long-term turning points.
Also, while we're discussing the long-term charts, please note the most important detail that you can see on the gold, silver, and mining stock charts, is hidden in plain sight. Please note how much silver and miners rallied.
The analogy to the price moves after the previous turning points didn't change, but since the starting point is much higher, the downside target is also higher.
Speaking of upside targets, two weeks ago, we wrote the following:
Based on gold's Fibonacci extensions and the previous major highs and lows (the 2018 high and late-2019 low along with the 2020 low), we get a nearby upside target of $2085. At the moment of writing these words, gold is trading at $2044. Given this week's volatility, it could even be a matter of hours before gold reaches the above-mentioned target and reverses. Taking closing prices into account, gold is up by $35, so if it reverses significantly, we would be likely to see a powerful weekly reversal candlestick and one that causes gold to decline in the following weeks.
That's more or less what happened. Gold topped at $2,089.20. It then declined quite visibly and closed last week at about $1,950.
Before moving to silver, we would like to discuss something very important regarding the most recent rally in gold and the subsequent consolidation.
Do you get the feeling that you have already seen gold perform this way before? Because you did.
The history rhymes, but this time, the similarity is quite shocking.
We copied the short-term chart and pasted it on the long-term chart above and next to the 2011 top. We pasted it twice, so that you can easily compare gold's performance in both cases in terms of both: price and time.
They are very similar to say the least. Yes, these patterns happened over different periods, but this doesn't matter. Markets are self-similar, which is why you can see similar short-term trends and long-term trends (with regard to their shapes). Consequently, comparing patterns of similar shape makes sense even if they form over different timeframes.
After a sharp rally, gold declined quickly. Then we saw a rebound, and a move back to the previous low. Then, after a bit longer time, gold moved close to the most recent high and started its final decline. This decline was less volatile than the initial slide. That's what happened when gold topped in 2011 (and in the following years), and that's what happened also this year. Ok, after the initial decline from the 2011 top, we saw two initial reactive rallies and in 2020 there was just one, but it didn't change the similarity with regard to time.
The patterns of this level of similarity are rare, and when they do finally take place, they tend to be remarkably precise with regard to the follow-up action.
What is likely to follow based on this pattern, is that we're likely to see the end of the slower decline, which will be followed by a big and sharp decline - similarly to what we saw in 2013.
How low could gold slide based on this similarity? Back in 2013, gold declined approximately to the 61.8% Fibonacci retracement based on the preceding rally (the one that started in 2008), so that's the natural target also this time.
And we already wrote about this particular retracement - it's approximately at the $1,700 level. This has been our downside target for weeks, and it was just confirmed by this precise self-similar technique.
Another interesting point is that gold made an interim low close to the 50% retracement and the previous lows. Applying this to the current situation suggests that we could see a smaller rebound when gold moves to about $1,760 - $1,800.
The interim downside target has very important trading implications. Even though gold might rebound just temporarily, something much more profound is likely to take place in case of mining stocks and silver. You will find details in today's flagship Gold & Silver Trading Alert. We invite you to subscribe and read today's issue right away.
Sincerely,
Przemyslaw Radomski, CFA
Editor-in-chief, Gold & Silver Fund Manager
Gold Alerts
More-
Status
New 2024 Lows in Miners, New Highs in The USD Index
January 17, 2024, 12:19 PM -
Status
Soaring USD is SO Unsurprising – And SO Full of Implications
January 16, 2024, 8:40 AM -
Status
Rare Opportunity in Rare Earth Minerals?
January 15, 2024, 2:06 PM
Dear Sunshine Profits,


