

Briefly: Outlook for the precious metals market remains bearish for the following few weeks, and bullish for the following months and years.
Welcome to this week's Gold Investment Update.
Some of the most important analogies and long-term trends might have changed, but it's too early to say so, and most of our previous extensive comments still remain up-to-date in general.
As it is the case usually, we will quote last week's comments while updating everything that needs to be updated or changed. In the end, the entire below analysis is up-to-date at the moment of publishing. The parts that we didn't change (or changed only insignificantly) since last week, will be put in italics.
The most important fundamental factor right now remains the Covid-19 pandemic and what might be referred to as the Great Lockdown. The official total US death count is about 98k, greatly exceeding the regular flu season deaths, and the global death toll is nearing 350k. The new cases and the death toll are quickly climbing in the emerging / BRIC economies. New daily cases in Russia are now regularly about over 8k per day, they are between 12k and 20k in Brazil, and in India they are about 6k daily, and still growing. The sum of these three countries' new daily cases is now bigger than the US daily increase in Covid-19 cases. The new daily cases in Pakistan, Bangladesh, and Mexico are also soaring. The pandemic is not over, and neither is the Great Lockdown.
Even the Fed said so!
FOMC Finally Acknowledges the Situation As Serious
Last week, the FOMC has published minutes of its meeting from April 28-29. They show that the Fed reassessed the coronavirus economic implications since the previous meeting at which the central banks did not yet grasp the full gravity of the situation. This time, they acknowledged that "the second quarter would likely see overall economic activity decline at an unprecedented rate." Indeed, as we reported many times, the GDP will collapse, while the unemployment rate will soar to the levels not seen since the Great Depression.
And what's next? The Fed's baseline scenario is that economic growth will rise appreciably and the unemployment rate will decline considerably in the second half of the year, although a complete recovery was not expected by year-end. So, forget about the V-shaped recovery, even in the baseline scenario!
But the US central bank prepared also a more pessimistic projection which is "no less plausible than the baseline forecast." In this scenario, there would be further economic disruptions, which could lead to a protracted period of severely reduced economic activity:
a second wave of the coronavirus outbreak, with another round of strict restrictions on social interactions and business operations, was assumed to begin around year-end, inducing a decrease in real GDP, a jump in the unemployment rate, and renewed downward pressure on inflation next year. Compared with the baseline, the disruption to economic activity was more severe and protracted in this scenario, with real GDP and inflation lower and the unemployment rate higher by the end of the medium-term projection.
The FOMC members noted several downside risks. The first is, of course, a negative evolution of the coronavirus outbreak and related uncertainty. Actually, the mere possibility of secondary outbreaks of the epidemic may cause "businesses for some time to be reluctant to engage in new projects, rehire workers, or make new capital expenditures." This is very important as investments are the real engine of economic growth. Unfortunately, the real business fixed investment slumped in the first quarter and they are expected to drop even further in the second quarter amid social distancing restrictions, declines in crude oil prices and elevated level of uncertainty. Thus, the future pace of economic growth might be sluggish.
The second major risk is, what we also warned about, that "even after government-imposed social-distancing restrictions come to an end, consumer spending in these categories would likely not return quickly to more normal levels." Some people even say that the behavioral changes could persist until the wide distribution of the vaccine. It doesn't require much imagination to predict that many companies will go bankrupt. For example, even before the pandemic, many restaurants had tiny profit margins. With only half of tables occupied, such enterprises will not survive. Not to mention airlines or travel companies. So, even the central banks figured out that "even after social-distancing requirements were eased, some business models may no longer be economically viable, which could occur, for example, if consumers voluntarily continued to avoid participating in particular forms of economic activity."
Third, some workers who lost job will not get it back quickly, as they may experience a loss of skills or even become discouraged and exit the labor force. As we wrote earlier, it is very easy to lose job or become broke, but it takes more time and effort to get a new job - especially if generous unemployment benefits do not encourage to take quick actions - or to set up a new business, especially when one is confronted with the sea of uncertainty.
Fourth, "higher levels of government indebtedness, which would be exacerbated by fiscal expenditures that were necessary to combat the economic effects of the pandemic, could put downward pressure on growth in aggregate potential output." Bravo, Fed, you finally realized that debt only borrows the economic growth from the future!
Fifth, there are significant risks to financial stability. A number of the FOMC members were concerned that banks and corporations could come under greater stress, if adverse scenarios for the spread of the pandemic and economic activity were realized. The high level of corporate debt and low energy prices exacerbates these risks.
Implications for Gold
The FOMC minutes reaffirm recent Powell's interviews, speeches and testimonies that prepare investors for an unprecedented disaster in the second quarter and subdued economic activity later this year with significant downside risks. As Powell's remarks were generally positive for the gold prices, the minutes should continue to be supportive for the yellow metal too, although the main message has been already known by investors.
However, the minutes show also two new things. First, they indicate that the FOMC members want to be more transparent regarding the future trajectory of interest rates. So, at the upcoming meeting, we could see important changes in the Fed's forward guidance: "While participants agreed that the current stance of monetary policy remained appropriate, they noted that the Committee could, at upcoming meetings, further clarify its intentions with respect to its future monetary policy decisions." Given the epidemiological - we are all epidemiologists now! - and economic situation, we expect dovish moves, which should be positive for gold prices (please keep in mind that it's about the following months, not necessarily weeks).
Second, the minutes show the increasing support for the yield-curve control:
Several participants remarked that a program of ongoing Treasury securities purchases could be used in the future to keep longer-term yields low. A few participants also noted that the balance sheet could be used to reinforce the Committee's forward guidance regarding the path of the federal funds rate through Federal Reserve purchases of Treasury securities on a scale necessary to keep Treasury yields at short- to medium-term maturities capped at specified levels for a period of time.
As the chart below shows, the real interest rates are already below zero. If the Fed decides to cap the bond yields, they will remain at ultra-low levels.
Chart 1: Real interest rates (red line, left axis, US 10-year inflation-indexed Treasury yields) and the price of gold (yellow line, right axis, London P.M. Fix)
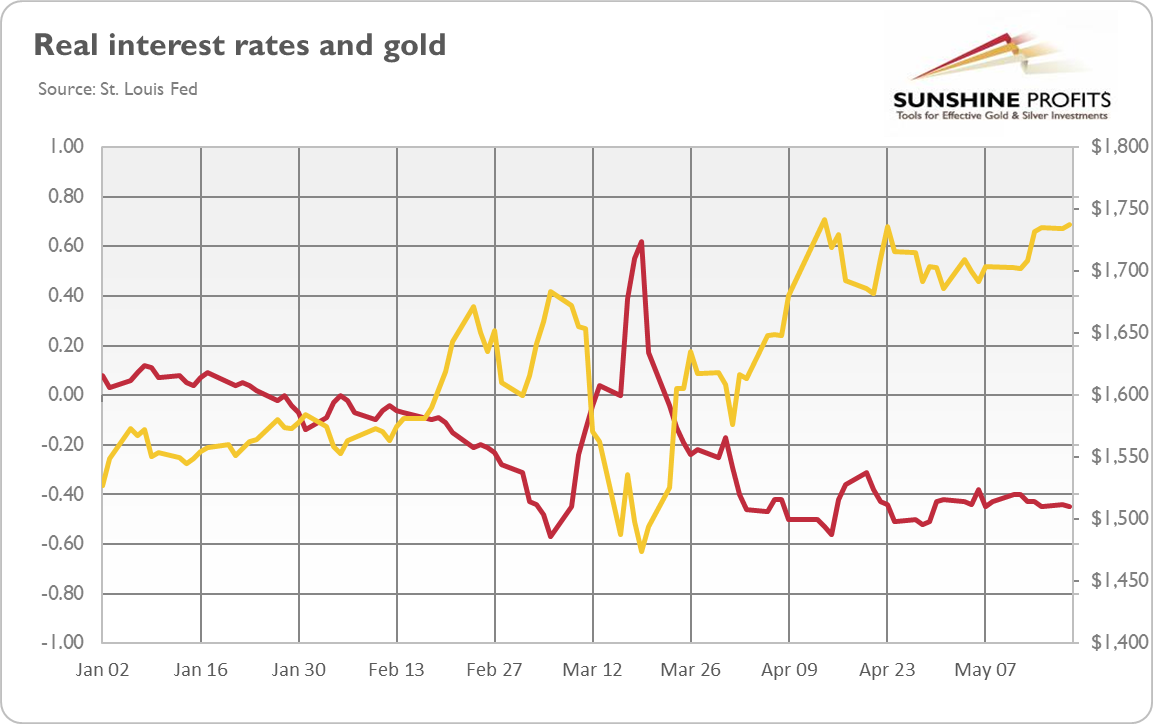
The elimination of the upward pressure on the interest rates would be positive for the gold prices. Gold is a non-interest bearing assets, so it benefits from low real interest rates, in particular from negative interest rates.
This means that the economic implications are likely much worse than the stock market seems to assume. The Lockdown will have to stay in place in one way or the other for quite long, and there are virtually no justified hopes for a vaccine before the end of the year. And even so, many people would likely refuse to take it.
This means that at the same time:
- The overall, fundamental outlook for gold has been, and remains very positive, and it's likely to cause gold to soar in the following months and likely years.
- The fundamental outlook is positive for the US dollar at least in the short run, as the BRIC / developing countries are entering much worse periods of the pandemic.
- There's likely to be another wave down in the stock market, as investors seem to be too optimistic regarding the economic implications of what happened in the last few months and what's likely to happen in the following months.
This means that we are still likely to see a repeat of what we saw in March. The extent of the phenomenon that we're about to see (move higher in the USDX and move lower in stocks, PMs, and miners) remains to be seen, however, a move below the March lows remains in the cards.
Based on how high miners have rallied after the bottom, it could be the case that the upcoming slide will ultimately not take them to new lows, but it's too early to say that this outcome is likely. What we can say right away, is that a move higher in the US dollar is very likely to be seen and at some point - despite its early slide - the precious metals sector is likely to stop reacting to additional powerful rallies in the USDX. This factor will be more important in our view than the price levels that gold, silver, and mining stocks reach. Once PMs show the above-mentioned kind of strength, the outlook for the sector will become bullish also for the short term.
In other words, what would make the outlook bullish is not a rally by itself, but the stop in the decline. The stop that we theoretically should not see when the USD Index keeps soaring. As the USD Index has been consolidating so far, we haven't seen the above kind of performance just yet.
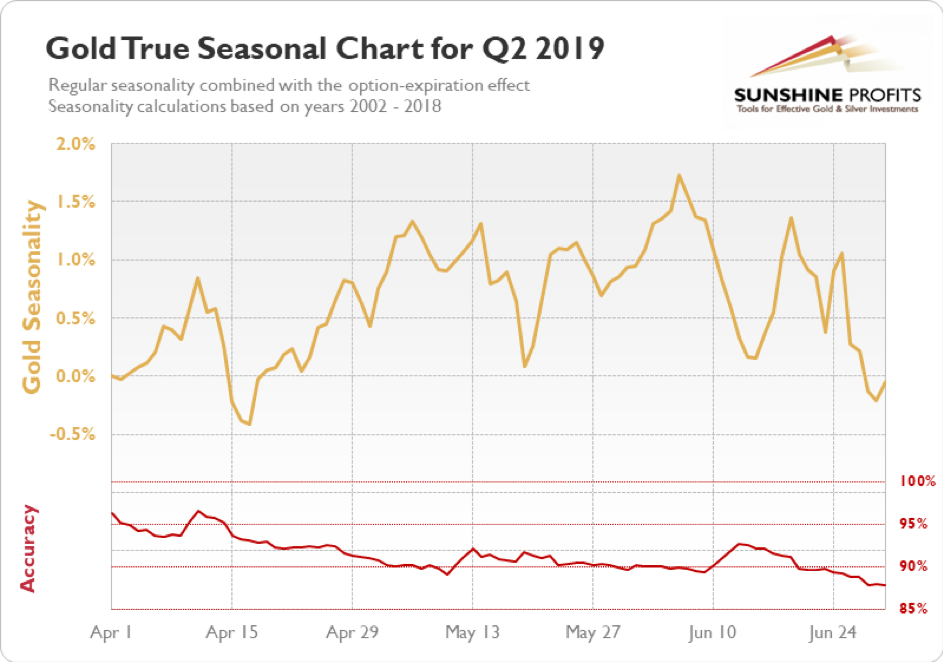
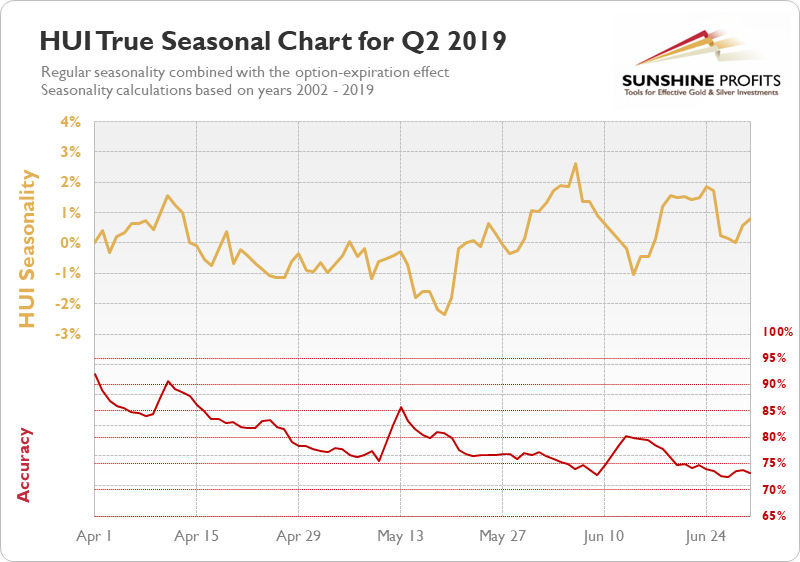
Gold (seasonally) and gold miners (seasonally) move tend to top in early June, so it might be the case that we'll see another attempt to move higher here, and then the decline would take place during June.
Interestingly, there were usually two triggers for these moves: one from the USD Index, and the other from the stock market.
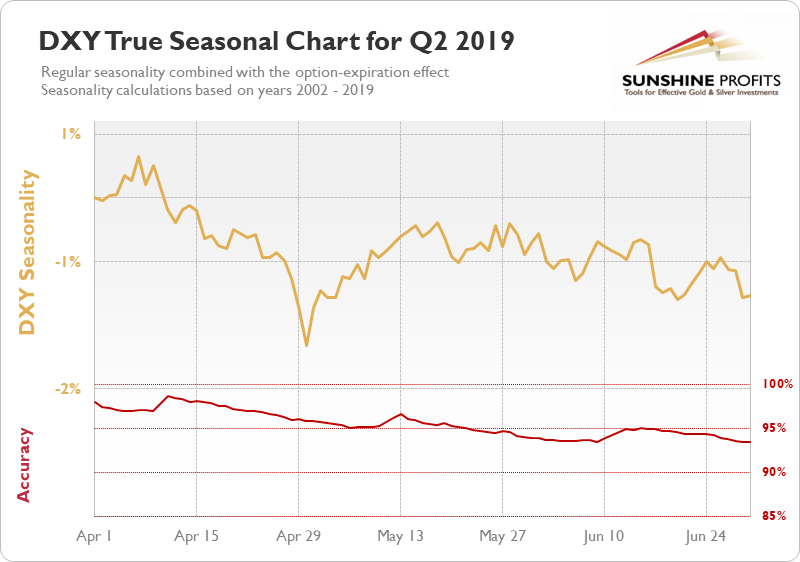
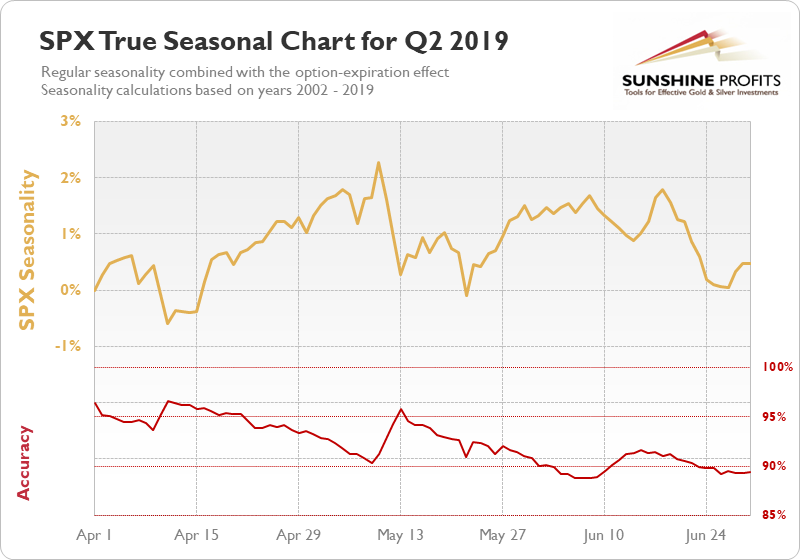
The USDX (seasonally) tends to bottom in early June, while stocks (seasonally) tend to form a local top. These moves are not huge, though, and the accuracy for the seasonality-based forecasts is lowest in the entire quarter.
This means that while a bottom in the USD Index and a top in stocks is likely to be "somewhere near", it doesn't have to take place exactly after May ends. In other words, we should already be on the lookout for either bullish or bearish signs, instead of blindly trusting the seasonal factors. They shed some light but the light itself it dimmed, like the one provided by a candle, instead of one being provided by a laser pointer.
Let's look for more precise signals elsewhere, but before we move there, we would like to remind you about the importance of the USD Index for gold price analysis. If the USD Index is about to move much higher gold almost has to slide, at least temporarily.
The Big Picture View of the USD Index
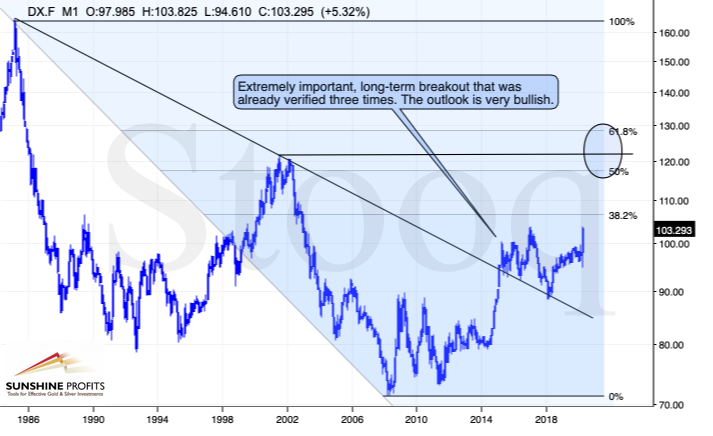
The 2014-2015 rally caused the USD Index to break above the declining very-long-term resistance line, which was verified as support three times. This is a textbook example of a breakout and we can't stress enough how important it is.
The most notable verification was the final one that we saw in 2018. Since the 2018 bottom, the USD Index is moving higher and the consolidation that it's been in for about a year now is just a pause after the very initial part of the likely massive rally that's coming.
If even the Fed and the U.S. President can't make the USD Index decline for long, just imagine how powerful the bulls really are here. The rally is likely to be huge and the short-term (here: several-month long) consolidation may already be over.
There are two cases on the above chart when the USD Index was just starting its massive rallies: in the early 1980s and in mid-90s. What happened in gold at that time?
Gold Performance When the USD Index Soars

These were the starting points of gold's most important declines of the past decades. The second example is much more in tune with the current situation as that's when gold was after years of prolonged consolidation. The early 1980s better compare to what happened after the 2011 top.
Please note that just as what we saw earlier this year, gold initially showed some strength - in February 1996 - by rallying a bit above the previous highs. The USD Index bottomed in April 1995, so there was almost a yearly delay in gold's reaction. But in the end, the USD - gold relationship worked as expected anyway.
The USD's most recent long-term bottom formed in February 2018 and gold seems to have topped right now. This time, it's a bit more than a year of delay, but it's unreasonable to expect just one situation to be repeated to the letter given different economic and geopolitical environments. The situations are not likely to be identical, but they are likely to be similar - and they indeed are.
What happened after the February 1995 top? Gold declined and kept on declining until reaching the final bottom. Only after this bottom was reached, a new powerful bull market started.
Please note that the pace at which gold declined initially after the top - in the first few months - was nothing to call home about. However, after the initial few months, gold's decline visibly accelerated.
Let's compare the sizes of the rallies in the USDX and declines in gold. In the early 80s, the USDX has almost doubled in value, while gold's value was divided by the factor of 3. In the mid-90s, the USDX rallied by about 50% from its lows, while gold's value was divided by almost 1.7. Gold magnified what happened in the USD Index in both cases, if we take into account the starting and ending points of the price moves.
However, one can't forget that the price moves in USD and in gold started at different times - especially in the mid-90s! The USDX bottomed sooner, which means that when gold was topping, the USDX was already after a part of its rally. Consequently, when gold actually declined, it declined based on only part of the slide in the USDX.
So, in order to estimate the real leverage, it would be more appropriate to calculate it in the following way:
- Gold's weekly close at the first week of February 1996: $417.70
- USDX's weekly close at the first week of February 1996: 86.97
- Gold's weekly close at the third week of July 1999: $254.50
- USDX's weekly close at the third week of July 1999: 103.88
The USD Index gained 19.44%
Gold lost 39.07% (which means that it would need to gain 64.13% to get back to the $417.70).
Depending on how one looks at it, gold actually multiplied USD's moves 2-3 times during the mid-90 decline.
And in the early 1980s?
- Gold's weekly close at the third week of January 1980: $845
- USDX's weekly close at the third week of January 1980: 85.45
- Gold's weekly close at the third week of June 1982: $308.50
- USDX's weekly close at the third week of June 1982: 119.01
The USD Index gained 39.27%
Gold lost 63.49% (which means that it would need to gain 173.91% to get back to $845).
Depending on how one looks at it, gold actually multiplied USD's moves by 1.6 - 4.4 times during the early-80 decline.
This means that just because one is not using U.S. dollars as their primary currency, it doesn't result in being safe from gold's declines that are accompanied by USD's big upswings.
In other words, the USD Index is likely to soar, but - during its decline - gold is likely to drop even more than the USD is going to rally, thus falling in terms of many currencies, not just the U.S. dollar.
Please note that there were wars, conflicts and tensions between 1980 and 2000. And the key rule still applied. Huge rallies in the USD Index mean huge declines in gold. If not immediately, then eventually.
Having covered the most important factor for the USD Index and gold, let's take a look at the other - also important - factors influencing both of these markets.
More on the USD Index and Gold
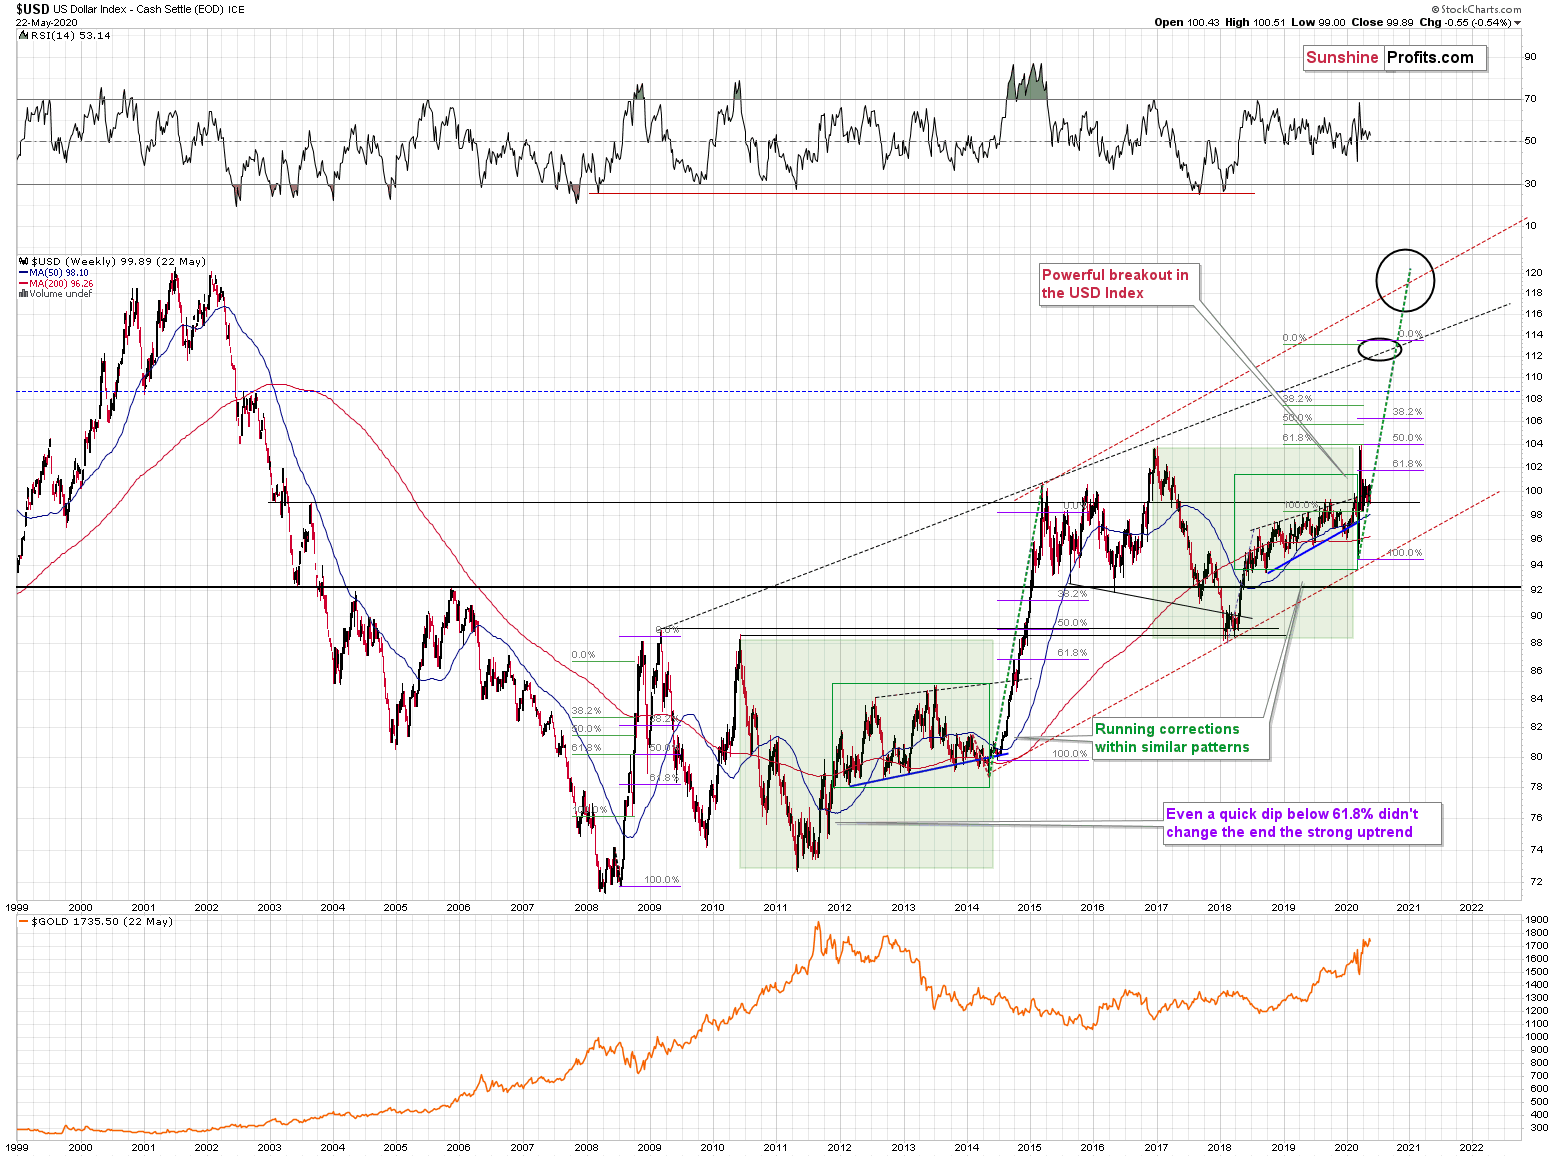
The USD Index was previously (for the entire 2019 as well as parts of 2018 and 2020) moving up in a rising trend channel (all medium-term highs were higher than the preceding ones) that formed after the index ended a very sharp rally. This means that the price movement within the rising trend channel was actually a running correction, which was the most bullish type of correction out there.
If a market declines a lot after rallying, it means that the bears are strong. If it declines a little, it means that bears are only moderately strong. If the price moves sideways instead of declining, it means that the bears are weak. And the USD Index didn't even manage to move sideways. The bears are so weak, and the bulls are so strong that the only thing that the USD Index managed to do despite Fed's very dovish turn and Trump's calls for lower USD, is to still rally, but at a slower pace.
We previously wrote that the recent temporary breakdown below the rising blue support line was invalidated, and that it was a technical sign that a medium-term bottom was already in.
The USD Index soared, proving that invalidation of a breakdown was indeed an extremely strong bullish sign.
Interestingly, that's not the only medium-term running correction that we saw. What's particularly interesting is that this pattern took place between 2012 and 2014 and it was preceded by the same kind of decline and initial rebound as the current running correction.
The 2010 - 2011 slide was very big and sharp, and it included one big corrective upswing - the same was the case with the 2017 - 2018 decline. They also both took about a year. The initial rebound (late 2011 and mid-2018) was sharp in both cases and then the USD Index started to move back and forth with higher short-term highs and higher short-term lows. In other words, it entered a running correction.
The blue support lines are based on short-term lows and since these lows were formed at higher levels, the lines are ascending. We recently saw a small breakdown below this line that was just invalidated. And the same thing happened in early 2014. The small breakdown below the rising support line was invalidated.
Since there were so many similarities between these two cases, the odds are that the follow-up action will also be similar. And back in 2014, we saw the biggest short-term rally of the past 20+ years. Yes, it was bigger even than the 2008 rally. The USD Index soared by about 21 index points from the fakedown low.
The USDX formed the recent fakedown low at about 96. If it repeated its 2014 performance, it would rally to about 117 in less than a year. Before shrugging it off as impossible, please note that this is based on a real analogy - it already happened in the past.
In fact, given this month's powerful run-up, it seems that nobody will doubt the possibility of the USD Index soaring much higher. Based on how things are developing right now, it seems that the USD Index might even exceed the 117 level, and go to 120, or even higher levels. The 120 level would be an extremely strong resistance, though.
Based on what we wrote previously in today's analysis, you already know that big rallies in the USD Index are likely to correspond to big declines in gold. The implications are, therefore, extremely bearish for the precious metals market in the following months.
On the short-term note, it seems that the USD Index has finished or almost finished its breather after the powerful run-up. While the base for the move may be similar to what happened between 2010 and 2014, the trigger for this year's sharp upswing was similar to the one from 2008. In both cases, we saw dramatic, and relatively sudden rallies based on investors seeking safe haven. The recent upswing was even sharper than the initial one that we had seen in the second half of 2008. In 2008, the USDX corrected sharply before moving up once again, and it's absolutely no wonder that we saw the same thing also recently.
But a correction after a sharp move absolutely does not imply that the move is over. In fact, since it's so in tune with what happened after initial (!) sharp rallies, it makes the follow-up likely as well. And the follow-up would be another powerful upswing. Just as a powerful upswing in the USD Index triggered gold's slide in 2008 and in March 2020, it would be likely to do the same also in the upcoming days / weeks.
Please note that the 2008 correction could have been used - along with the initial starting point of the rally - to predict where the following rally would be likely to end. The green lines show that the USDX slightly exceeded the level based on the 2.618 Fibonacci extension based on the size of the correction, and the purple lines show that the USDX has approximately doubled the size of its initial upswing.
Applying both techniques to the current situation, provides us with the 113 - 114 as the next target area for the USD Index. A sharp rally to that level (about 13-14 index points) would be very likely to trigger the final sell-off in gold, silver, and mining stocks.
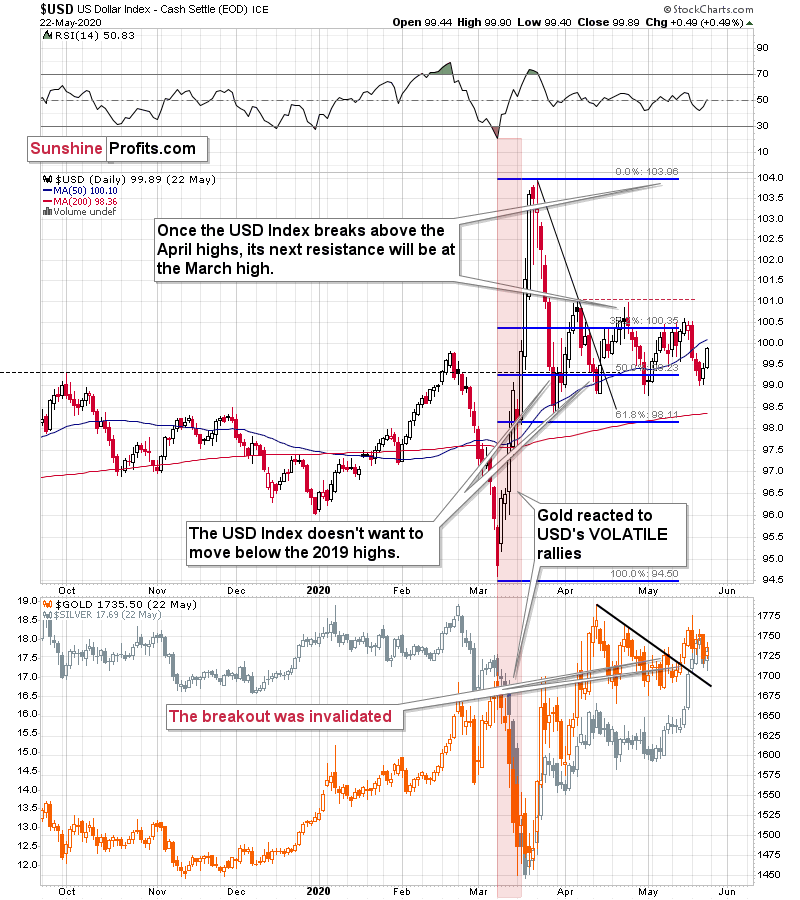
The USDX moved below its 50-day moving average (marked with blue) and it confirmed the breakdown for the first time since early March. The support provided by the previous bottoms was more important for the US currency index and it bottomed slightly above them. For the past two months, the USD index has been making higher lows and lower highs, forming a triangle pattern. Breakout or breakdown from it is likely to result in another sizable move.
This might be the laser-focus signal that the seasonal analysis currently lacks. Based on the long-term picture, and how the Covid-19 situation is developing, the breakout is likely to be to the upside, and the next big move is likely to be up. This means that the next sizable downswing in gold is likely just around the corner.
So far, the USD Index is down today, while silver is up, and gold is flat.
Gold refusing to rally despite a move lower in the USDX is bearish.
Silver rallying strongly without gold's lead is often a topping sign, so it's bearish as well.
Speaking of relative valuations and the way gold reacts to certain developments, this is a good place to reply to the question that we received recently about gold's link with TIPS' yields.
Q: One question that plagues me concerns what turned the precious metals down in late 2011? GLD peaked at $183 on 9/2/11 as TIPS yield declined toward 0%. TIPS yield went negative on 12/16/11 at $155 GLD. Then GLD re-peaked at $172 on 10/05/12 with TIPS yield at negative 82bps. GLD declined to $131 by 5/18/13 with TIPS yield negative 31bps. Why did GLD decline and rise and fall again during this period with negative TIPS yields?
Real interest rates and yields are indeed one of the key fundamental factors for gold, so the reply to the above question is actually an explanation how markets can react to what going on in the world and/or in other markets/indices. Why did gold / GLD decline and rise and fall again during the period with negative TIPS yields, and/or why can gold / GLD decline and rise against any other major factor (such as the USD Index)?
The question may seem complex, but the answer is essentially simple. Because the markets are emotional and not logical in the short term. This applies also to the gold market. Gold rallied too far, too fast in 2010 and 2011. It got ahead of itself, the buying power dried up (at least at these prices) and the parabolic upswing was broken. Did anything major change for gold during that time? Not really. Did anything change on the emotional front? Everything did! People moved from seeing only higher prices to panicking after the initial decline and then back to euphoria once gold rallied some more.
The link between important fundamental drivers (and also technical drivers to some extent) and the price of a given asset (also gold) can sometimes (and this is the case here) be compared to the situation in which one holds a relatively long spring that is attached to a hanging metal ball of medium weight. If you carry it steadily and slowly, sideways or up / down, it will move relatively similar to your hand. The spring will not do much, and once you stop moving, the metal ball will also stop.
But what happens when you suddenly move your hand or quickly make a few steps in a one direction? Initially (for a fraction of a second) the inertia will make the ball stay more or less in place, while the spring becomes longer (that's what happens with the market that already has some fundamental factors in place but price is stuck below a resistance line). Then, at some point, the ball will start moving toward you as the spring collapses. Once the metal ball starts moving, it quickly increases its speed, catching up with where you moved (markets move significantly after a breakout/breakdown). But what happens then? You can stop moving, or you can make your move steady once again. And what happens to the metal ball? Does it stop along with you? Absolutely not! It has its momentum and the spring attached to it and you know very well that it will take some time before the entire mechanism cools down. That's exactly what happens on the market with regard to investors' emotionality. One might still be moving in the initial direction, at a normal - much slower - pace, and the metal ball will approach quickly, going faster and beyond one's hand, only to then slow down as the spring prevents further movement. Then the metal ball would move back and forth, being a "damped harmonic oscillator".
By the way, please take one more look at the above USD Index chart and compare it to the "underdamped oscillator" chart over here. That's not a coincidence - emotionality affects the price movement similar way that the existence of the spring affects the movement of the metal ball.
So, why did GLD move back and forth between 2011 and 2013, during the period with negative TIPS yields? Because it was still reacting to what had happened previously. These moves were driven much more by emotionality (spring), than by the fundamental factors (hand movement).
Continuing the analogy, the fundamental analysis would be predicting where the hand is going to move as the ball (price) would follow eventually. The technical analysis, on the other hand (pun intended), is focusing on the changes in ball's behavior (speed, acceleration, shape of the move) in order to detect in which part of the reactive stage the ball is. Once one establishes the fundamentals, the extra edge can be gained thanks to focusing on details of metal ball's (price's) movement.
Having said that, let's take a more detailed look at gold.
Gold's Long-term View
In short, the long-term analogy in terms of prices to what happened in 2008 still seems somewhat intact:
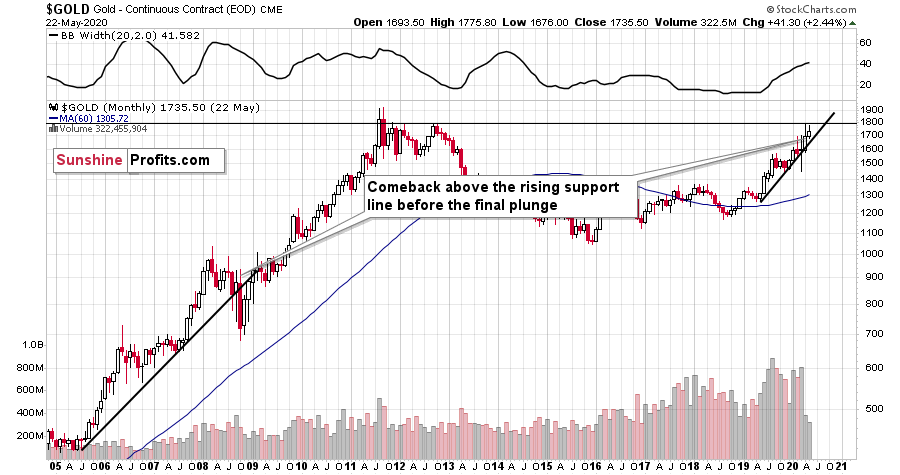
In 2008, after the initial plunge, and a - failed - intramonth attempt to move below the rising support line, gold came back above it and it closed the month there. The same happened in March 2020.
During the next month in 2008, gold rallied and closed visibly above the rising support line. The same was the case in April, 2020.
In the following month - the one analogous to May 2020 - gold initially moved higher, but then it plunged to new lows and finally closed the month below the rising support line. We might see something very similar this month.
In fact, it seems that we have already seen something very similar this month - gold moved very close to the April highs, but failed to break higher and it's now declining. It's too early to say with 100% certainty that the top is already in, but combining this with what we see on gold's seasonality chart, makes it likely that the top is already in or that it will form before the end of this month.
Let's check how low gold could decline during this slide. In short, the above is based on the long-term gold chart and it hasn't changed this week.
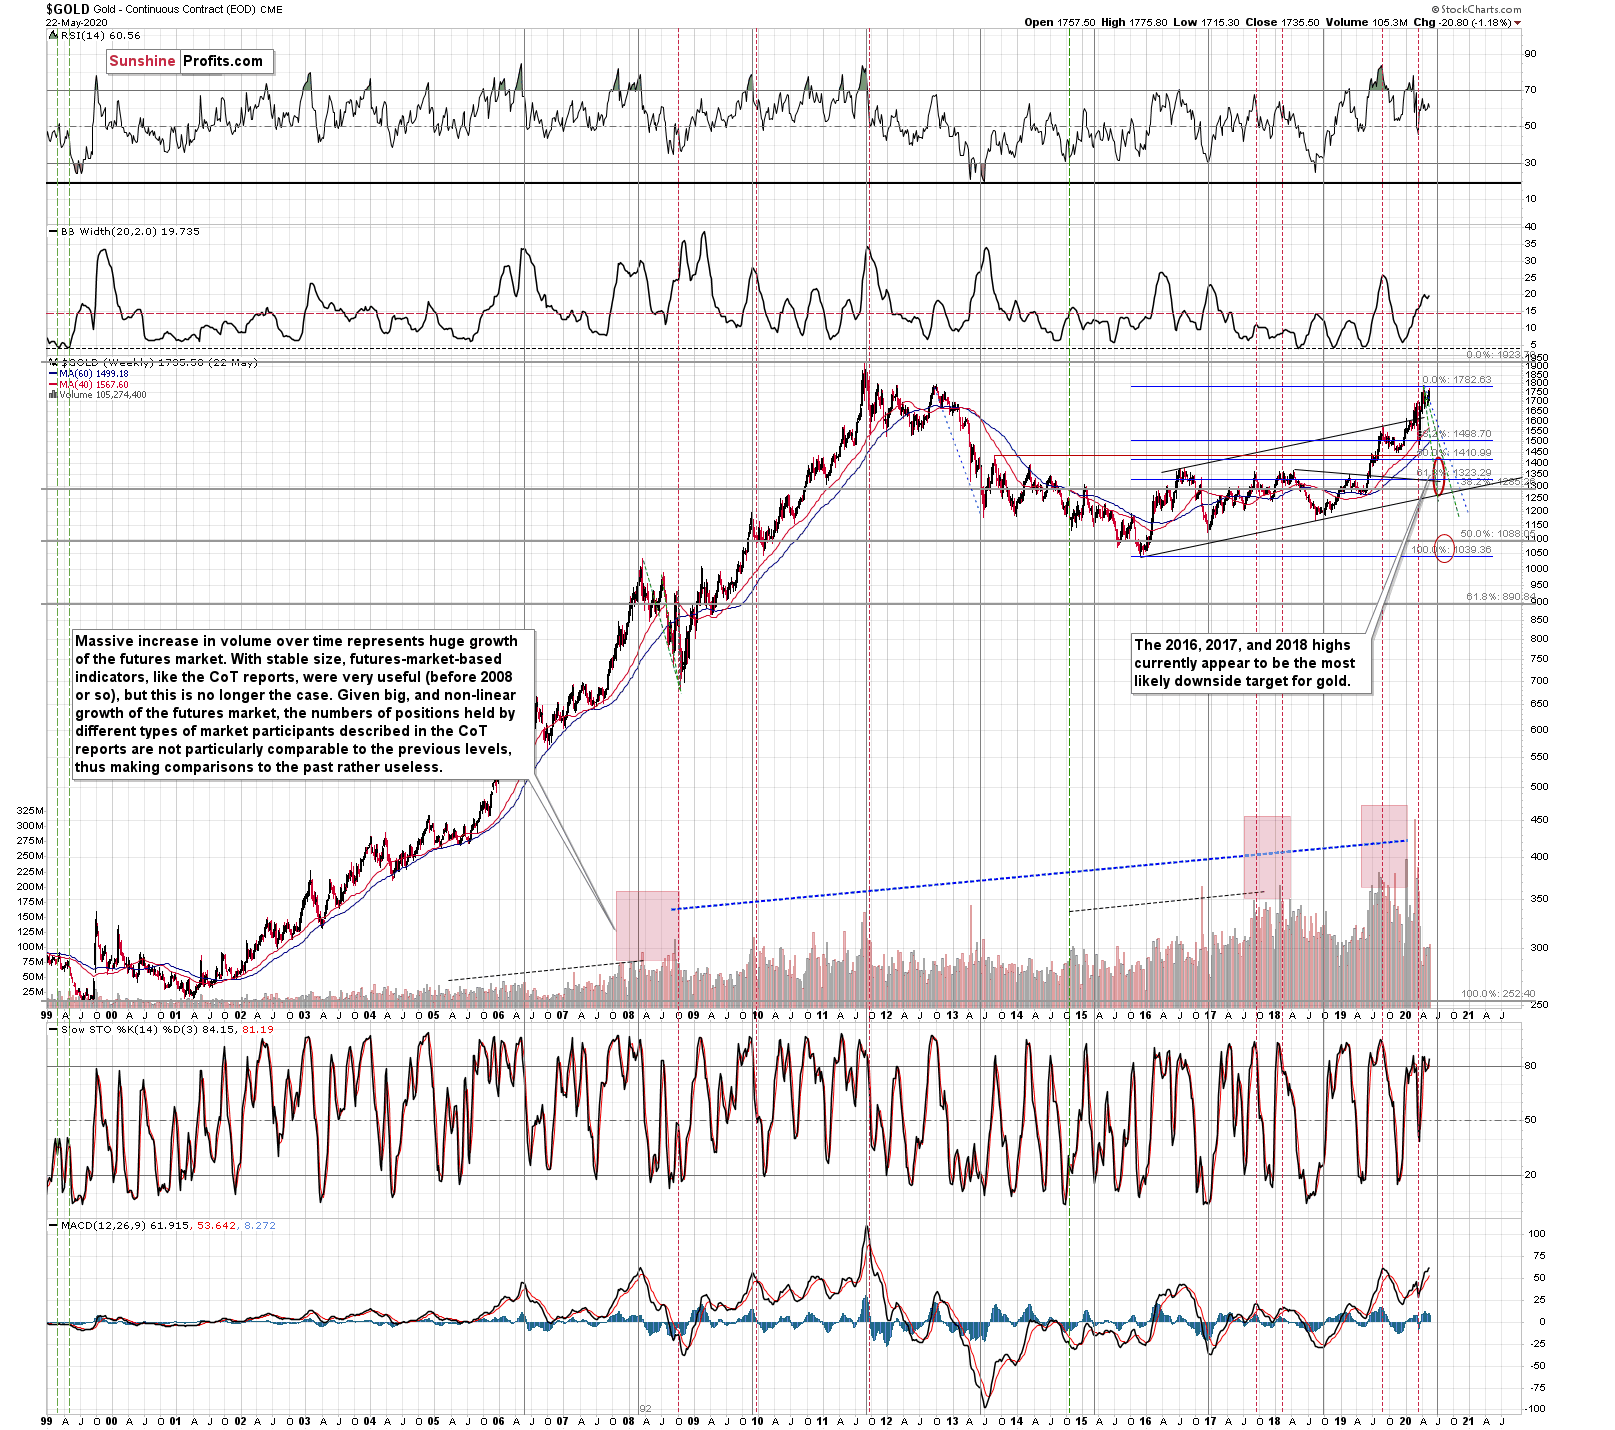
Our current (and it might change in the following days) estimate is that gold would decline to the 2016, 2017, and 2018 lows - slightly below $1,400. Why? Because this level is confirmed by several major highs, which makes it the strongest support that's below the previous 2020 lows.
Moreover, back in 2008, gold bottomed about 8% below its initial September bottom. The recent bottom in gold was about $1,451. If history repeats itself, gold could decline to 92% x $1,451 = about $1,335.
In 2008, gold also declined by about 27% from its previous high. If the history repeats itself here, and gold topped yesterday (which seems quite likely), we can see gold's bottom at 73% x $1,789 = about $1,306.
The 2016, 2017, and 2018 highs are the strongest gold support that we have close to the above-mentioned price levels. Gold's fundamental situation is even better now than it was in 2008, so we think that looking for the support above the above-mentioned 2008-based price levels is more appropriate than basing it the above-mentioned gold trading tips. The 2016, 2017, and 2018 highs fulfill this requirement.
This means that gold would be likely to bottom between about $1,350 and $1,380.
Of course, the above estimates assume that gold would decline significantly and not modestly, when the USD Index does indeed break higher.
The way gold responds to USD's rally from the current levels to the previous 2020 highs should tell us a lot about what's really in store for gold in the following weeks.
Please note that the very long-term cyclical turning point in gold (marked with vertical, gray lines) is due in July. Until the 2011 top, these turning points were tops, and after the 2011 top - in each case - these turning points corresponded to major bottoms. If gold is to bottom in July, it's about time for it to start declining. This factor serves, thus, as a bearish sign.
Having said that, let's take a look at silver. In case of the white metal, its ratio to gold might be more important at this time than price itself.
Gold to Silver Ratio's Confirmation
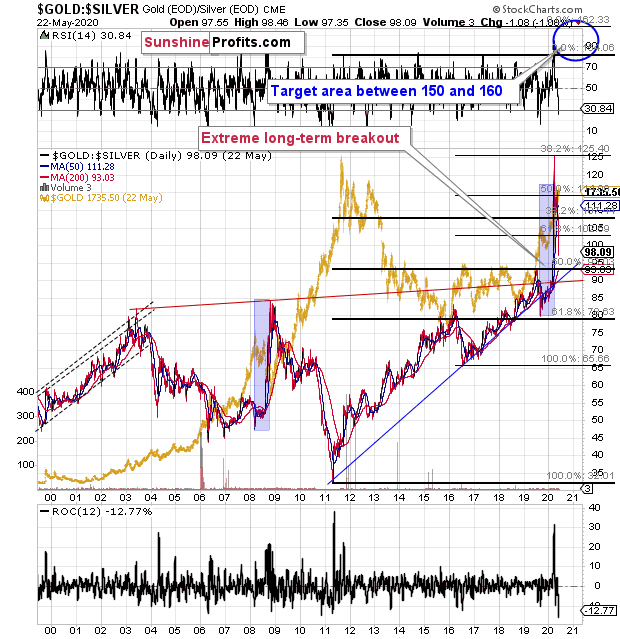
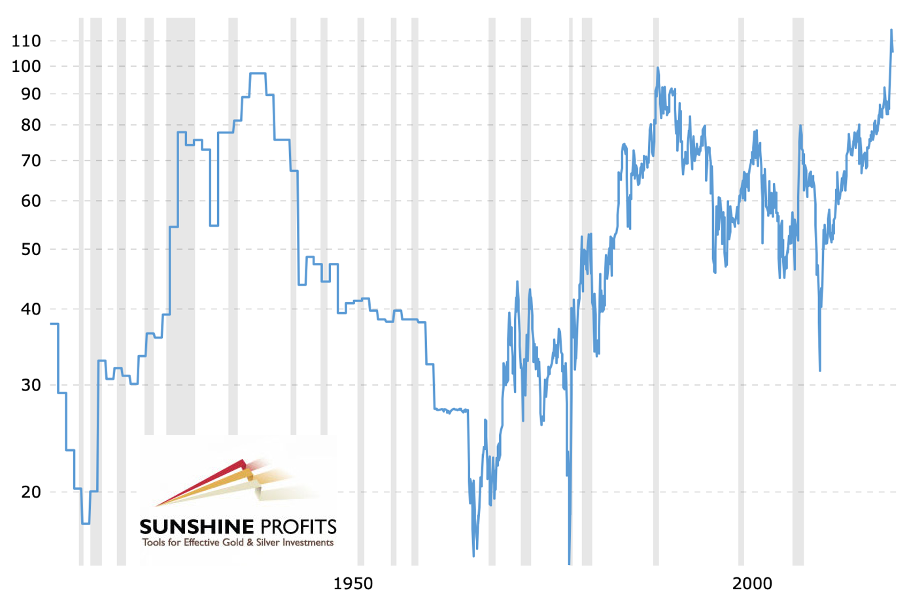
Based on the futures prices, the ratio moved back below the 100 level, but based on the spot prices, the breakout was just verified. Last week, silver declined visibly after the ratio moved to 100, which caused it to rally to over 101. At the moment of writing these words, gold is almost exactly 100 times more expensive than silver. The very long-term support that the 100 level currently provides, is being tested one more time.
The breakout was earlier confirmed as the ratio closed above 100 for many days, which means that the support provided by the 100 level is likely to hold. This makes the outlook bullish for the ratio, but bearish for the precious metals sector, especially for silver in the short run.
On a long-term basis, silver reached its declining resistance line and it's still below the levels from which the previous 2020 slide started.
Even though silver rallied considerably, it doesn't have to be the case that the link between now and 2008 is broken.
This is the link that we mean:
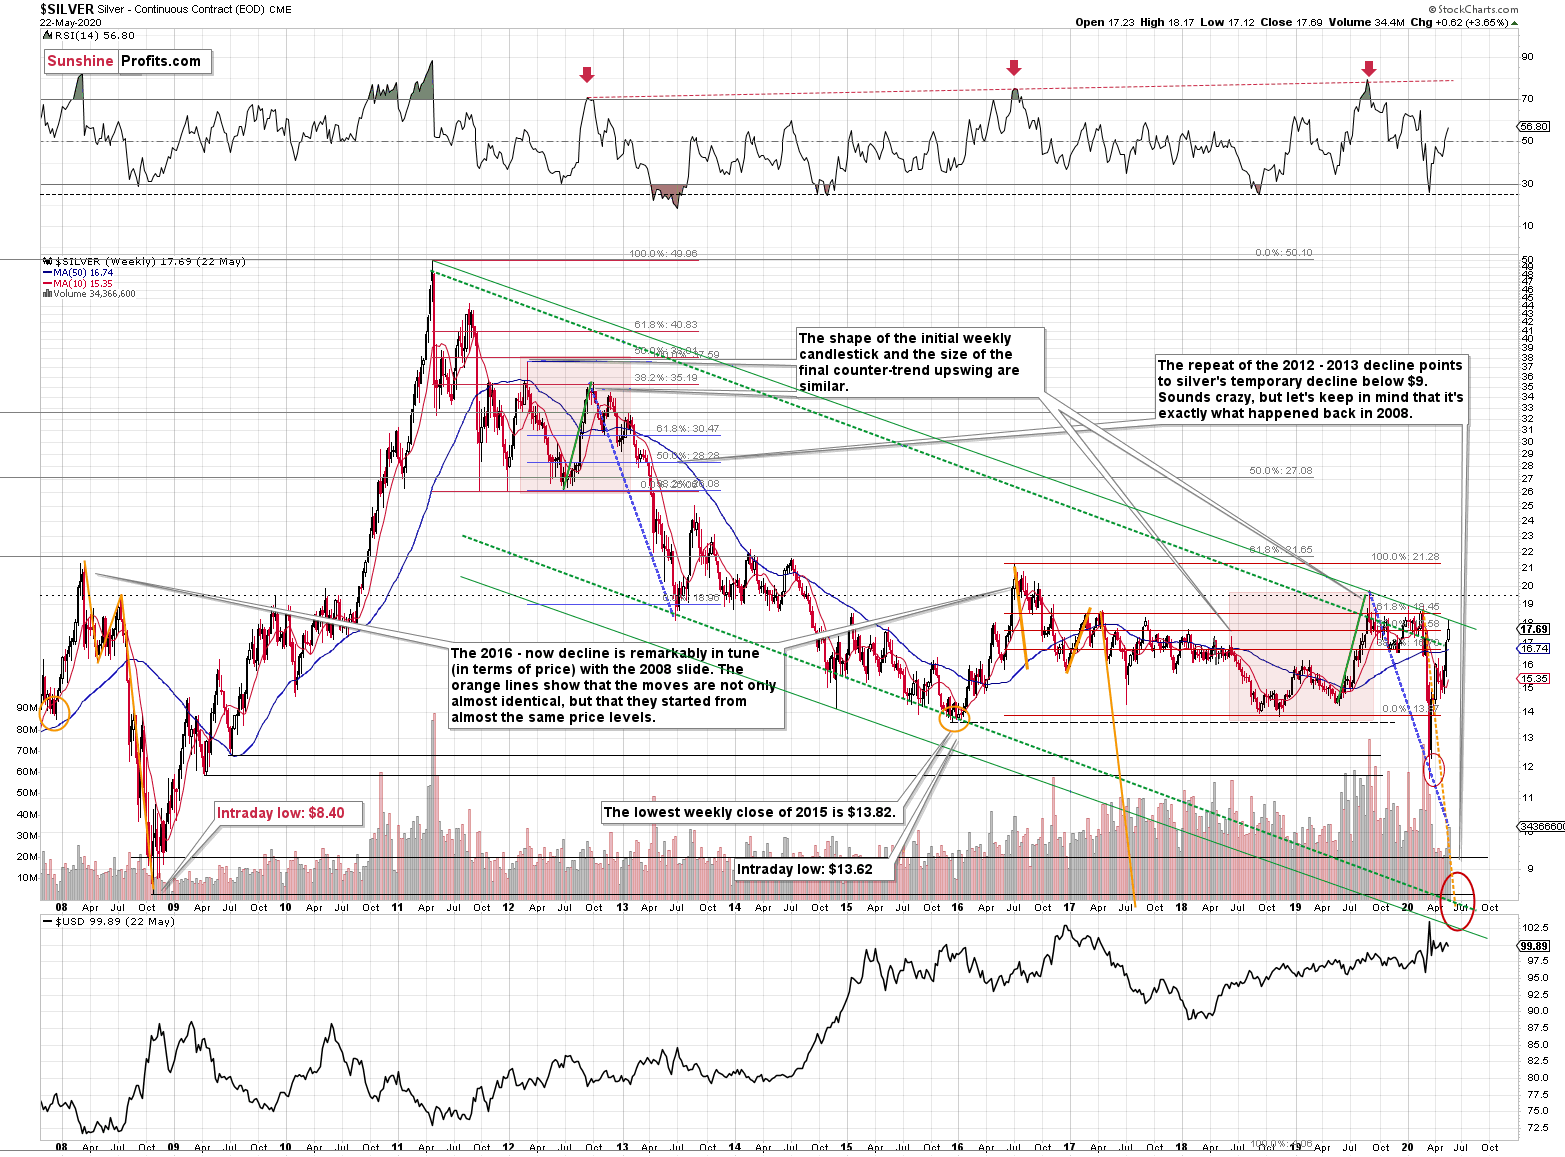
Silver just plunged to our initial target level and reversed shortly after doing so. It was for many months that we've been featuring the above silver chart along with the analogy to the 2008 slide. People were laughing at us when we told them that silver was likely to slide below $10.
Well, the recent low of $11.64 proves that we were not out of our minds after all. Our initial target was reached, and as we had explained earlier today, the entire panic-driven plunge has only begun.
Those who were laughing the loudest will prefer not to notice that silver reversed its course at a very similar price level at which it had reversed initially in 2008. It was $12.40 back then, but silver started the decline from about 50 cent higher level, so these moves are very similar.
This means that the key analogy in silver (in addition to the situation being similar to mid-90s) remains intact.
It also means that silver is very likely to decline AT LEAST to $9. At this point we can't rule out a scenario in which silver drops even to its all-time lows around $4-$5.
Note: Silver at or slightly below $8 seems most probable at this time.
Crazy, right? Well, silver was trading at about $19 less than a month ago. These are crazy times, and crazy prices might be quite realistic after all. The worst is yet to come.
Let's quote what the 2008-now analogy is all about in case of silver.
There is no meaningful link in case of time, or shape of the price moves, but if we consider the starting and ending points of the price moves that we saw in both cases, the link becomes obvious and very important. And as we explained in the opening part of today's analysis, price patterns tend to repeat themselves to a considerable extent. Sometimes directly, and sometimes proportionately.
The rallies that led to the 2008 and 2016 tops started at about $14 and we marked them both with orange ellipses. Then both rallies ended at about $21. Then they both declined to about $16. Then they both rallied by about $3. The 2008 top was a bit higher as it started from a bit higher level. And it was from these tops (the mid-2008 top and the early 2017 top) that silver started its final decline.
In 2008, silver kept on declining until it moved below $9. Right now, silver's medium-term downtrend is still underway. If it's not clear that silver remains in a downtrend, please note that the bottoms that are analogous to bottoms that gold recently reached, are the ones from late 2011 - at about $27. Silver topped close to $20.
The white metal hasn't completed the decline below $9 yet, and at the same time it didn't move above $19 - $21, which would invalidate the analogy. This means that the decline below $10, perhaps even below $9 is still underway.
Now, some may say that back in 2008, silver rallied only to about $14 and since now it rallied to about $16, so the situation is now completely different and that the link between both years is broken. But that's simply not true.
The nominal price levels are just one of the ways that one should look at the analogy - far from being the perfect or most important one.
Please note that back in 2008, there were two smaller bottoms in silver, and this time we saw just one. The decline before the bottom was sharper, so is it really that surprising that the rebound was sharper as well? Silver ended the 2008 corrective upswing once it moved visibly above the declining orange line and that's exactly what happened recently. It also topped once it reached its 10-week moving average (red line). That's exactly what just happened. This MA is at $15.81 and at the moment of writing these words, silver is back below it, trading at $15.65.
The situations are not perfectly identical in terms of nominal prices, but they remain remarkably similar given how different fundamental reasons are behind these price moves (in reality, what's behind both declines is fear that - itself - doesn't change).
The technique used for predicting silver price is clearer than the one that we applied for gold, so it seems useful to look not only at the USD Index for signs, but also at the white metal itself. Once silver moves to $8 or below it, it will likely serve as a strong buy sign for gold, regardless of the price at which gold will be trading at that time.
The 2020 slide was sharper, so it's not that surprising that the rebound was also more notable. Besides, the breakout above the 100 level in the gold to silver ratio and is a small feat either. The comeback to the previously broken 100 level in the ratio is normal, so given gold's recent rally, silver's rally in the last few weeks is not that ground-breaking either.
Consequently, while the 2008-now analogy in terms of price is no longer as clear as it used to be, the breakout in the gold to silver ratio above 100 level is what makes up for the above in terms of overall bearishness of the medium-term silver price developments.
Yes, on a short-term basis, and looking at silver chart alone, the breakout above the April highs and a quick move to the early-March highs was a clearly bullish phenomenon. However, this ignores the fact that silver is known for its fakeouts (fake breakouts) and that looking at its relative performance to gold has been more useful (and profitable) than looking at its individual technical developments, especially if they were not confirmed by analogous moves in gold.
Consequently, we view the current action in silver as bearish, not bullish, especially since the gold to silver ratio moved back to the very strong support level (100), which likely means that silver's strength relative to gold is over, at least for some time.
And what about the performance of the mining stocks?
Gold Miners' and Their 2016 High
The laser-precision technique that tells us whether the precious metals market is going to move higher or lower, could take form of a confirmation or invalidation of a major breakout. And we currently have this exact make-or-break situation in case of gold mining stocks. We previously described the above HUI Index - flagship proxy for the gold miners - in the following way:
The HUI Index declined significantly, and then it rebounded significantly.
Both are likely linked. Miners first declined more sharply than they did in 2008, so the rebound was also sharper. Based on the stimulus and gold reaching new yearly highs, miners also rallied and tried to move to new yearly highs. It's not surprising.
However, if the general stock market is going to decline significantly one more time, and so will gold - and as you have read above, it is very likely - then miners are likely to slide once again as well. This would be in tune with what happened in 2008.
At this time, it may seem impossible or ridiculous that miners could slide below their 2015 lows, but that's exactly what could take place in the following weeks. With gold below their recent lows and the general stock market at new lows, we would be surprised not to see miners even below their 2020 lows. And once they break below those, their next strong resistance is at the 2016 low. However, please note that miners didn't bottom at their previous lows in 2008 - they moved slightly lower before soaring back up.
Please note that the HUI Index just moved to its 2016 high which serves as a very strong resistance. Given the likelihood of a very short-term (1-2 days?) upswing in stocks and perhaps also in gold (to a rather small extent, but still), it could be the case that gold miners attempt to rally above their 2016 high and... Spectacularly fail, invalidating the move. This would be a great way to start the next huge move lower.
And what happened last week?
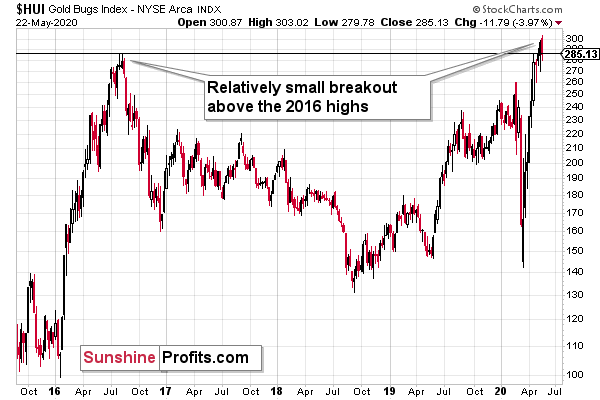
The HUI Index invalidated the breakout above the 300 level, and it also invalidated the breakout above the 2016 high (286.05) in intraday terms by closing at 285.13. This made the bearish picture for gold miners more bearish. The final confirmation of the top being in, will be gold stocks index's close below the highest weekly close of 2016 - 278.61.
The reason we're giving so much attention to the 2016 high right now and so little to anything else - at least in case of the gold stocks - is that what happens with regard to it really is the key to the miners' technical outlook. Confirmed breakout above the 2016 high would be likely to result in a bigger move higher, while its invalidation is likely to result in a bigger move lower.
Given the fact that gold is not moving up despite USD Index's sizable daily decline, it seems that we might see declines in gold and gold miners shortly (as soon as the USDX regains strength), and the decline below HUI's highest weekly close of 2016 will serve as a great bearish confirmation for gold, silver, and miners alike.
Summary
Summing up, despite the very recent moves higher, especially in silver, the outlook for the precious metals market is bearish for the next few weeks, and it's very bullish for the following months. Even if gold, silver, and mining stocks are not going to move to new 2020 lows, they are still likely to decline visibly when the USD Index soars. Based on silver's outperformance and the verification of the breakout in the gold to silver ratio by the move back to the 100 level, and invalidation of gold stocks' breakout above their 2016 high in intraday terms, it seems that the end of the current short-term upswing is at hand.
After the sell-off (that takes gold below $1,400), we expect the precious metals to rally significantly. The final decline might take as little as 1-3 weeks, so it's important to stay alert to any changes.
Most importantly - stay healthy and safe. We made a lot of money on the March decline and the subsequent rebound (its initial part) price moves (and we'll likely make much more in the following weeks and months), but you have to be healthy to really enjoy the results.
To summarize:
Very short-term outlook for the precious metals sector (our opinion on the next 2-3 weeks): Bearish
Short-term outlook for the precious metals sector (our opinion on the next 2 months): Bearish for about 2-3 weeks, and then bullish once again
Medium-term outlook for the precious metals sector (our opinion on the period between 2 and 6 months from now): Bullish
Long-term outlook for the precious metals sector (our opinion on the period between 6 and 24 months from now): Bullish
Very long-term outlook for the precious metals sector (our opinion on the period starting 2 years from now): Bullish
Our preferred ways to invest in and to trade gold along with the reasoning can be found in the how to buy gold section. Additionally, our preferred ETFs and ETNs can be found in our Gold & Silver ETF Ranking.
As a reminder, Gold Investment Updates are posted approximately once per week. We are usually posting them on Monday, but we can't promise that it will be the case each week.
Please note that this service does not include daily or intraday follow-ups. If you'd like to receive them, we encourage you to subscribe to our Gold & Silver Trading Alerts today.
Thank you.
Sincerely,
Przemyslaw Radomski, CFA
Editor-in-chief, Gold & Silver Fund Manager

