

-
Gold Investment Update - Can Gold Really Confirm Its Breakout Above 2011 Highs?
July 27, 2020, 10:22 AMAvailable to premium subscribers only.
The price targets for the precious metals market changed based on new information and gold's breakout to new highs. You will find details in today's Gold & Silver Trading Alert. We invite you to subscribe and read today's issue right away.
Sincerely,
Przemyslaw Radomski, CFA
Editor-in-chief, Gold & Silver Fund Manager -
Gold Investment Update - Translating the Gold Index Signal into Gold Target
July 20, 2020, 9:29 AMLast week, we wrote that gold miners flashed an "extremely overbought" signal, which they had only flashed once in the past - almost right at the 2016 top. The Gold Miners Bullish Percent Index recently moved to the highest level that it could reach - 100.
The only other case when the index was at 100, was in mid-2016.
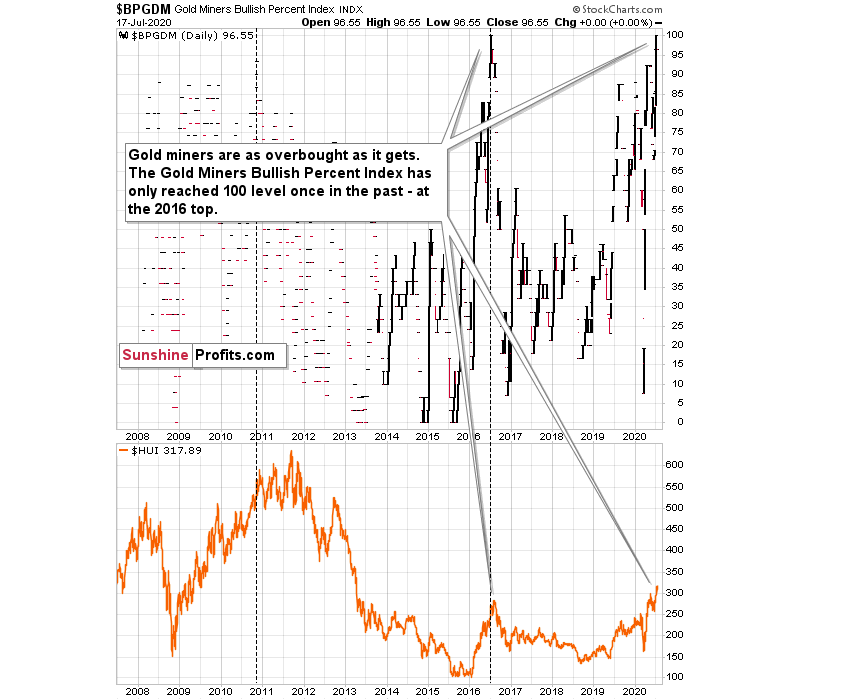
We marked this situation with a vertical dashed line. Did miners continue to move higher for a long time, or did they move much higher? No.
Precisely, the index reached 100 on July 1st 2016, and gold mining stocks moved higher for two additional trading days. Then they topped. This was not the final top, but the second top took miners only about 5% above the initial July high.
This year, the index reached the 100 level on July 2nd - almost exactly 4 years later, and once again practically exactly in the middle of the year. Miners seemed to have formed the intraday high on July 9th - four trading days later.
It's not justified to assume that the delay in the exact top would be 100% identical, but it seems justified to view it as similar. Two-day delay then, and four-day delay now seem quite in tune, and this similarity supports a bearish prediction for gold.
There's also one additional point that we would like to emphasize and it's the previous high that the index made on November 9, 2010. That was the intraday top, so there was no additional delay. There was one additional high about a month later, in December, but miners moved only about 1.5% above the initial high then.
One might ask if mining stocks are really overbought right now given the unprecedented quantitative easing, and the answer is yes. Please note that in 2016 the world was also after three rounds of QE, which was also unprecedented, and it didn't prevent the miners to slide after becoming extremely overbought (with the index at the 100 level). The 100 level in the index reflects the excessive optimism, and markets will move from being extremely overbought to extremely oversold and vice versa regardless of how many QEs there are. People tend to go from the extreme fear to extreme greed and then the other way around, and no fundamental piece of news will change that in general. The economic circumstances change, but fear and greed remain embedded in human (and thus markets') behavior. Taking advantage of this cyclicality is the basis for most (if not all) gold trading tips and the same goes for other markets.
Today, we would like to dig deeper into the analogy to the 2016 top. There are more similarities than just the most-extreme reading from the Gold Miners Bullish Percent Index.
In order to do that, let's zoom in.
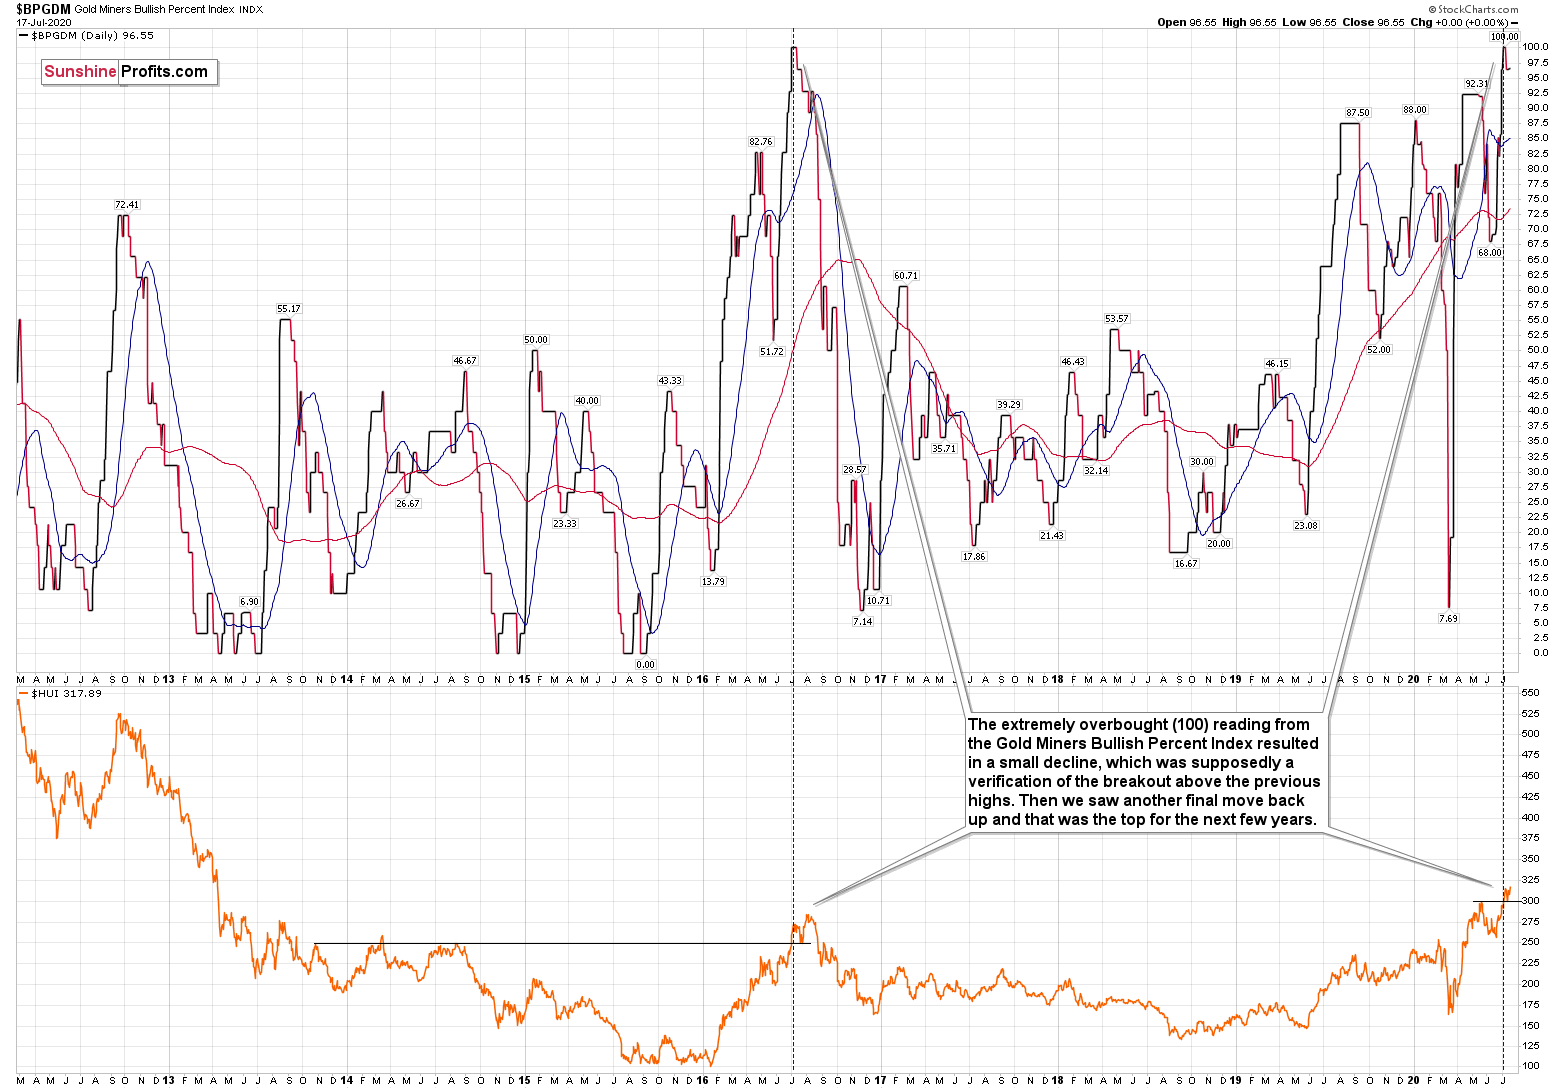
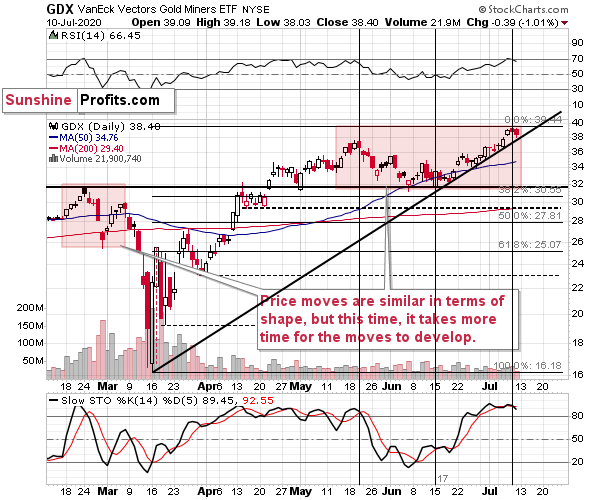
Back in 2016, the extremely overbought (100) reading from the Gold Miners Bullish Percent Index resulted in a small decline, which was supposedly a verification of the breakout above the previous (2013 and 2014) highs. Then we saw another final move back up and that was the top for the next few years.
What happened recently? The extremely overbought reading resulted in a decline back to the previous 2020 high and then another move higher. This is very similar to what we saw in 2016.
What happened in the GDX ETF with regard to its own technical indications?
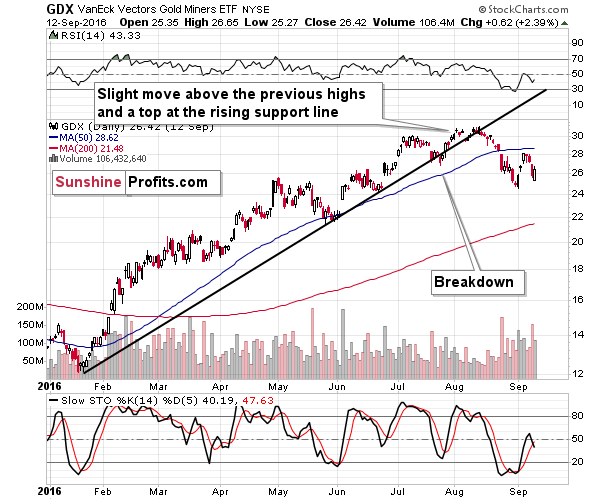
Well, shortly after the extremely-overbought reading, the GDX ETF moved lower and broke below the rising medium-term support line. It then moved back up and topped slightly above the previous highs. When the rising support line was more or less at the same price level as the previous high, GDX broke below it and formed a top that was not exceeded for a few years.
And what happened recently in the GDX?
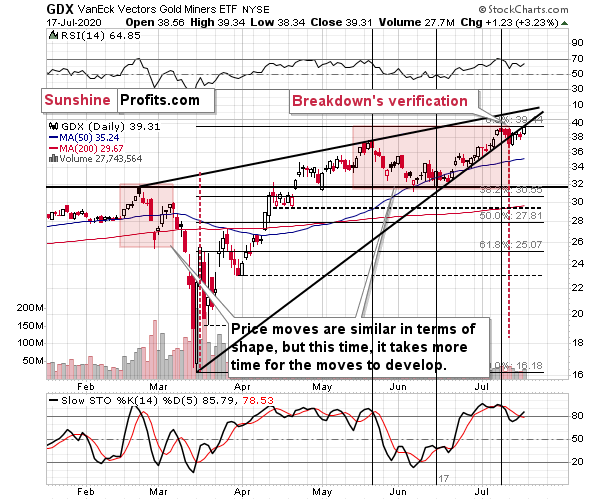
Pretty much the same thing. Shortly after we saw the extreme (100) reading from the Gold Miners Bullish Percent Index, GDX broke below its rising medium-term support line. It then moved back up, and while it didn't move to new intraday highs, Friday's closing price was slightly above the previous 2020 high.
The rising medium-term support line just moved to the previous high as well.
The history has been repeating to a very considerable (quite remarkable) extent, and if it continues to do so - which seems likely - we're likely to see a sizable decline shortly. In fact, Friday's high might have been the high for the next few months. If not, then such a high is very likely to form this week.
Today's Gold & Silver Trading Alert includes multiple additional details such as the interim target for gold that could be reached in the next few weeks. We invite you to subscribe and read today's issue right away.
Sincerely,
Przemyslaw Radomski, CFA
Editor-in-chief, Gold & Silver Fund Manager -
Gold Investment Update - The Little Known Gold Index Signal and Its Dramatic Consequences
July 13, 2020, 9:29 AMGiven how little it's used, Gold Miners Bullish Percent Index is an almost secret indicator, but that doesn't mean it's of little value to gold investors. Quite to the contrary.

As you can see, the miners just flashed an "extremely overbought" signal, which they had only flashed once in the past - almost right at the 2016 top.
The Gold Miners Bullish Percent Index recently moved to the highest level that it could reach - 100.
The only other case when the index was at 100, was in mid-2016.
We marked this situation with a vertical dashed line. Did miners continue to move higher for a long time, or did they move much higher? No.
Precisely, the index reached 100 on July 1st 2016, and gold mining stocks moved higher for two additional trading days. Then they topped. This was not the final top, but the second top took miners only about 5% above the initial July high.
This year, the index reached the 100 level on July 2nd - almost exactly 4 years later, and once again practically exactly in the middle of the year. Miners seemed to have formed the intraday high on July 9th - four trading days later.
It's not justified to assume that the delay in the exact top would be 100% identical, but it seems justified to view it as similar. Two-day delay then, and four-day delay now seem quite in tune, and this similarity supports a bearish forecast for gold.
There's also one additional point that we would like to emphasize and it's the previous high that the index made on November 9, 2010. That was the intraday top, so there was no additional delay. There was one additional high about a month later, in December, but miners moved only about 1.5% above the initial high then.
One might ask if mining stocks are really overbought right now given the unprecedented quantitative easing, and the answer is yes. Please note that in 2016 the world was also after three rounds of QE, which was also unprecedented, and it didn't prevent the miners to slide after becoming extremely overbought (with the index at the 100 level). The 100 level in the index reflects the excessive optimism, and markets will move from being extremely overbought to extremely oversold and vice versa regardless of how many QEs there are. People tend to go from the extreme fear to extreme greed and then the other way around, and no fundamental piece of news will change that in general. The economic circumstances change, but fear and greed remain embedded in human (and thus markets') behavior. Taking advantage of this cyclicality is the basis for most (if not all) trading tips for gold and other markets.
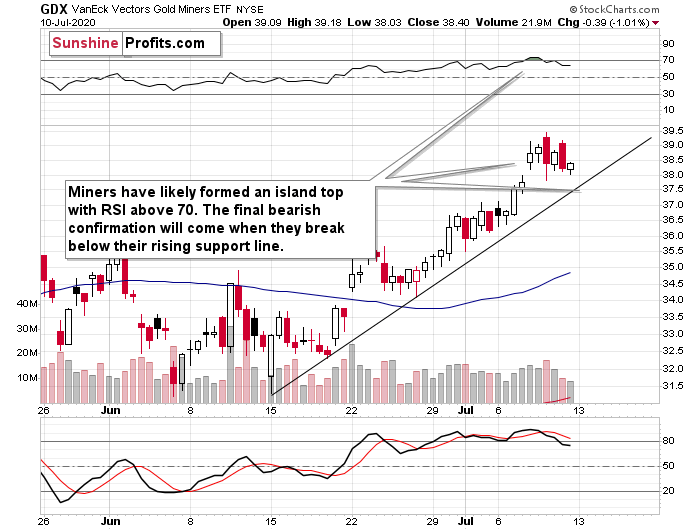
GDX's 4-hour candlestick chart shows that they were just very overbought also from the short-term point of view as the RSI indicator moved above 70. While it was in this sell-signal territory, miners were moving back and forth after a bullish price gap. Combination of both suggests that what we saw, was an island top formation. At this time, it's just a "potential" formation, because we won't know for certain until miners decline more and move below the $37.5 level. This level is important because it corresponds not only to the lower border of the price gap, but it's also where the rising support line currently is.
The strength of the support line - and thus importance of the potential breakdown below it - is further increased by what we see on GDX's daily chart.
That's actually the line that starts all the way at the March bottom. Breakdown below this line would open the door wide open to strong declines. Given the Gold Miners Bullish Percent Index's extreme overbought reading, the fall should be substantial.
Finally, we would like to show you something interesting that you almost certainly won't see anywhere else. The comparison between the performance of the Uber stock and the junior miners. Why would be compare them? Because they are both very highly correlated with the general stock market, but the shape in which they move relative to the general stock market (and to each other) is very specific. It can tell us in what stage of the move the market really is.
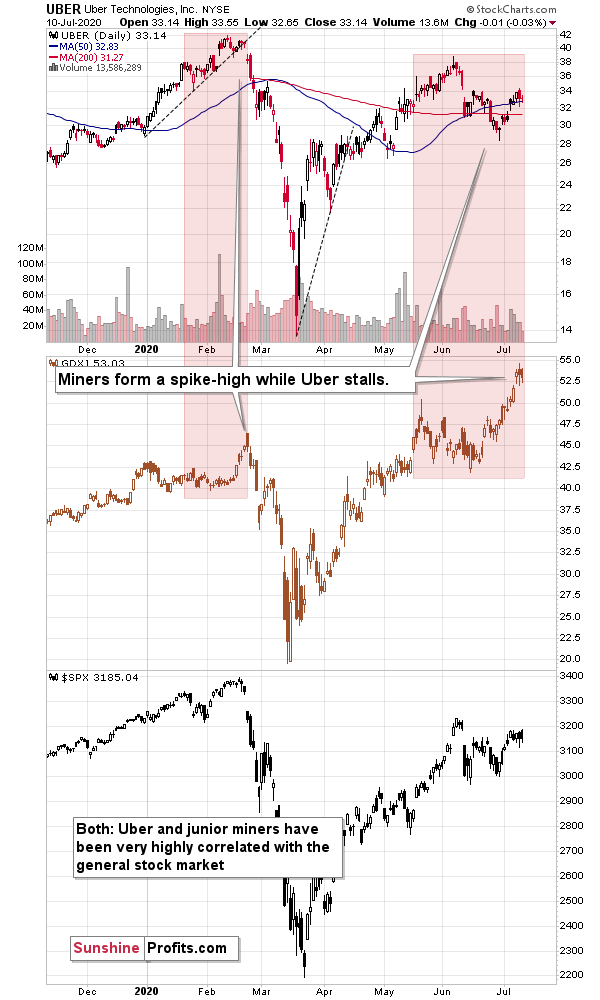
Uber is particularly interesting, because it's directly related to the current pandemic. When people are afraid of the coronavirus, they will think twice before using Uber's services. First, because they will prefer to stay home, and second because they will prefer to travel using more solitary means than by taking a cab, which was likely just used by someone else.
The thing is that Uber was early to disappoint and lag the market in March (underperforming the general stock market - please note how the final high in the S&P 500 didn't trigger an analogous move in the Uber stock), while the junior miners performed particularly well right before the top. The late-February spike was clearly visible.
Now, what's been taking place recently? The Uber stock is lagging, and it just failed to move to a new short-term high, while the S&P 500 did exactly that, and at the same time we see a sizable spike in the prices of junior miners. That's exactly what happened in February right before the slide.
This time, we also have bearish support from gold's long-term turning point, and we have miners which just showed an extremely overbought reading. The implications are very bearish.
Today's flagship Gold & Silver Trading Alert includes multiple additional details such as the interim target for gold that could be reached in the next few weeks. We invite you to subscribe and read today's issue right away.
Sincerely,
Przemyslaw Radomski, CFA
Editor-in-chief, Gold & Silver Fund Manager -
Gold Investment Update: The Bearish Combination of Soaring Silver and Lagging Miners
July 6, 2020, 10:17 AMSilver is moving up quite shortly today, which sounds bullish, until one realizes that silver tends to be particularly strong right before the precious metals market tops. And you know what's the other thing that quite often happens at the tops, in addition to silver's temporary strength? Miners tend to underperform. What did gold miners do on the last trading day of the previous week?
Miners reversed and ended the day over 1% lower, even though the GLD ETF ended the day slightly higher. Consequently, this piece of the puzzle seems to be in.
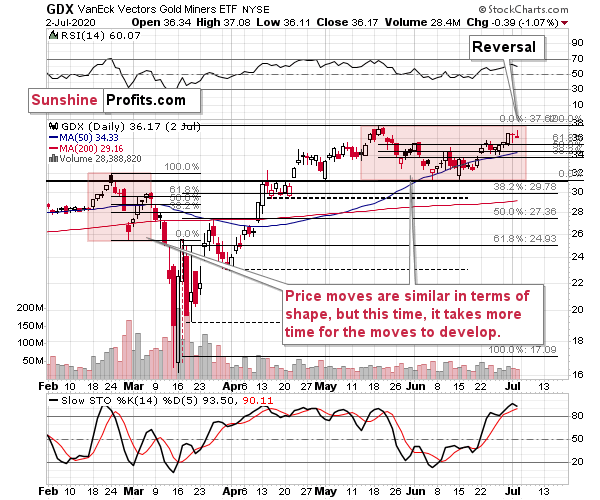
Remember when we wrote that the situation right now is similar to what happened in March, but this time it takes longer for everything to develop due to the change in market's perception of risk? To make a long story short, the March coronavirus panic was because the entire world was dealing with the unknown, which exacerbated the fear. Right now, the situation is worse, and it goes worse almost on a daily basis, but people are not as afraid. The economic implications don't appear so dire either. And it's definitely nothing unknown - we more or less know what to expect.
This means that we're likely to see a repeat of what we saw in March, we're likely to see it in "slow motion", at least for some time. Please note that even slow-motion mode of the mid-March plunge would still be very volatile.
The areas that we marked with red rectangles are similar in terms of shape, but the current one is about 4x longer. The previous pattern was characterized by a decline and a correction that took more or less the same time to complete. If we're about to see something similar also this time, then we can expect the top to be formed this week.
If the March decline took 5 trading days and the price moves are taking 4x as long this time, then perhaps we would see a monthly decline to the final lows instead of a weekly one. This would serve as a perfect "handle" for the massive, long-term "cup and handle" pattern in gold.
Today's relatively weak performance of the mining stocks seems to confirm the above. The implications for the next 1-6 weeks are bearish.
Today's flagship Gold & Silver Trading Alert includes multiple details, but most importantly, it includes the clear discussion of what will be the sign telling one that gold's move lower is almost certainly completely over. That's the detail, we think you might enjoy, want, and need right now.
Subscribe at a discount today and read today's issue ASAP.
Sincerely,
Przemyslaw Radomski, CFA
Editor-in-chief, Gold & Silver Fund Manager -
Gold Investment Update - New Covid-19 Highs, New Major Price Moves
June 29, 2020, 8:17 AMThe second wave of Covid-19 is here and while it makes gold's potential even better in the long run, it's likely to mean a sharp decline beforehand.
It might be tempting to focus on something else, to look the other way, or to limit testing, but the difficult fact is that the Covid-19 pandemic is developing after a several-week-long pause. There are new highs in the number of new daily cases both: globally, and in the U.S.
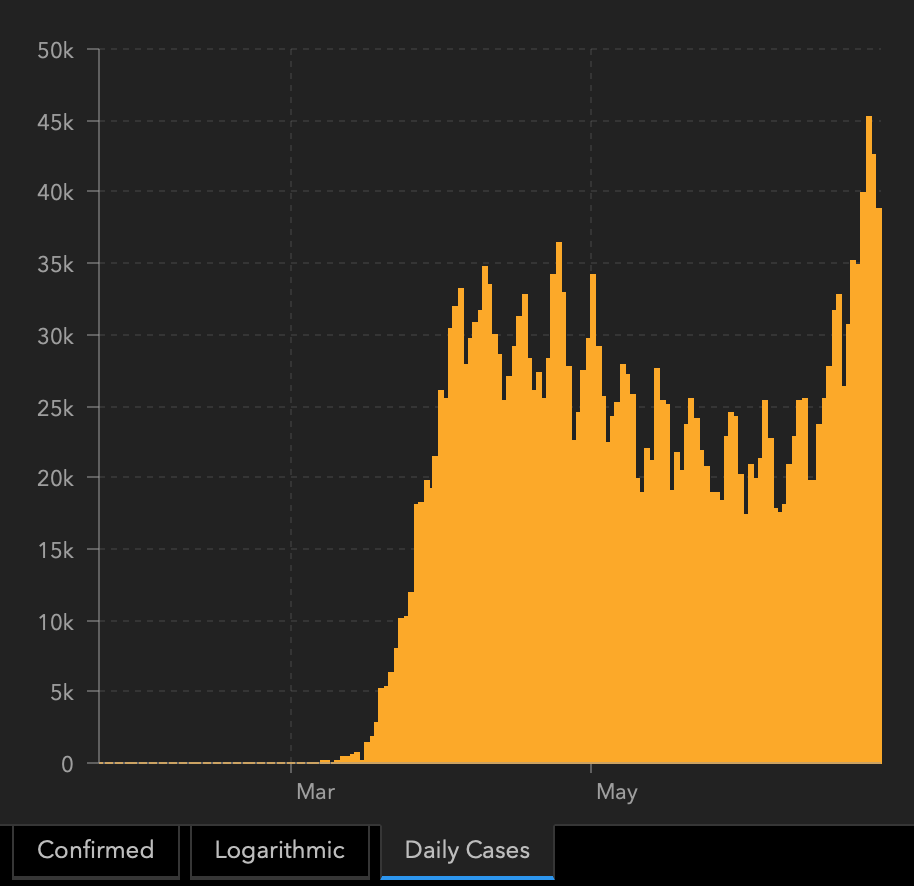
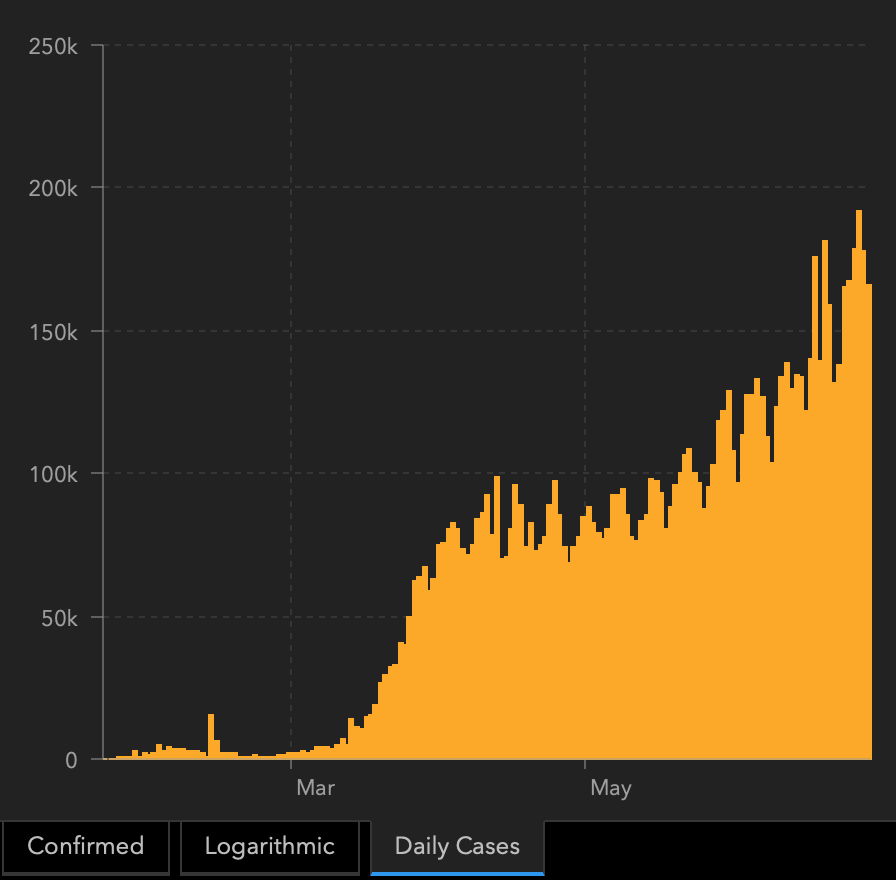
The second wave is not yet present in Europe, but please keep in mind that it could become a severe problem very fast. As the entire world has more and more coronavirus cases, and the economies are being reopened, it will be very hard to avoid the second wave in Europe.
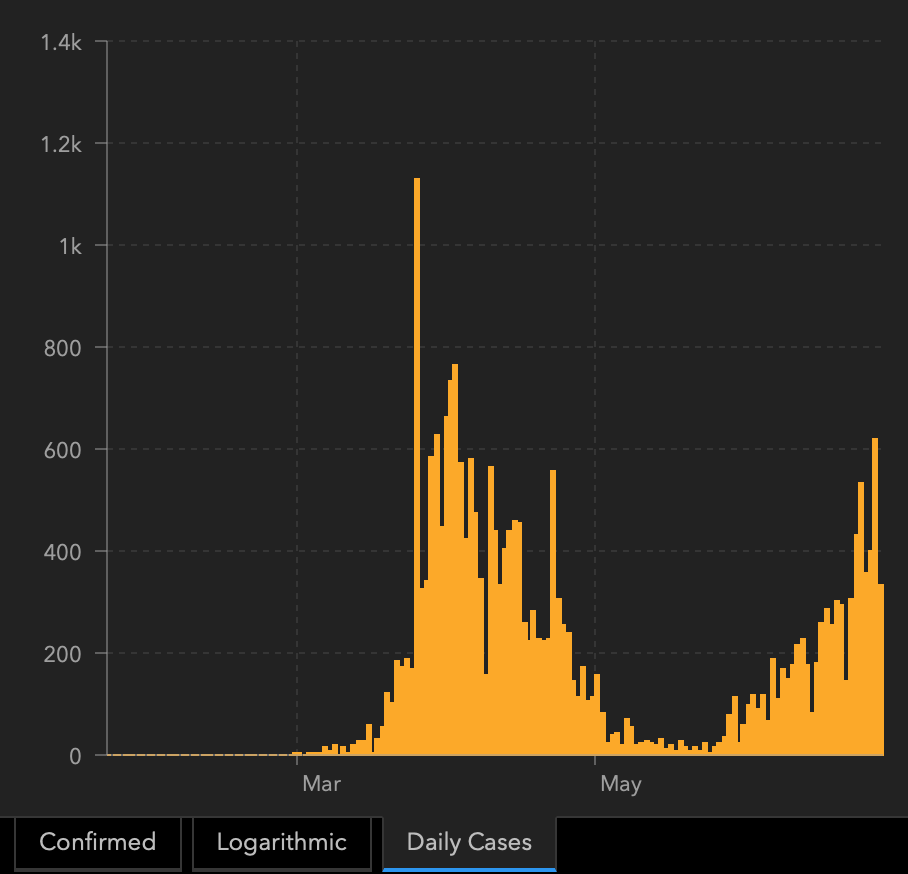
The new daily cases in Israel clearly show how a supposedly contained situation can easily get much worse in a relatively short period.
Why is this important from the gold investment and gold trading point of view? Because the markets appear to have viewed the March price moves as a one-time event triggered by also a one-time event. And the markets are just starting to wake up to the fact that it doesn't work this way at all.
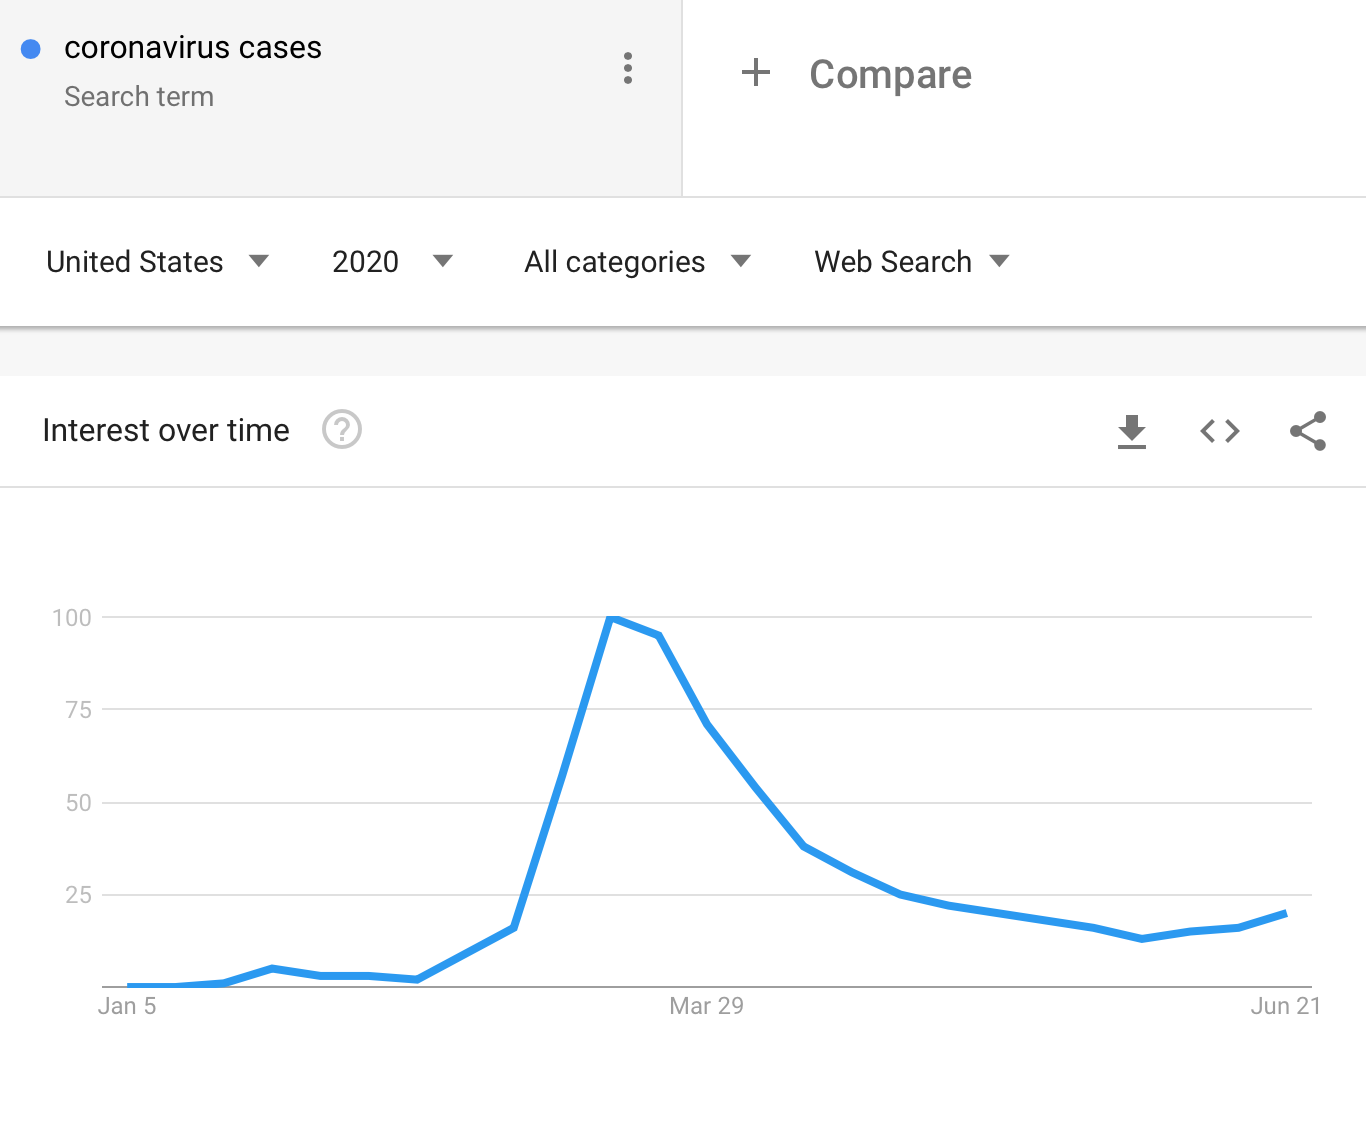
The number of searches for the "coronavirus cases" phrase in the U.S. is on the rise again, but it's not yet significantly higher than what we saw in mid-March. People are not yet panicking once again, but the trend is already in place.
The re-opening schedules are being canceled and some small lockdown measures are being introduced but their extent is not yet significant. People are already starting to get that they were way too optimistic regarding the recovery, but we are early in this process. The above search chart from Google Trends indicates that and performance of the general stock market confirms it.
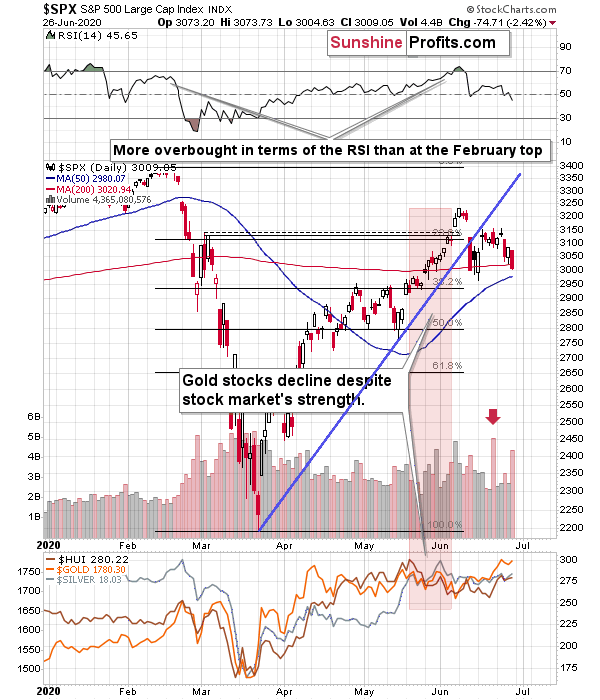
The huge volume on which the S&P 500 reversed on Friday was likely an indication of the change in the market sentiment, which is still remarkably positive compared to what's going on. It's as if we were not in the early part of the biggest economic disaster of the last several decades.
It seems that the markets will soon catch up to the (unfortunately - grim) reality and decline much more. In the early part of the move, the precious metals market is likely to decline, just like it had declined in the first half of March. It's likely to then rally more profoundly, and soar well above the 2011 highs, but it's unlikely to happen without a slide first.
The situation in the USD Index continues to support the bearish case in the next 1-3 weeks, but at the same time it also explains why gold hasn't plunge just yet.
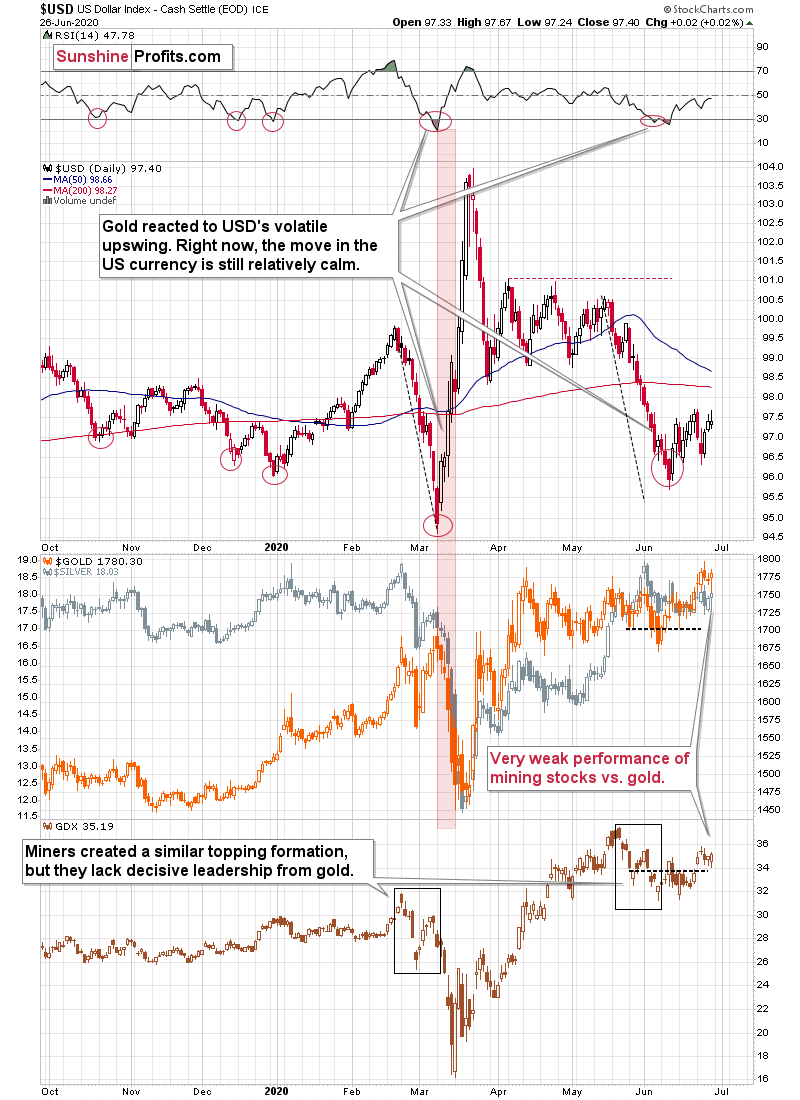
From the short-term point of view, the situation in the USD Index was very similar to what we saw in early March. At this time, it's clear that it's not 100% similar, but that there's a significant difference when it comes to timing and volatility. The situation is now developing less dynamically, as the authorities are reluctant to impose new lockdown measures, knowing how big declines in stocks followed, and gold was reacting primarily to the economic changes - people ran for the hills and then craved the safety of the U.S. dollar - at least initially. Right now, the situation is not yet critical in people's view, which is most likely why the USD Index is moving up in a steady manner instead of moving up sharply.
What is key here is that the situation can change quickly, just as it changed in March. Now the states are looking at each other and nobody wants to be the first to seriously limit the economic activity let alone force people to stay home. But as the cases grow to new highs, and as the number of deaths grow, people will likely get scared once again, and the more severe lockdown measures are likely to be re-introduced. That's when the USDX would be likely to soar with vengeance, and gold would be likely to slide - at least initially.
Technically, the USD index didn't manage to break above its mid-June highs and instead it reversed on both: Thursday and Friday. Consequently, many traders are likely viewing the June rally as a zigzag - a correction within a decline. We disagree with this interpretation, because of the favorable long-term chart, the similarity to what happened in February and March, and the way in which the new Covid-19 cases are growing in the U.S..
Summing up, the precious metals market is likely to decline in the short term (and only in the short term! gold is likely to soar in the following months!) along with the big decline in the stock prices and the decisive upswing in the USD Index. This is quite likely to correspond to renewed lockdown orders, which are just starting to emerge. Given how quickly the pandemic is developing, the above actions and price moves are likely just around the corner.
Today's flagship Gold & Silver Trading Alert includes multiple details, but most importantly, it includes the clear discussion of what will be the sign telling one that gold's move lower is almost certainly completely over. That's the detail, we think you might enjoy, want, and need right now.
Subscribe at a discount today and read today's issue ASAP.
Sincerely,
Przemyslaw Radomski, CFA
Editor-in-chief, Gold & Silver Fund Manager
Gold Alerts
More-
Status
New 2024 Lows in Miners, New Highs in The USD Index
January 17, 2024, 12:19 PM -
Status
Soaring USD is SO Unsurprising – And SO Full of Implications
January 16, 2024, 8:40 AM -
Status
Rare Opportunity in Rare Earth Minerals?
January 15, 2024, 2:06 PM
Dear Sunshine Profits,


