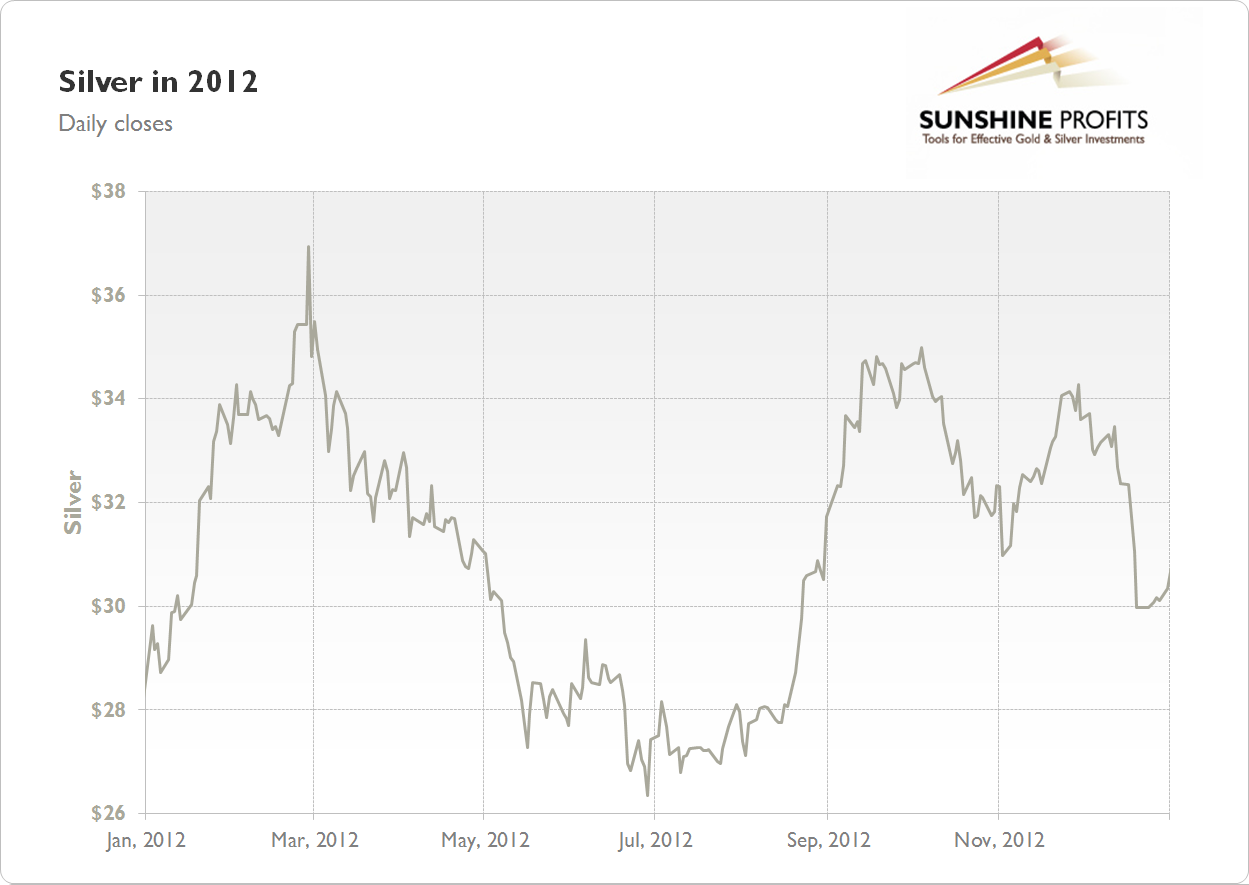
Silver Chart 2012

(clicking on the chart will expand it)
Silver price chart for 2012 shows that silver was gaining in the first two months of the year. The yearly high was formed on February 28 at $36.93. Then it was declining for four months. The yearly low was formed on June 28 at $26.35. In August-September silver was retracing its earlier move down. Overall, silver gained $2.56 (9.22%) in 2012. The final close of the year was $30.34.
| Similiar charts | |
|---|---|
| Silver Chart 2013 | Silver Chart 2011 |
| Gold Chart 2012 | Gold Stock Chart 2012 |
Gold Alerts
More-
Status
New 2024 Lows in Miners, New Highs in The USD Index
January 17, 2024, 12:19 PM -
Status
Soaring USD is SO Unsurprising – And SO Full of Implications
January 16, 2024, 8:40 AM -
Status
Rare Opportunity in Rare Earth Minerals?
January 15, 2024, 2:06 PM
Recent
More- May 4, 2021, 6:54 AM Mushrooms in the Park?
- April 11, 2021, 12:24 PM Your Week In Brief
- March 12, 2021, 11:28 AM Dear Bill Gates, Please Stop Commenting about Bitcoin


