Silver Chart 2015

(clicking on the chart will expand it)
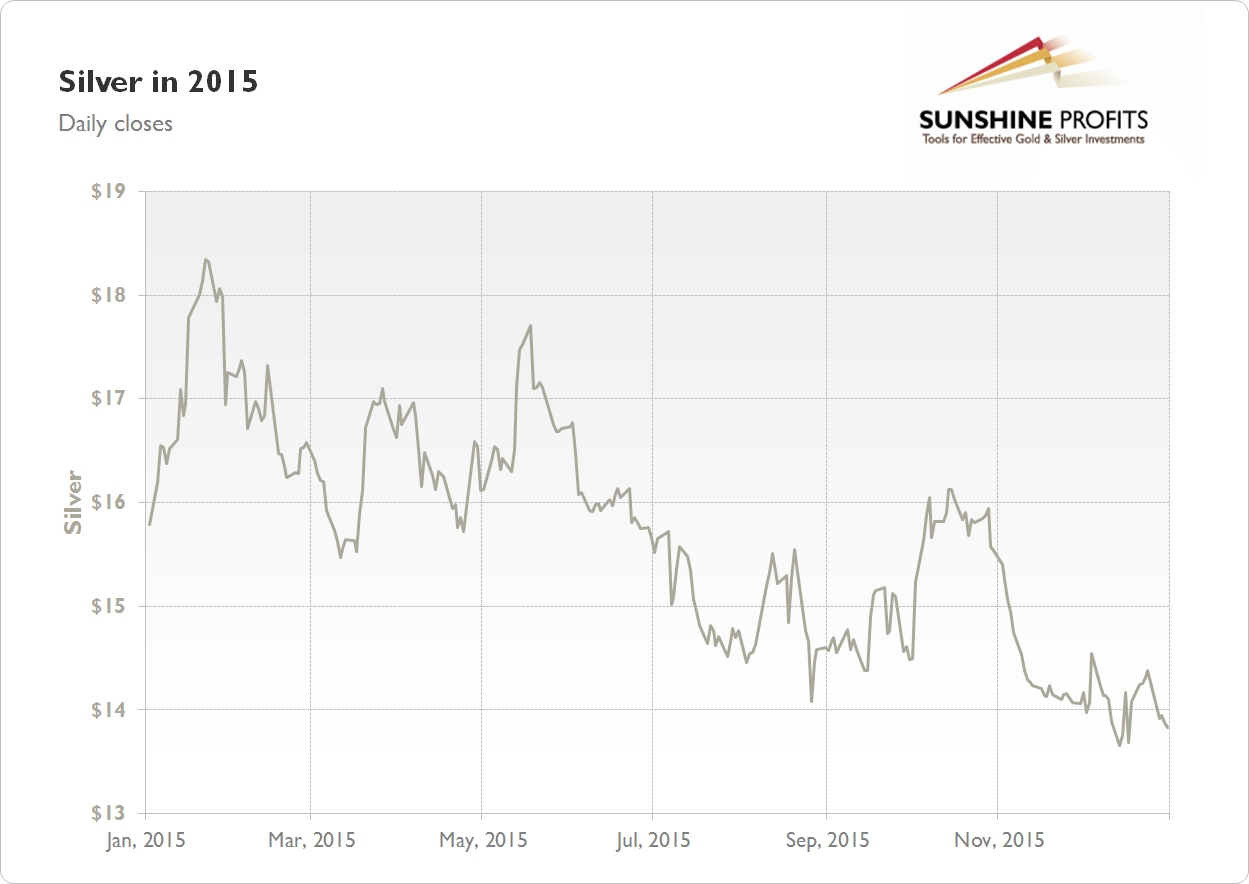
Silver price chart for 2015 shows that in the first half of the year silver was fluctuating along the level of $17. In June-December it was gradually declining. The yearly high was formed on January 22 at $18.34, and the yearly low was formed on December 14 at $13.65. The final close of the year was $13.825. Overall, silver lost $1.775 (11.38%) in 2015.
| Similiar charts | |
|---|---|
| Silver Chart 2016 | Silver Chart 2014 |
| Gold Chart 2015 | Gold Stock Chart 2015 |
Gold Alerts
More-
Status
New 2024 Lows in Miners, New Highs in The USD Index
January 17, 2024, 12:19 PM -
Status
Soaring USD is SO Unsurprising – And SO Full of Implications
January 16, 2024, 8:40 AM -
Status
Rare Opportunity in Rare Earth Minerals?
January 15, 2024, 2:06 PM
Recent
More- May 4, 2021, 6:54 AM Mushrooms in the Park?
- April 11, 2021, 12:24 PM Your Week In Brief
- March 12, 2021, 11:28 AM Dear Bill Gates, Please Stop Commenting about Bitcoin


