
tools spotlight

-
Soaring Juniors and Soaring Excitement – What’s Next?
June 3, 2022, 5:35 AMIn yesterday’s analysis, I wrote that there will be no regular Alert today, but I think that you’d still appreciate at least some information, as PMs moved higher yesterday.
In short, what I wrote in yesterday’s intraday Gold & Silver Trading Alert remains up-to-date. Quoting:
Just a quick note as things are moving quite fast in the PMs.
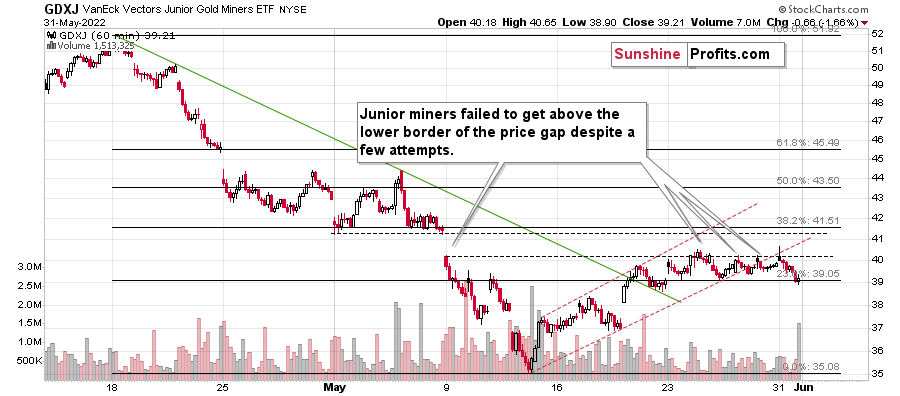
The GDXJ moved sharply higher after the session started, and at the moment of writing these words, it moved to the upper border of the previous, early-May price gap. Please note that it was my original target for the previous long positions, and it was just reached.
It doesn’t change the outlook here. When we took profits from the long positions and re-entered short ones, I wrote that we are doing so, not because it was clear that the top was in, but because the risk to reward ratio changed dramatically. And that was indeed case. The fact that juniors rallied today doesn’t change it. In my view it was a good decision to switch the positions then based on the data that we had at that time.
Anyway, the medium-term trend remains down, and it seems that we’ll see another – very powerful – downswing shortly.
As always, we’ll keep you - our subscribers - informed.
Let’s take a look at the chart for details.
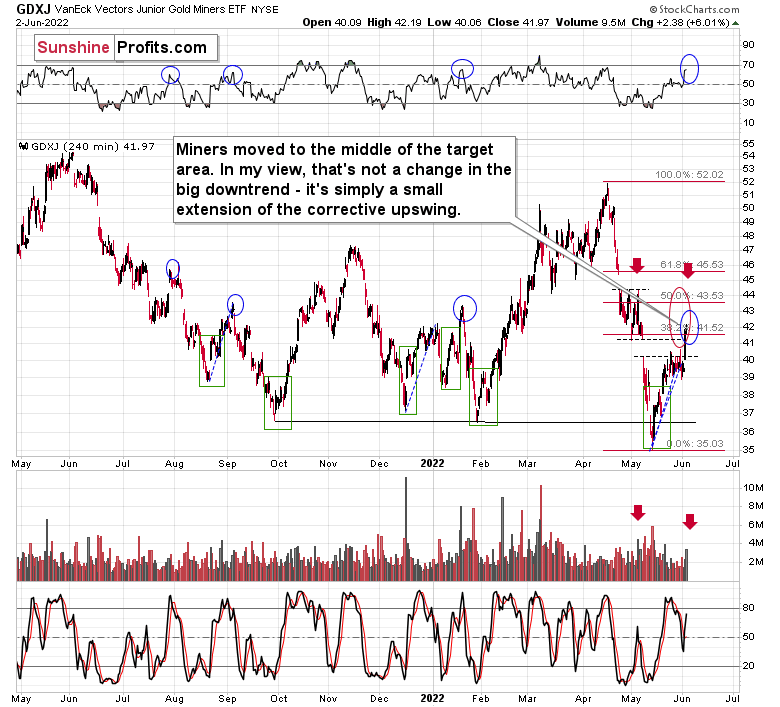
The price of the GDXJ ETF – proxy for junior miners – moved sharply higher yesterday, and this got many people excited. High volume confirms that. It’s natural for most investors and traders to view rallies as bullish, but let’s keep in mind that most traders tend to lose money… It’s not that simple. After all, the best shorting opportunities are at the tops, which – by definition – can only be formed after a rally.
The particularly interesting thing about high volume readings in the GDXJ ETF is that they quite often mark local tops. Remember the late-April – early-May consolidation? It ended when GDXJ finally rallied on high volume. That was the perfect shorting opportunity, not a moment to panic and exit the short position.
The GDXJ-based RSI indicator is also quite informative right now. It moved well above 50, but it’s not at 70 yet. Why would that be important? Because that’s when many of the previous corrections ended.
And when one digs deeper, things get even more interesting. You see, when we consider corrections that started after RSI was very oversold (after forming a double bottom below 30), it turns out that in all those cases the tops formed with RSI between 50 and 70. I marked those situations with blue ellipses on the above chart.
So, while it’s easy to “follow the action”, it’s usually the case that remaining calm and analytical leads to bigger profits in the end.
Also, let’s use yesterday’s move as something useful. If this single-day move higher made you really uncomfortable and almost made you run for the hills, it might be a sign that the size of the position that you have is too big. It’s your capital and you can do with it what you wish, but if the above was the case, it might serve as a food for thought.
The big trend (as well as the reasons for it) remains down, which means that the enormous profit potential remains intact.
Thank you for reading our free analysis today. Please note that the above is just a small fraction of the full analyses that our subscribers enjoy on a regular basis. They include multiple premium details such as the interim targets for gold and mining stocks that could be reached in the next few weeks. We invite you to subscribe now and read today’s issue right away.
Sincerely,
Przemyslaw Radomski, CFA
Founder, Editor-in-chief -
The USD Index Rose, but Gold Didn’t React. What Does That Mean?
June 2, 2022, 10:11 AMPractically nothing changed on the technical side of things in the precious metals market yesterday or in today’s pre-market trading, so everything that I wrote yesterday remains up-to-date.
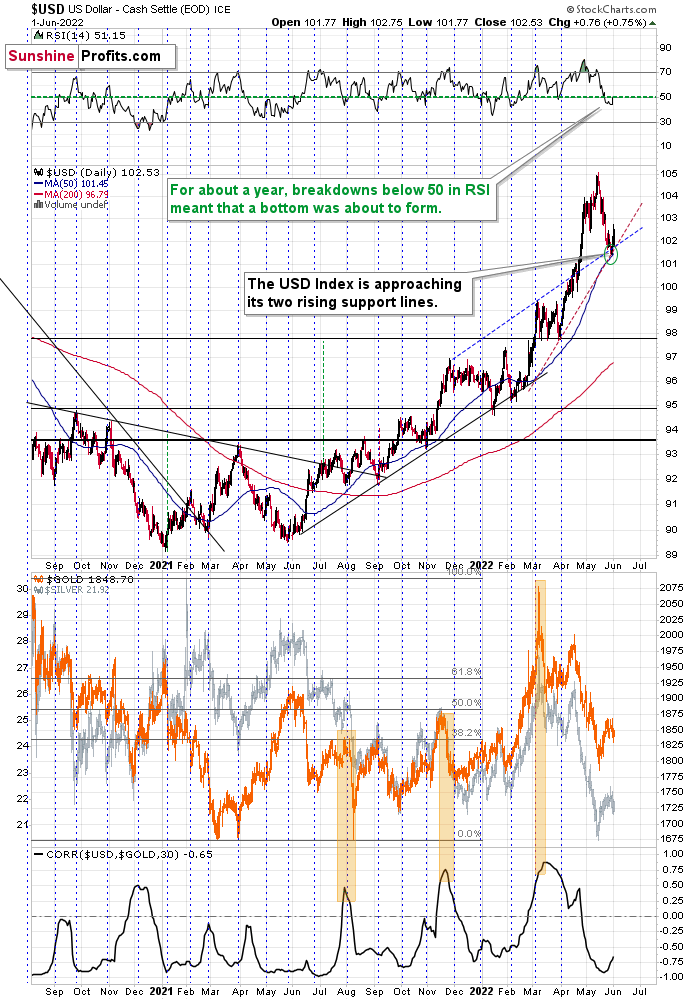
In particular, the USD Index rallied from my previous downside target area.
Gold, however, didn’t respond by declining. Why would that be the case? Does it mean that gold is showing strength here and thus we just got a bullish indication?
No. It’s not that simple.
You see, the USD Index is an… index.
It’s a weighted average of currency exchange rates, and the EUR/USD exchange rate has the biggest (57.6%) weight. The purpose of the USD Index is to isolate the strength of the U.S. currency so that it’s clear what’s going on in it. However, this is not a perfect way to measure it (there is no perfect way to do it, they all have their flaws).
The assumption here is that what happens in all those other monetary areas (Eurozone, Japan, etc.) will average itself out and we’ll be left with the USD’s “value changes”, which is what’s taking place most of the time.
However, not always, and yesterday was one of those “other” days.
I’ll elaborate a bit later, but in short, the Eurozone inflation numbers came in and they were terrible. Inflation once again soared. Greater than expected inflation means that the euros are worth less than they used to be and that their value has declined more than was previously expected. In other words, the “value of the euro” declined.
If the value of the euro declined, what would happen to the EUR/USD exchange rate? Of course, it declines too. How does it impact the USD Index (because it’s definitely going to have an impact, since most of the index is about the EUR/USD)? Of course, the USD Index would be likely to rally based on the above.
So, did gold show strength by not declining yesterday, despite the USD Index’s strength? No, because it was not the U.S. dollar that was strong – it was the euro that was weak. As a consequence, what we saw yesterday was not a bullish sign for the precious metals market.
What does it mean for us and our short position in the junior mining stocks? In short, it means nothing. Yesterday’s session was an “exception” from the rule that usually remains intact, and we don’t have to worry about it.
The medium-term downtrend remains intact. The USD Index is likely to move higher and (most importantly), real interest rates are going higher. It’s likely to be a global phenomenon, but it seems that they are likely to rally faster in the U.S. than in the Eurozone. This is a profoundly bearish combination for the precious metals sector in the medium term.
All in all, it seems that we’re about to see another sizable decline in the prices of junior mining stocks, and while I can’t promise any performance, it seems likely to me that profits on our short positions will increase substantially.
Having said that, let’s take a look at the markets from a more fundamental point of view.
The Canary
With unanchored inflation still rattling the financial markets, prayers for peaks have gone unanswered in recent weeks. Moreover, with Eurozone inflation hitting another 2022 high on May 31, the timeline for normalization continues to lengthen. For context, the figures in the middle column were economists’ consensus estimates.
Please see below:
 Source: Investing.com
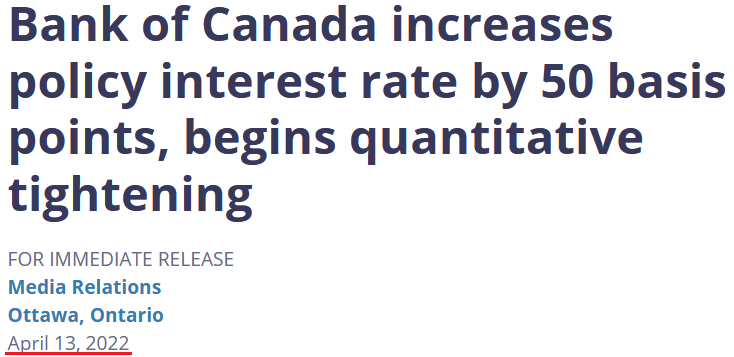
However, the more important development came from the Bank of Canada (BoC) on June 1. With 1970s/1980s-like inflation a global phenomenon, I warned on Apr. 14 that the BoC is the canary in the coal mine for future Fed policy. I wrote:
The Bank of Canada (BoC) announced a 50 basis point rate hike on Apr. 13. With the Fed likely to follow suit in May, the domestic fundamental environment confronting the PMs couldn’t be more bearish.
Please see below:
 Source: BoC
Moreover, BoC Governor Tiff Macklem (Canada's Jerome Powell) said that "We are committed to using our policy interest rate to return inflation to target and will do so forcefully if needed."
Furthermore, while he added that the BoC could "pause our tightening" if inflation subsides, he cautioned that "we may need to take rates modestly above neutral for a period to bring demand and supply back into balance and inflation back to target."
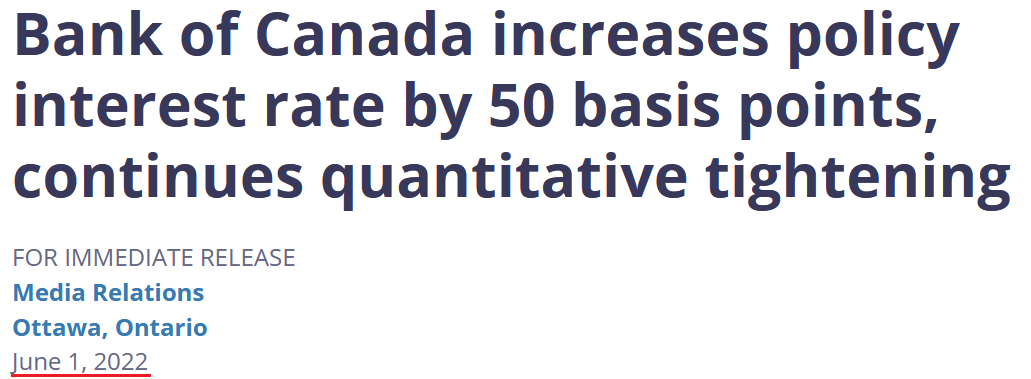
However, with the latter much more likely than the former, the BoC's decision is likely a preview of what the Fed should deliver in the months ahead.
To that point, the Fed hiked interest rates by 50 basis points in May, and the BoC increased its overnight lending rate by another 50 basis points on Jun. 1. As a result, the North American connection should hold firm.
Please see below:
 Source: BoC
In addition, the BoC release stated:
“With the economy in excess demand, and inflation persisting well above target and expected to move higher in the near term, the Governing Council continues to judge that interest rates will need to rise further. The policy interest rate remains the Bank’s primary monetary policy instrument, with quantitative tightening acting as a complementary tool.”
“The pace of further increases in the policy rate will be guided by the Bank’s ongoing assessment of the economy and inflation, and the Governing Council is prepared to act more forcefully if needed to meet its commitment to achieve the 2% inflation target.”
Thus, with inflationary realities forcing hawkish central bank responses, more pain should confront the financial markets as the drama unfolds.
To that point, St. Louis Fed President James Bullard said on Jun. 1: "The current U.S. macroeconomic situation is straining the Fed's credibility with respect to its inflation target." As such, he reiterated his call for a 3.5% U.S. federal funds rate by the end of 2022.
Please see below:
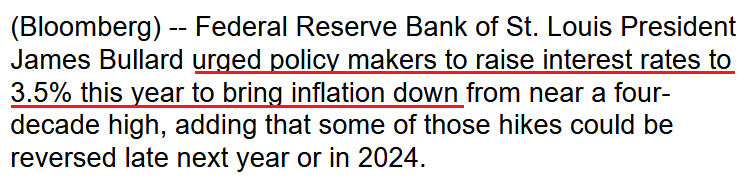 Source: Bloomberg
Likewise, San Francisco Fed President Mary Daly said on Jun. 1 that there must be material progress on inflation before the central bank can slow its roll.
“We aren’t really there yet, so we need to see those data on a slowing economy bringing demand and supply back in balance, and I need to see some real progress on inflation,” she said.”
She added:
“I don’t meet anyone, contacts, consumers, anyone, who thinks the economy needs help from the Fed right now. I certainly am comfortable to do what it takes to get inflation trending down to the level we need it to be. I really think these inflation numbers have been going on too long, and consumers, businesses and everyday Americans are depending on us to get inflation back down and bridling it.”
As a result:
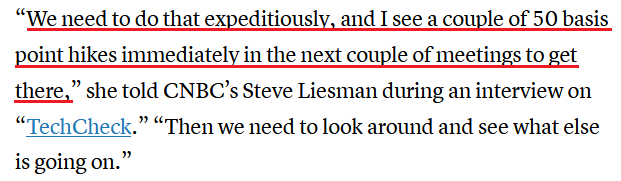 Source: CNBC
Thus, while the Fed remains focused on taming inflation, the reality is that more hawkish drama should unfold over the medium term. For example, the Fed released its latest Beige Book on Jun. 1. For context, the report consolidates the economic data from all of the regional Federal Reserve banks.
The growth outlook was decent:
“All twelve Federal Reserve Districts have reported continued economic growth since the prior Beige Book period, with a majority indicating slight or modest growth; four Districts indicated moderate growth. Four Districts explicitly noted that the pace of growth had slowed since the prior period.”
The labor market outlook was relatively better:
“Most Districts reported that employment rose modestly or moderately in a labor market that all Districts described as tight. One District explicitly reported that the pace of job growth had slowed, but some firms in most of the coastal Districts noted hiring freezes or other signs that market tightness had begun to ease. However, worker shortages continued to force many firms to operate below capacity.”
And pricing pressures remain “robust:”
 Source: U.S. Fed
Likewise, S&P Global released its U.S. Manufacturing PMI on Jun. 1. The report revealed:
“New orders rose sharply in May, with higher new sales inflows often attributed to a sustained rise in customer demand and the acquisition of new clients. That said, the pace of growth softened further from March's recent peak and was the slowest seen since January.”
More importantly:
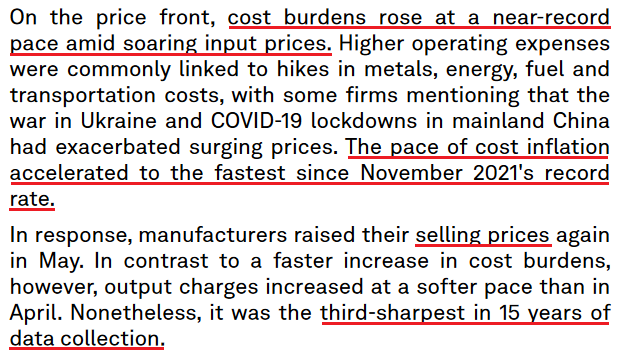 Source: S&P Global
As a result, while some data points show record inflation and others show “robust price increases” with some moderation, the important point is that the Fed’s war with inflation will be one of attrition. To explain, I wrote on May 24:
It’s ironic how the permabears hope for a recession so that the stock market will crash and the permabulls hope for a recession so that the stock market will rally. Confused? Well, the reality is that collapsing inflation allows the Fed to perform a dovish 180 and follow the post-GFC script. Therefore, the ‘bad news is good news’ mantra will likely benefit the bulls.
Conversely, the longer inflation persists, the longer the Fed stays on the sidelines. Thus, simmering inflation and resilient consumer spending should keep the Fed on a hawkish warpath, which is bearish for the S&P 500 and the PMs.
Again, macroeconomic data declining from all-time highs represents normalization, not a crisis. Moreover, what did investors think would happen when the Fed started hiking interest rates? Of course, economic momentum would moderate. However, with a huge gap between 8%+ annualized inflation and the Fed’s 2% goal, more rate hikes are needed to alleviate the pricing pressures.
Therefore, the newest narrative is that a faltering U.S. labor market could provide dovish cover for the Fed. I added on May 24 that the permabull prayer looks like this:
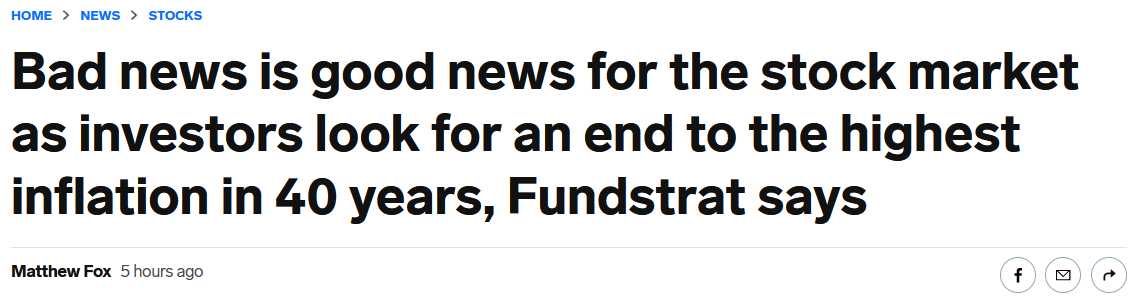 Source: Business Insider
Fundstrat founder Tom Lee said:
"Incoming data could show the labor market weakening... and thus [the] job market could be cooling at a pace faster than implied by tighter financial conditions." Moreover, “layoffs are accelerating, hitting 7,700 so far in May....We expect this to soon go parabolic, based upon anecdotal comments we have heard.”
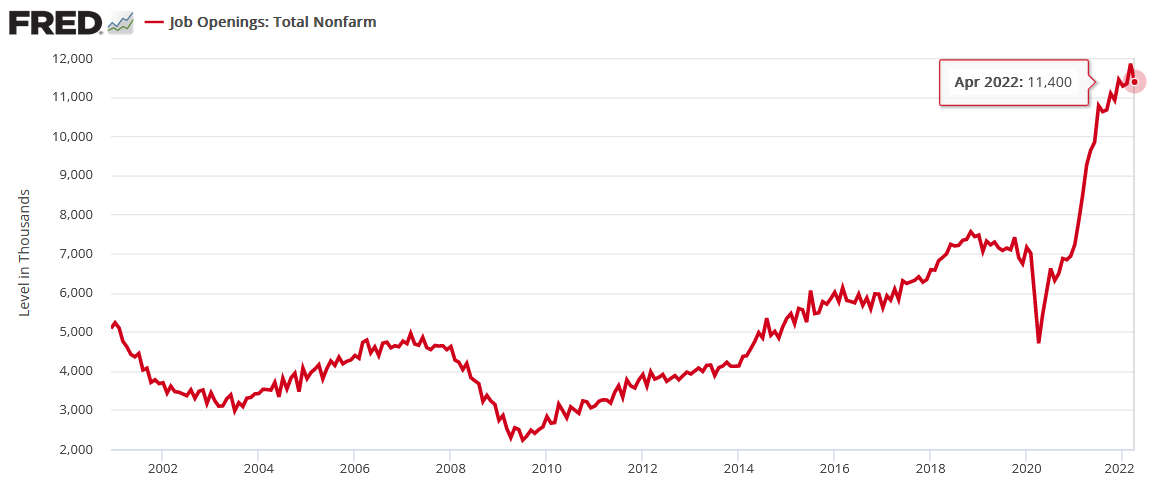
In contrast, the U.S. Bureau of Labor Statistics (BLS) released its JOLTS jobs report on Jun. 1. For the sake of objectivity, U.S. job openings declined from their all-time high of 11.855 million in March to 11.400 million in April. Also, the April data lags by two months, so it’s not real-time.
However, does it look like the U.S. labor market is moderating at a pace that will cool inflation anytime soon?
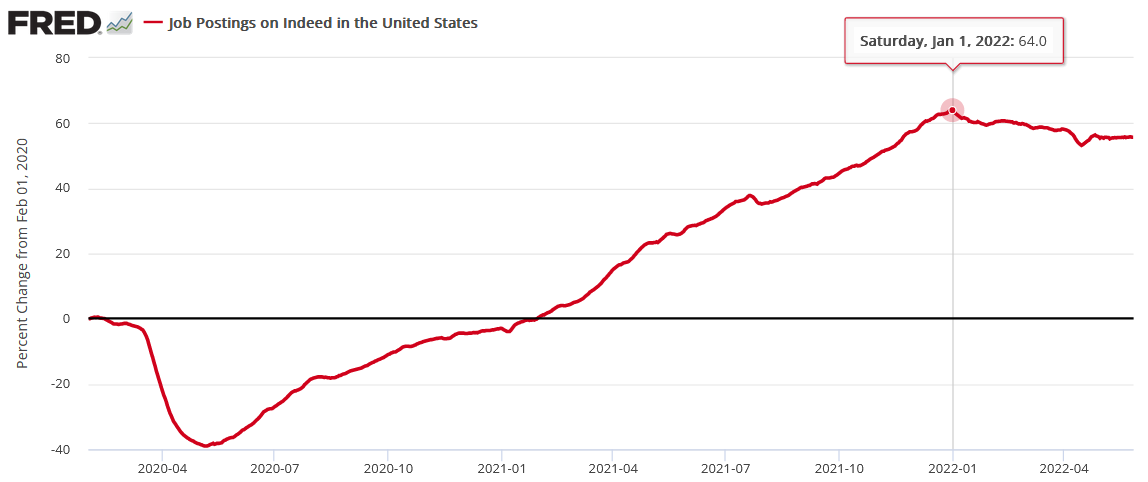
Second, Indeed releases its job openings data weekly, with the latest update on Jun. 1. Moreover, while postings have declined from their all-time high, they remain elevated and have held steady in recent weeks.
Please see below:
Third, the BLS’ JOLTS report stated:
“In April, the number of layoffs and discharges edged down to a series low of 1.2 million (-170,000). The rate was little changed, at 0.8 percent. Layoffs and discharges decreased in professional and business services (-133,000).”
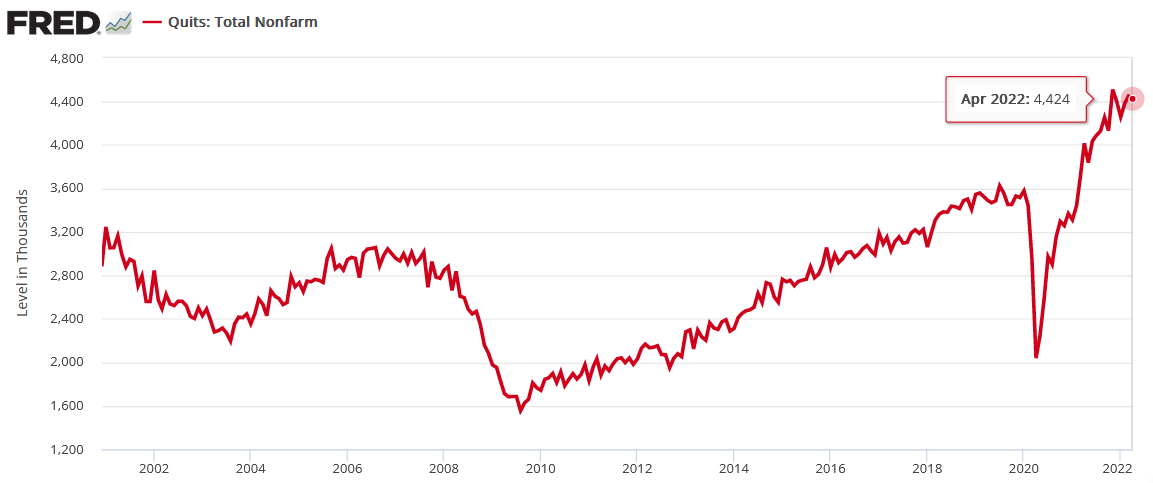
Likewise, Americans are still quitting their jobs at unprecedented rates. For context, the BLS states: “Quits are generally voluntary separations initiated by the employee. Therefore, the quits rate can serve as a measure of workers’ willingness or ability to leave jobs.”
As a result, does it seem like Americans fear unemployment?
Fourth, and most importantly, S&P Global released its U.S. Composite PMI on May 24. For context, the data was collected from May 12-23 and includes responses from “around 800” manufacturing and service sector companies in the U.S. An excerpt stated that they added employees “at the fastest pace for 13 months.”
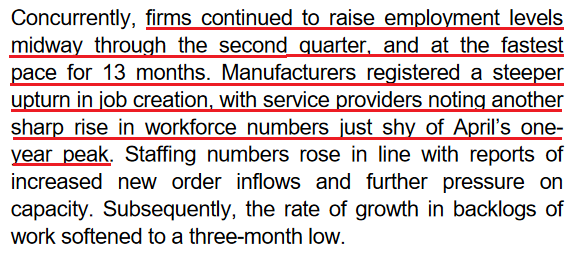 Source: S&P Global
The bottom line? The Fed remains materially behind the inflation curve, and nearly 70 years of history shows that the U.S. federal funds rate needs to rise above the annualized inflation rate to curb price pressures. Therefore, curing 8%+ inflation with a couple of rate hikes is unrealistic, and investors should learn this lesson the hard way over the medium term. As a result, more downside should confront the S&P 500 and the PMs over the next few months.
In conclusion, the PMs rallied on Jun. 1, as they sidestepped Wall Street’s negativity. However, the thesis remains unchanged: the U.S. 10-year real yield is still at 0.26% and needs to rise to calm inflation. Moreover, a hawkish Fed is bullish for the USD Index, and U.S. Treasury yields are also rallying once again. Therefore, the PMs should feel the fundamental heat this summer.
Thank you for reading our free analysis today. Please note that the above is just a small fraction of the full analyses that our subscribers enjoy on a regular basis. They include multiple premium details such as the interim targets for gold and mining stocks that could be reached in the next few weeks. We invite you to subscribe now and read today’s issue right away.
Sincerely,
Przemyslaw Radomski, CFA
Founder, Editor-in-chief -
Fakeout Instead of Breakout: Is the Gold Miners’ Crash Coming?
June 1, 2022, 9:41 AMSome analogies in the gold market that may be a hint for investors can be seen right now. If there's a 2008 rerun, what could that mean in the near term?
The precious metals market declined yesterday, and while the move is still small, it’s nice to see that our short positions in juniors are already profitable.
Something quite interesting happened in their price movement at the beginning of yesterday’s session, and that’s what I’d like to start with today.
Juniors tried to rally above their recent highs and resistance levels, but failed. They formed an hourly reversal candlestick and then declined in the following part of the session.
What was “supposed” to be a breakout turned out to be a fakeout, and lower values followed. This is bearish, and it tells us that taking profits from our previous long positions in the junior miners several days ago was likely a great idea.
To clarify, the above is bearish only for the very short term. It doesn’t tell us much about the bigger picture. So let’s zoom out. Significantly.
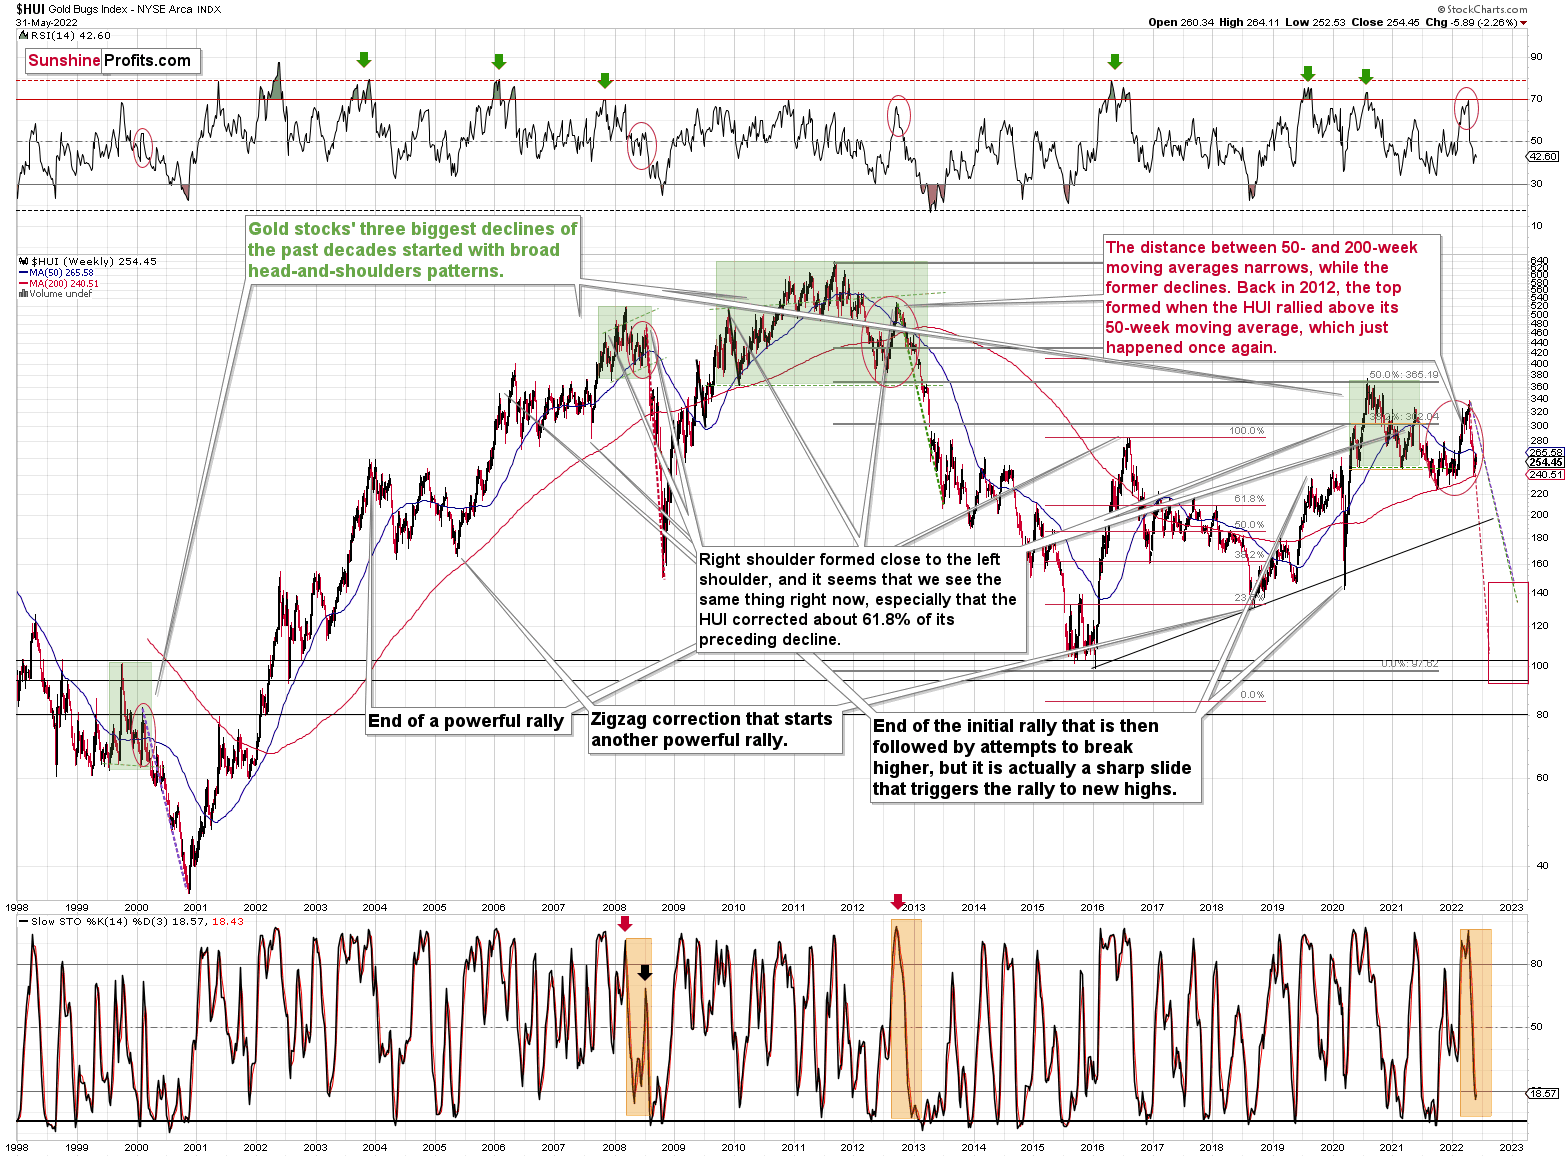
There are quite a few analogies between now and 2012, and I described them in the huge last Friday’s analysis. However, there are also signs that what we’re seeing is actually similar to what happened in 2008. I also described some of them on Friday, but the one that I would like to emphasize today is already visible on the chart above.
Namely, gold stocks declined practically just as rapidly as they did in 2008. Here’s the really interesting part: they corrected after moving close to their 200-week moving average – just like what we saw in 2008. This red line triggered corrections in both cases. They were not huge, but notable from the short-term point of view.
You know how much the HUI Index declined before this correction (between the July 2008 top and the August 2008 bottom)?
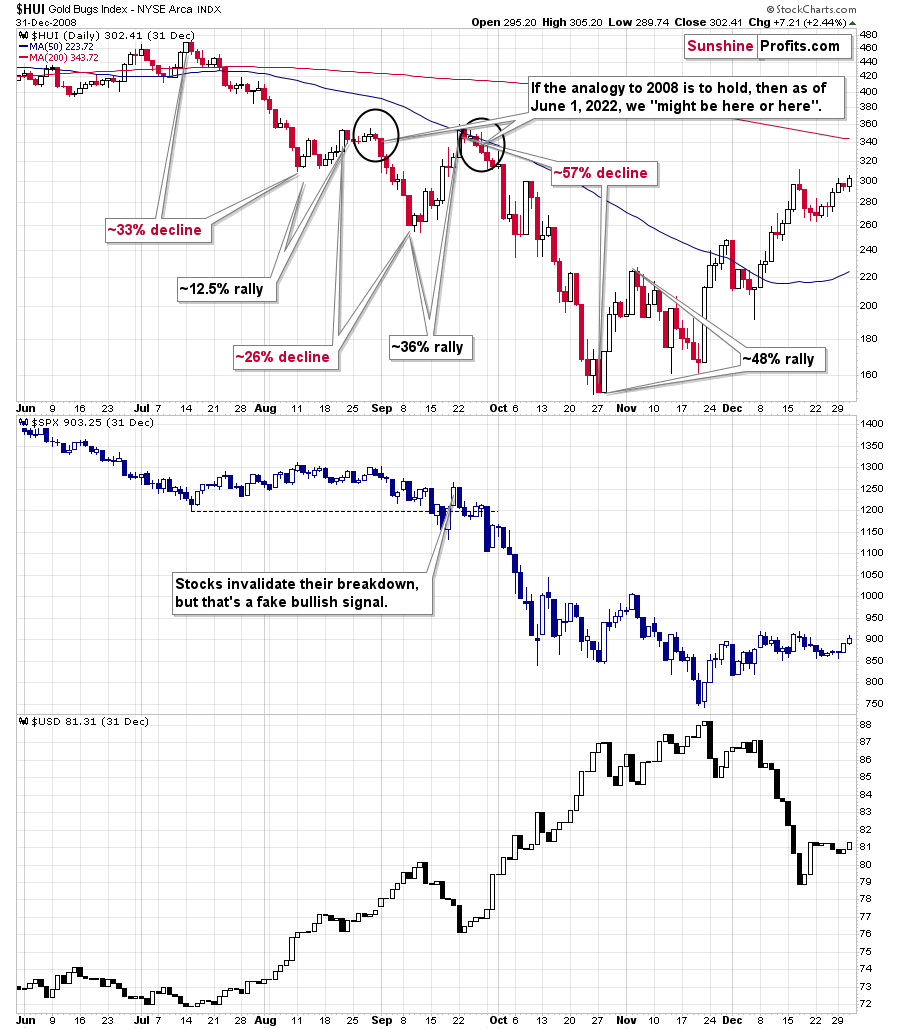
About 33%.
The decline in the HUI Index that we saw between April and May took it about 27% lower.
Not identical, but very similar.
And the recent correction? The HUI moved up around 8% higher in terms of closing prices and about 11% higher. Back in 2008, the analogous rally took the HUI about 12.5% higher.
Once again: not identical, but similar. Things are just a little less extreme this year.
If this similarity is to continue, then we can expect another mover lower to materialize shortly. Well, that’s what we already knew based on other indications, but what the above analogy also tells us is that the HUI Index could decline significantly once again. Back in 2008, it declined by about 26%, which was a little less than before the consolidation.
Please keep in mind that history tends to rhyme, not repeat itself to the letter. So, the above doesn’t imply that the HUI now has to decline by exactly 26%. It does tell us, however, that mining stocks can be expected to decline by as much (approximately!) as they did before correcting, and that’s an important clue.
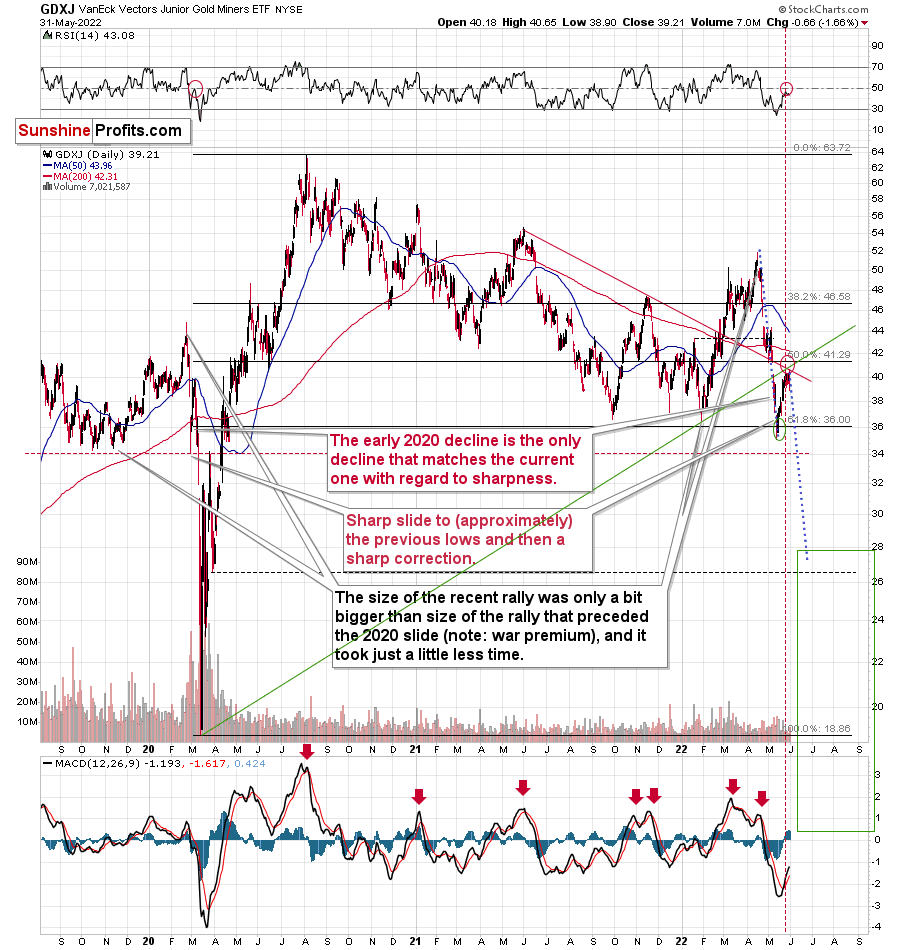
If the GDXJ declines by as much as it did before correcting, it will move slightly below $28. The nearby support is provided by the previous low (dashed line, slightly below $27). While it’s unclear if it moves below $27 or not – before correcting – it’s very likely that we’ll see a huge decline below $30, and that the profits on our short positions are likely to increase significantly.
Is the very short-term top in? That appears likely, though it’s not 100% certain. The GDXJ appears to have topped in the lower part of my target area, and the same goes for the RSI (which might have topped close to 50, just like it did in early 2020).
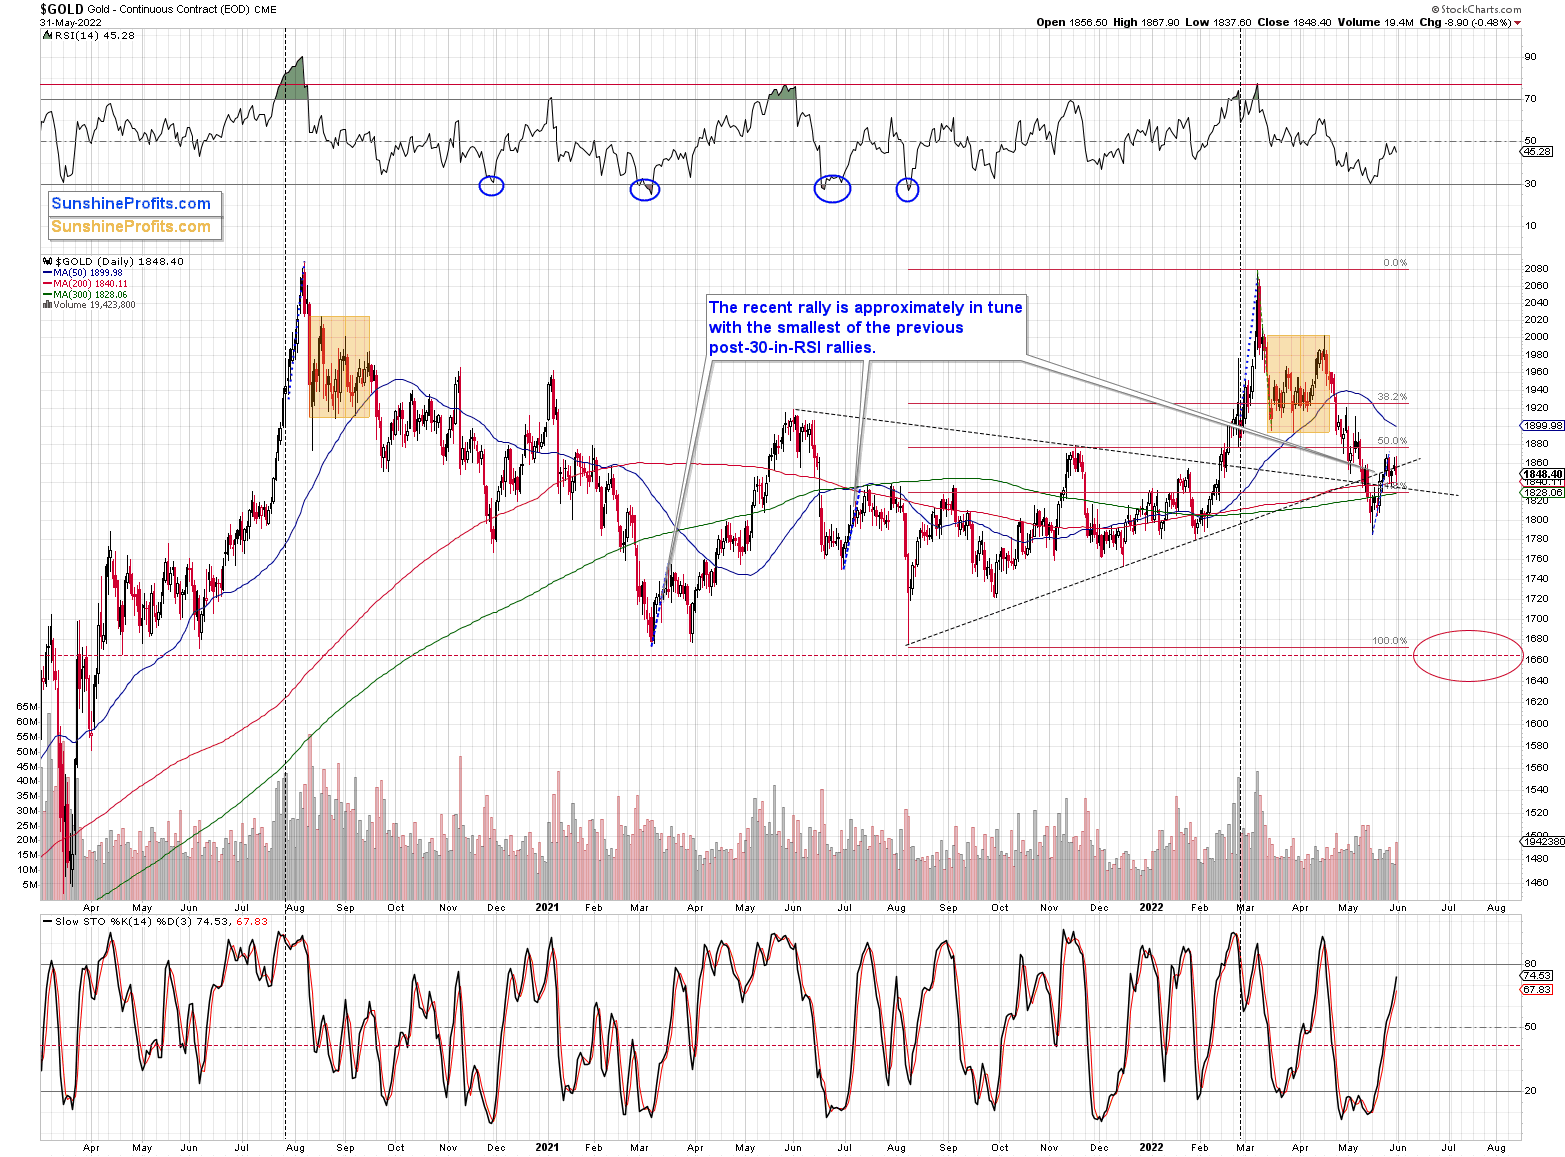
The gold market doesn’t provide any major clues right now, except for the fact that we saw a substantial increase in volume while gold declined. That’s bearish, but not very strongly so. It doesn’t have to be, though, as based on multiple other factors, gold is likely to decline in the medium term and analogies to previous huge declines are only one of them. Rising real interest rates and the USD Index are the two key bearish drivers of gold prices.
Speaking of the USD Index, it seems that it might have just bottomed right in my target area.
The combination of two rising support lines (and the 50-day moving average) was likely to stop the pullback, and we might have seen exactly that.
Please keep in mind that the RSI below 50 also indicated good buying opportunities for the USD Index during the recent run-up.
Most importantly, though, let’s keep in mind that gold stopped reacting to USDX’s weakness recently as it didn’t move to new highs while the former moved to new short-term lows.
The above is a powerful bearish combination of factors for the precious metals market.
All in all, it seems that we’re about to see another sizable decline in the prices of junior mining stocks, and while I can’t promise any performance, it seems likely to me that profits on our short positions will increase substantially.
Thank you for reading our free analysis today. Please note that the above is just a small fraction of the full analyses that our subscribers enjoy on a regular basis. They include multiple premium details such as the interim targets for gold and mining stocks that could be reached in the next few weeks. We invite you to subscribe now and read today’s issue right away.
Sincerely,
Przemyslaw Radomski, CFA
Founder, Editor-in-chief -
Why Does the Fed Have a Tough Nut to Crack With Gold Investors?
May 31, 2022, 10:16 AMAfter exiting our profitable long position in the GDXJ ETF, the focus is now squarely on the short side. However, with recession fears decelerating and optimism returning to Wall Street, the bulls are brimming with confidence.
Please see below:
 Source: Investing.com
Despite that, I've been warning since 2021 that investors underestimate inflation's wrath. Furthermore, they still don't see the connection between higher asset prices and inflation. For example:
Yet, I warned on Apr. 6 that higher asset prices are antithetical to the Fed’s 2% inflation goal. In a nutshell: the more the bull gores, the more inflation bites. I wrote:
Please remember that the Fed needs to slow the U.S. economy to calm inflation, and rising asset prices are mutually exclusive to this goal. Therefore, officials should keep hammering the financial markets until investors finally get the message.
Moreover, with the Fed in inflation-fighting mode and reformed doves warning that the U.S. economy “could teeter” as the drama unfolds, the reality is that there is no easy solution to the Fed’s problem. To calm inflation, it has to kill demand. If that occurs, investors should suffer a severe crisis of confidence.
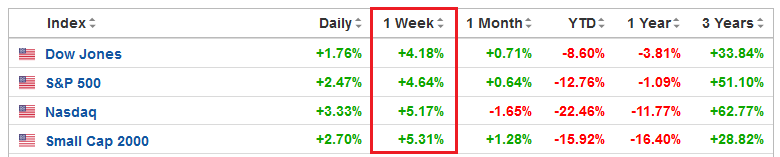
To that point, while U.S. stock indices rallied sharply last week, guess what else participated in the festivities.
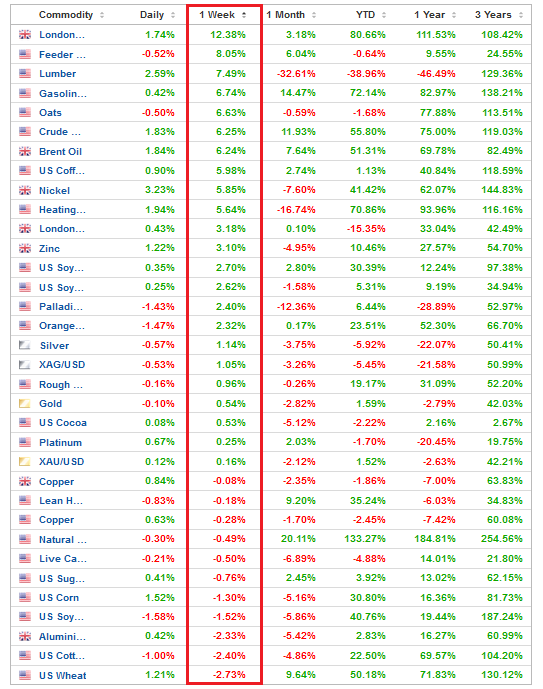 Source: Investing.com
To explain, the table above tallies the performance of commodities over various time periods. If you analyze the vertical red rectangle, notice how most commodities rallied alongside equities. As a result, the thesis was on full display.
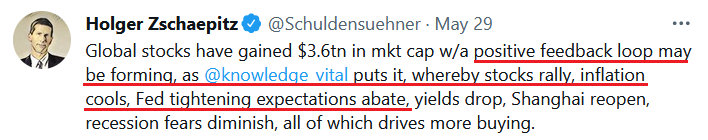
When economic optimism elicits rallies on Wall Street, that same optimism uplifts commodities. Therefore, if the Fed tries to appease investors and passively attack inflation, it will only spur more inflation.
As such, the idea of a “positive feedback loop” where ‘stocks rally, inflation cools, [and] Fed tightening expectations abate” is extremely unrealistic. In fact, it’s the exact opposite. The only bullish outcome is if economically-sensitive commodities collapse on their own. Then, input inflation would subside and eventually cool output inflation, and the Fed could turn dovish.
However, the central bank has been awaiting this outcome for two years. Thus, my comments from Apr. 6 remain critical. If investors continue to bid up stock prices, the follow-through from commodities will only intensify the pricing pressures in the coming months. Therefore, investors are flying blind once again.
To that point, I’ve long warned that investors underestimated the demand side of the inflation equation. Moreover, with German inflation outperforming across the board on May 30, the pricing pressures remain profound. For context, Germany is the Eurozone’s largest economy, and May’s data laps April’s results, which accounted for the inflationary impact of Russia’s invasion of Ukraine.
Please see below:
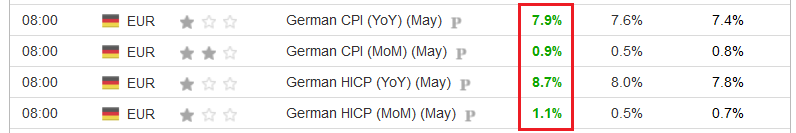 Source: Investing.com
Also, it was a similar story in Spain – the Eurozone’s fourth-largest economy. For context, the middle figures are economists’ consensus estimates:
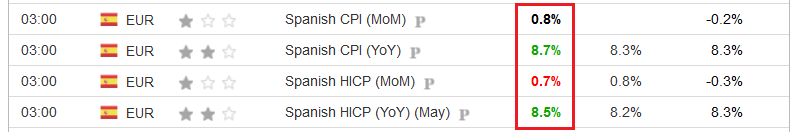 Source: Investing.com
More importantly, with demand more resilient in the U.S. than in other parts of the developed world, the misguided supply-side theory lacks fundamental credibility.
Please see below:
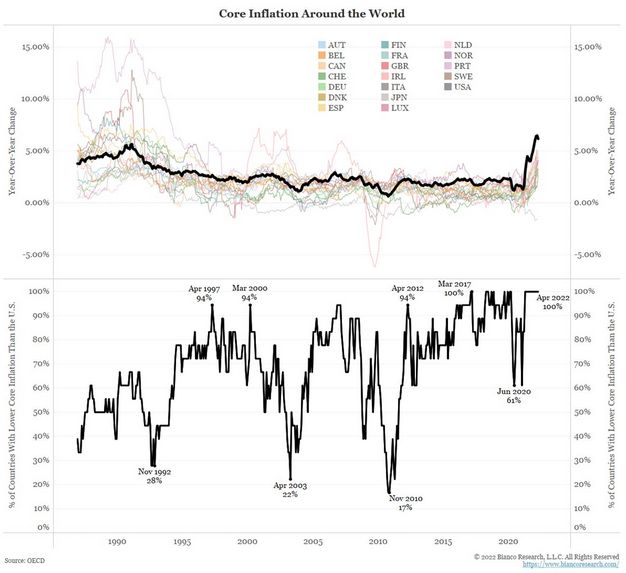
To explain, the chart at the top half tracks core inflation across various countries. For context, core inflation excludes the inflationary impacts of food and energy, so investors can’t blame the Russia/Ukraine conflict.
If you analyze the black line, you can see that the U.S. has the highest core inflation in the developed world. Moreover, if supply constraints were the main culprit, core inflation would be nearly identical across regions. Thus, with the U.S. showcasing more excess demand due to unprecedented stimulus, the Fed has a serious problem.
The Big Picture
Likewise, the black line at the bottom half of the chart plots the data in percentiles. If you focus your attention on the right side of the chart, you can see that U.S. core inflation is in the 100th percentile. Therefore, 100% of developed countries have lower core inflation, and investors underestimate the medium-term implications.
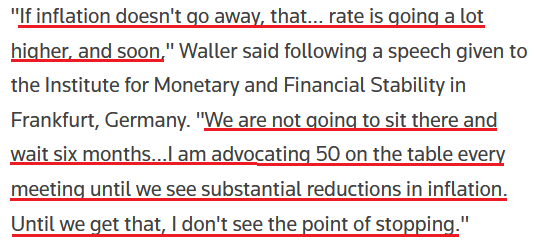
Speaking of which, Fed Governor Christopher Waller said on May 30: “I support tightening policy by another 50 basis points for several meetings. In particular, I am not taking 50 basis-point hikes off the table until I see inflation coming down closer to our 2% target (…).”
“By the end of this year, I support having the policy rate at a level above neutral. If the data suggest that inflation is stubbornly high, I am prepared to do more.”
He added:
“Markets expect about 2.5 percentage points of tightening this year. This expectation represents a significant degree of policy tightening, consistent with the FOMC’s commitment to get inflation back under control and, if we need to do more, we will.”
Therefore, with each optimistic week on Wall Street making the Fed’s job more difficult, the ‘buy the dip’ crowd doesn’t realize they’re digging their own graves.
Please see below:
 Source: Reuters
In addition, I noted on May 26 that prospective drawdowns of the S&P 500 and the PMs are unintended (but necessary) consequences of the Fed’s war with inflation. I wrote:
It's important to remember that Fed officials' primary objective is to calm inflation. They don't want to crash the stock, bond, or commodities markets; the latter outcomes are simply collateral damage from what must be done to curb the pricing pressures. To explain, I wrote on Dec. 23:
The Fed’s only hawkish goal is to calm inflation. When inflation was running hot and most Americans bought into the “transitory” narrative, Fed officials exuded confidence. However, when consumer confidence sank to a 10-year low and inflation became political, the Fed changed its tune. As a result, Powell wants to reduce inflation while tightening as little as possible (3% to 4% inflation may be considered acceptable in 2022).
In contrast, the weekly performance of most commodities shows that inflation is still running away from the Fed. Likewise, I noted previously that S&P Global’s input (all-time high) and output (second-highest on record) price indexes accelerated in May. Moreover, it’s important to understand the significance of PMI data that covers the entire U.S. S&P Global states:
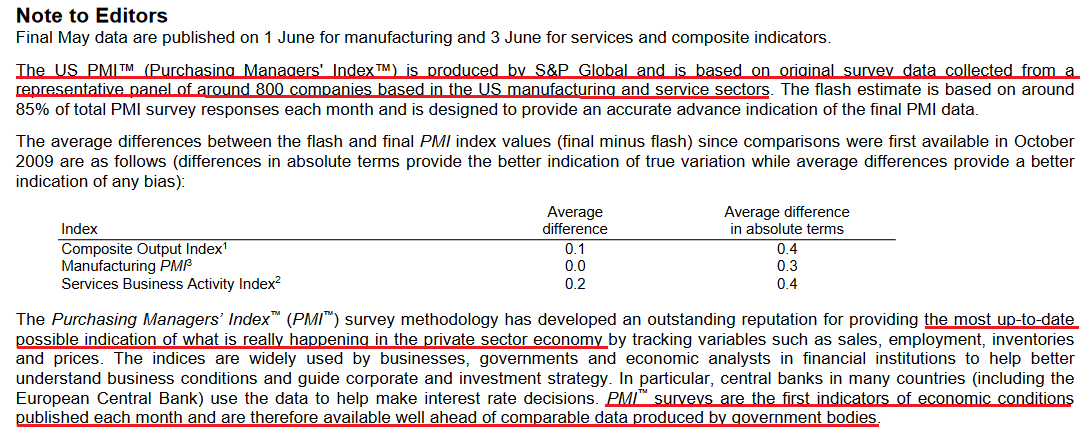 Source: S&P Global
Therefore, S&P Global’s results are collected from “around 800 companies” and are leading indicators of future government data. As a result, this mythical “positive feedback loop” exists only in investors’ minds, not in fundamental reality.
Second, the Kansas City Fed released its Tenth District Manufacturing Activity Survey on May 26. Now, this is a regional report, so it’s less relevant than S&P Global’s data. Moreover, while the KC Fed’s prices paid and received indexes “modestly declined from last month,” the results showed:
“In May, 92% of firms reported being affected by rising materials prices and lack of availability/delivery times and 87% anticipated this to persist for at least 6 months or longer.”
Please see below:
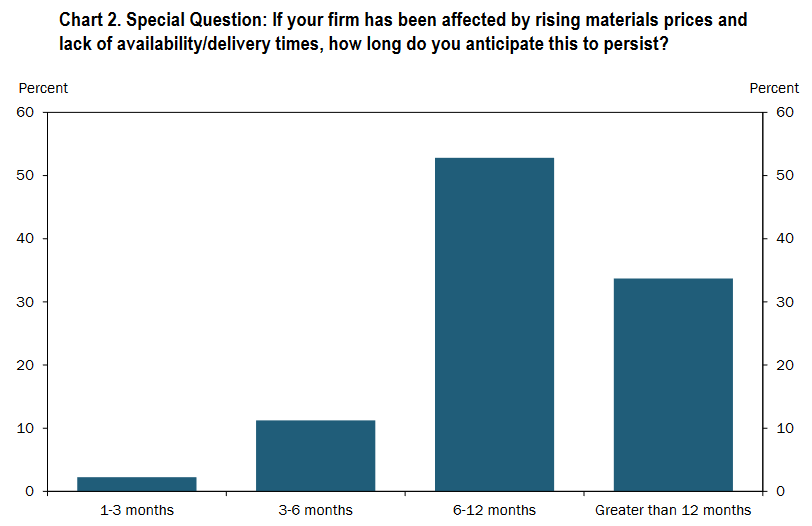 Source: KC Fed
Also:
“Over 59% of firms expected wages and prices to rise slightly or significantly faster compared with a year ago. A significant share of firms reported the expectation for prices to rise at a similar rate.”
Please see below:
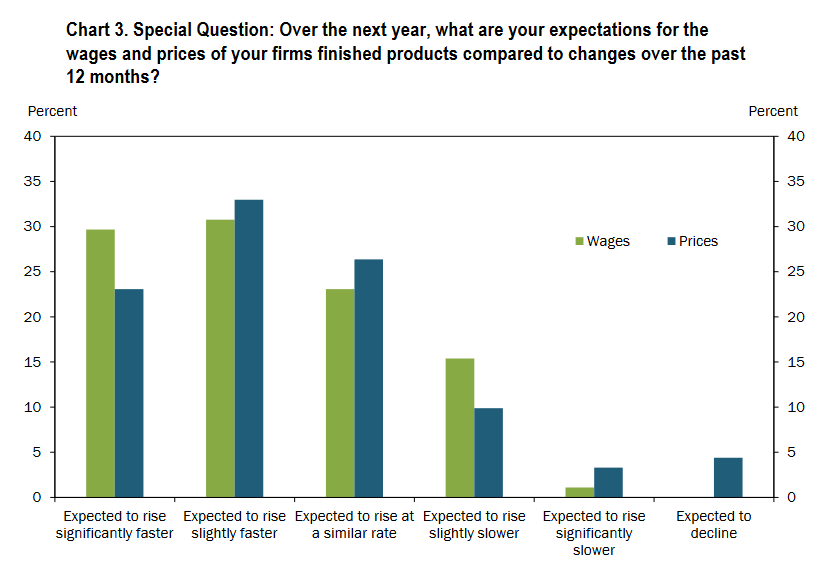 Source: KC Fed
Thus, with most respondents expecting prices and wages to rise in line or faster than the 5% to 6% realized in 2021, they’re nowhere near the Fed’s 2% target. Furthermore, since no respondents expect wages to decline over the next 12 months, how can U.S. consumers be on their deathbed when their salaries are increasing?
Similarly, the data jives with the wage sentiment expressed in The Conference Board’s U.S. CEO Conference survey released on May 18:
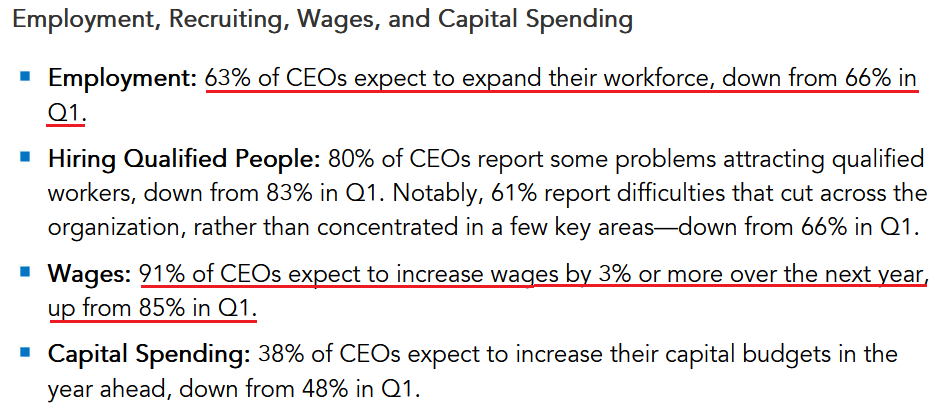 Source: The Conference Board
Even more revealing, please read some of the anecdotal comments from the KC Fed’s survey:
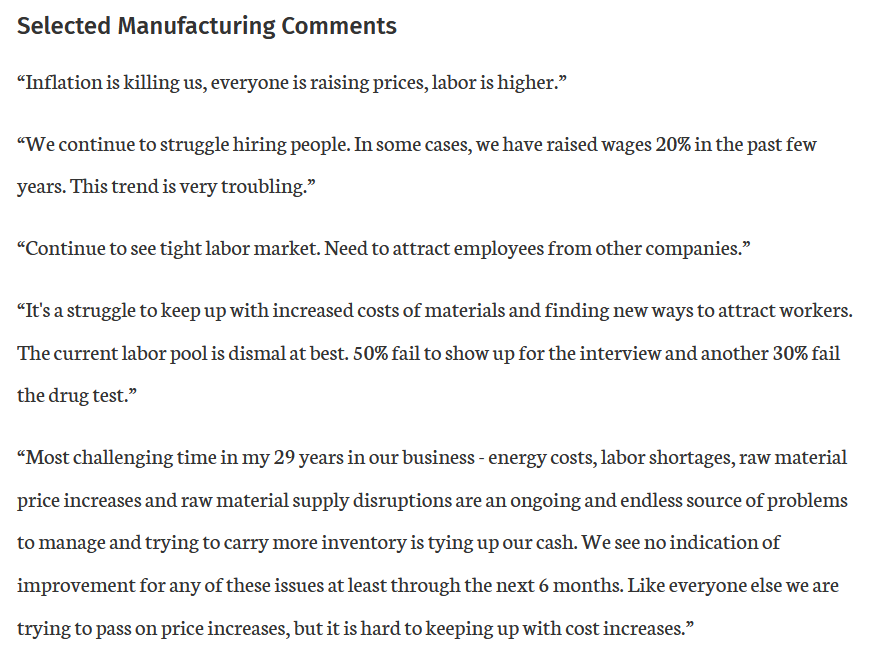 Source: KC Fed
The bottom line? While investors are prone to conjuring up unrealistic narratives, the latest takes the cake. For example, a retail apocalypse two weeks ago meant a recession was imminent. Then, after strong retail earnings flipped the script, all was forgotten. Now, the ‘new narrative’ is that stocks can rise while inflation declines and the post-GFC script is alive and well. However, the reality is that what’s bullish for stocks is also bullish for economically-sensitive commodities. As a result, higher asset prices elicit more inflation and a more hawkish Fed.
In conclusion, the PMs rallied on May 30, as optimism bloomed on Wall Street. However, I noted on Apr. 27 that while investors will likely remain in ‘buy the dip’ mode until the very end, lower highs and lower lows should confront the S&P 500 and the PMs over the next few months. Moreover, nothing has changed. The Fed has a profound problem, and solving its inflation crisis should result in more pain over the medium term.
Thank you for reading our free analysis today. Please note that the above is just a small fraction of the full analyses that our subscribers enjoy on a regular basis. They include multiple premium details such as the interim targets for gold and mining stocks that could be reached in the next few weeks. We invite you to subscribe now and read today’s issue right away.
Sincerely,
Przemyslaw Radomski, CFA
Founder, Editor-in-chief


Gold Investment News
Delivered To Your Inbox
Free Of Charge
Bonus: A week of free access to Gold & Silver StockPickers.
Gold Alerts
More-
Status
New 2024 Lows in Miners, New Highs in The USD Index
January 17, 2024, 12:19 PM -
Status
Soaring USD is SO Unsurprising – And SO Full of Implications
January 16, 2024, 8:40 AM -
Status
Rare Opportunity in Rare Earth Minerals?
January 15, 2024, 2:06 PM

