

Briefly: in our opinion, full (300% of the regular position size) speculative short positions in junior mining stocks are justified from the risk/reward point of view at the moment of publishing this Alert.
Let's face the truth: the Fed does not have an easy job in the fight against inflation, especially as the main fears of a recession have passed. After temporary perturbations, investors have regained their confidence and apparently are not planning to stop, still not considering higher asset prices as a warning. Meanwhile, these prices cannot rise if the US economy is to slow down.
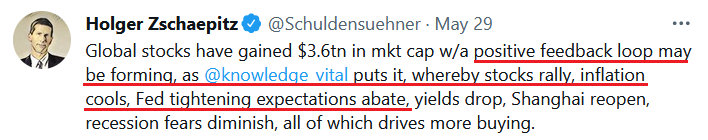
In reality, however, higher asset prices are driving more inflation and provoking the Fed to be even more hawkish. Thus, the idea of a "positive feedback loop" in which stocks rally, inflation cools, and the Fed's expectations fall is extremely unrealistic. In fact, the exact opposite is true. So, what will optimism on Wall Street bring and how will the Federal Reserve react to it?
The Big Picture
After exiting our profitable long position in the GDXJ ETF, the focus is now squarely on the short side. However, with recession fears decelerating and optimism returning to Wall Street, the bulls are brimming with confidence.
Please see below:
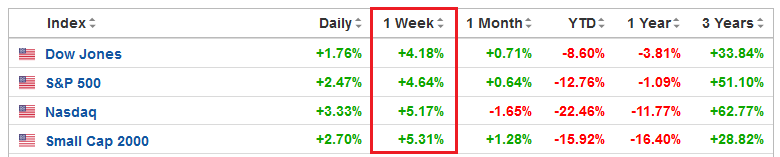 Source: Investing.com
Despite that, I've been warning since 2021 that investors underestimate inflation's wrath. Furthermore, they still don't see the connection between higher asset prices and inflation. For example:
Yet, I warned on Apr. 6 that higher asset prices are antithetical to the Fed’s 2% inflation goal. In a nutshell: the more the bull gores, the more inflation bites. I wrote:
Please remember that the Fed needs to slow the U.S. economy to calm inflation, and rising asset prices are mutually exclusive to this goal. Therefore, officials should keep hammering the financial markets until investors finally get the message.
Moreover, with the Fed in inflation-fighting mode and reformed doves warning that the U.S. economy “could teeter” as the drama unfolds, the reality is that there is no easy solution to the Fed’s problem. To calm inflation, it has to kill demand. If that occurs, investors should suffer a severe crisis of confidence.
To that point, while U.S. stock indices rallied sharply last week, guess what else participated in the festivities.
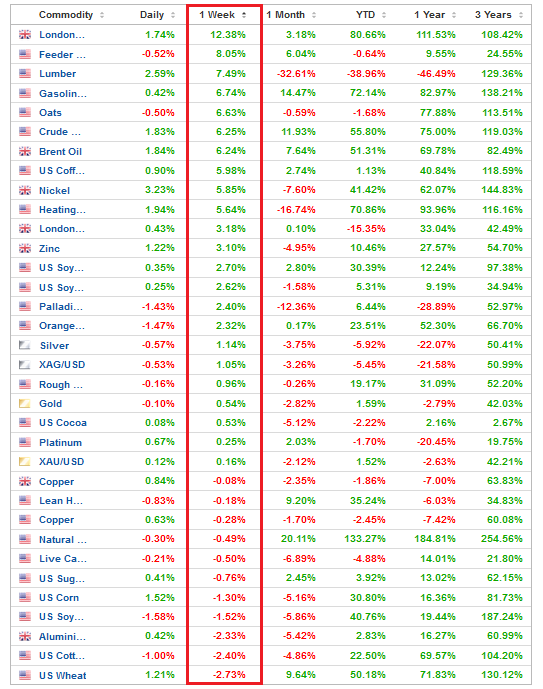 Source: Investing.com
To explain, the table above tallies the performance of commodities over various time periods. If you analyze the vertical red rectangle, notice how most commodities rallied alongside equities. As a result, the thesis was on full display.
When economic optimism elicits rallies on Wall Street, that same optimism uplifts commodities. Therefore, if the Fed tries to appease investors and passively attack inflation, it will only spur more inflation.
As such, the idea of a “positive feedback loop” where ‘stocks rally, inflation cools [and] Fed tightening expectations abate” is extremely unrealistic. In fact, it’s the exact opposite. The only bullish outcome is if economically-sensitive commodities collapse on their own. Then, input inflation would subside and eventually cool output inflation, and the Fed could turn dovish.
However, the central bank has been awaiting this outcome for two years. Thus, my comments from Apr. 6 remain critical. If investors continue to bid up stock prices, the follow-through from commodities will only intensify the pricing pressures in the coming months. Therefore, investors are flying blind once again.
To that point, I’ve long warned that investors underestimated the demand side of the inflation equation. Moreover, with German inflation outperforming across the board on May 30, the pricing pressures remain profound. For context, Germany is the Eurozone’s largest economy, and May’s data laps April’s results, which accounted for the inflationary impact of Russia’s invasion of Ukraine.
Please see below:
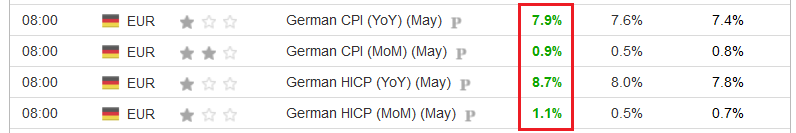 Source: Investing.com
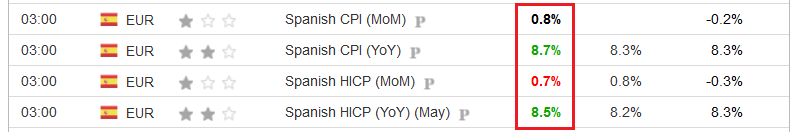
Also, it was a similar story in Spain – the Eurozone’s fourth-largest economy. For context, the middle figures are economists’ consensus estimates:
 Source: Investing.com
More importantly, with demand more resilient in the U.S. than in other parts of the developed world, the misguided supply-side theory lacks fundamental credibility.
Please see below:
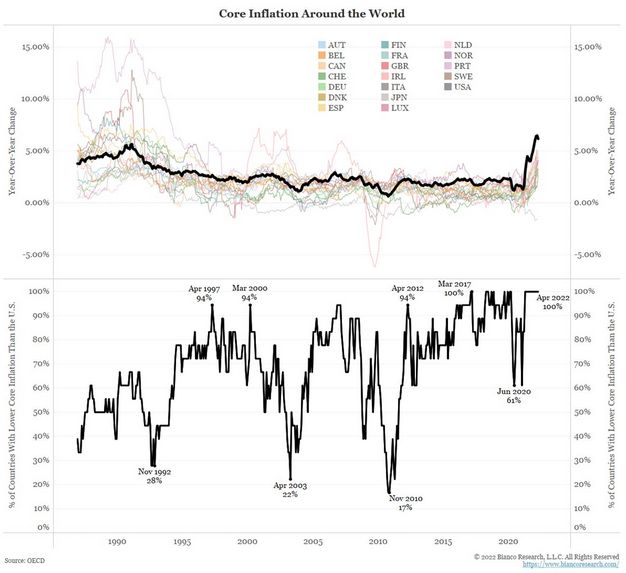
To explain, the chart at the top half tracks core inflation across various countries. For context, core inflation excludes the inflationary impacts of food and energy, so investors can’t blame the Russia/Ukraine conflict.
If you analyze the black line, you can see that the U.S. has the highest core inflation in the developed world. Moreover, if supply constraints were the main culprit, core inflation would be nearly identical across regions. Thus, with the U.S. showcasing more excess demand due to unprecedented stimulus, the Fed has a serious problem.
Likewise, the black line at the bottom half of the chart plots the data in percentiles. If you focus your attention on the right side of the chart, you can see that U.S. core inflation is in the 100th percentile. Therefore, 100% of developed countries have lower core inflation, and investors underestimate the medium-term implications.
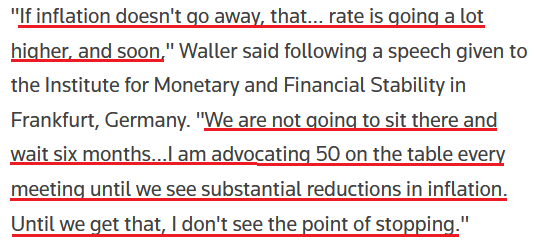
Speaking of which, Fed Governor Christopher Waller said on May 30: “I support tightening policy by another 50 basis points for several meetings. In particular, I am not taking 50 basis-point hikes off the table until I see inflation coming down closer to our 2% target (…).”
“By the end of this year, I support having the policy rate at a level above neutral. If the data suggest that inflation is stubbornly high, I am prepared to do more.”
He added:
“Markets expect about 2.5 percentage points of tightening this year. This expectation represents a significant degree of policy tightening, consistent with the FOMC’s commitment to get inflation back under control and, if we need to do more, we will.”
Therefore, with each optimistic week on Wall Street making the Fed’s job more difficult, the ‘buy the dip’ crowd doesn’t realize they’re digging their own graves.
Please see below:
 Source: Reuters
In addition, I noted on May 26 that prospective drawdowns of the S&P 500 and the PMs are unintended (but necessary) consequences of the Fed’s war with inflation. I wrote:
It's important to remember that Fed officials' primary objective is to calm inflation. They don't want to crash the stock, bond, or commodities markets; the latter outcomes are simply collateral damage from what must be done to curb the pricing pressures. To explain, I wrote on Dec. 23:
The Fed’s only hawkish goal is to calm inflation. When inflation was running hot and most Americans bought into the “transitory” narrative, Fed officials exuded confidence. However, when consumer confidence sank to a 10-year low and inflation became political, the Fed changed its tune. As a result, Powell wants to reduce inflation while tightening as little as possible (3% to 4% inflation may be considered acceptable in 2022).
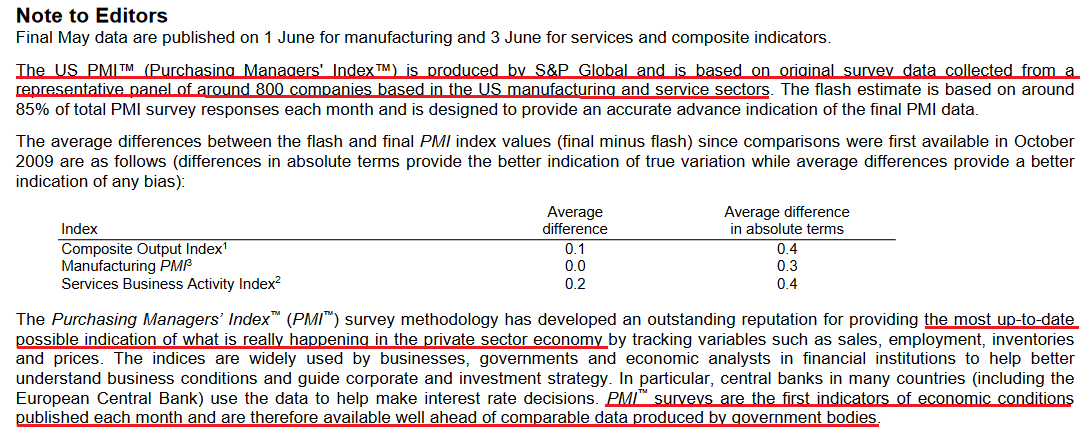
In contrast, the weekly performance of most commodities shows that inflation is still running away from the Fed. Likewise, I noted previously that S&P Global’s input (all-time high) and output (second-highest on record) price indexes accelerated in May. Moreover, it’s important to understand the significance of PMI data that covers the entire U.S. S&P Global states:
 Source: S&P Global
Therefore, S&P Global’s results are collected from “around 800 companies” and are leading indicators of future government data. As a result, this mythical “positive feedback loop” exists only in investors’ minds, not in fundamental reality.
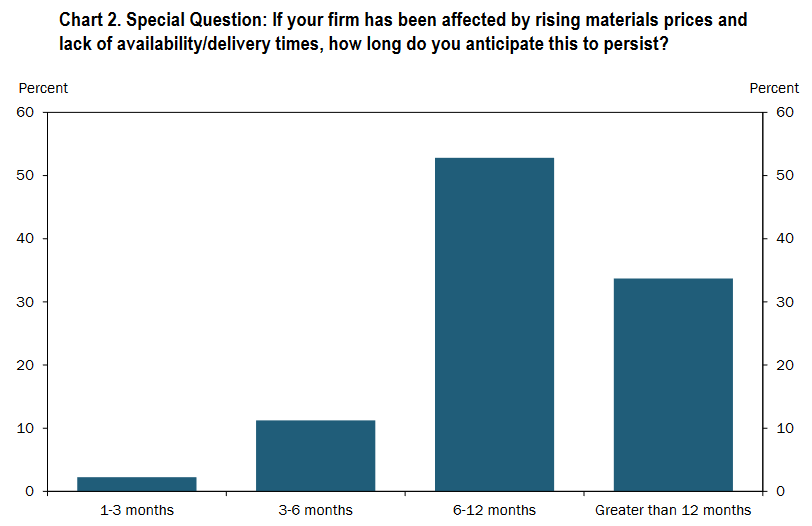
Second, the Kansas City Fed released its Tenth District Manufacturing Activity Survey on May 26. Now, this is a regional report, so it’s less relevant than S&P Global’s data. Moreover, while the KC Fed’s prices paid and received indexes “modestly declined from last month,” the results showed:
“In May, 92% of firms reported being affected by rising materials prices and lack of availability/delivery times and 87% anticipated this to persist for at least 6 months or longer.”
Please see below:
 Source: KC Fed
Also:
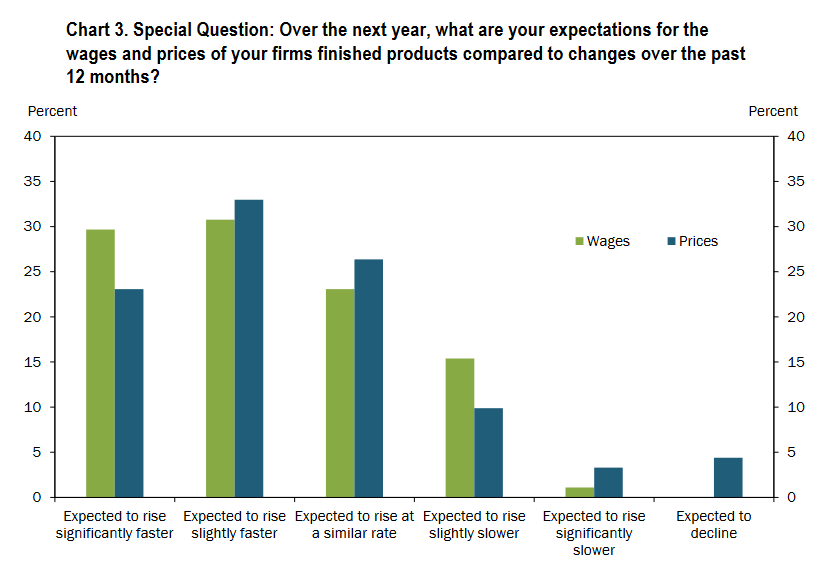
“Over 59% of firms expected wages and prices to rise slightly or significantly faster compared with a year ago. A significant share of firms reported the expectation for prices to rise at a similar rate.”
Please see below:
 Source: KC Fed
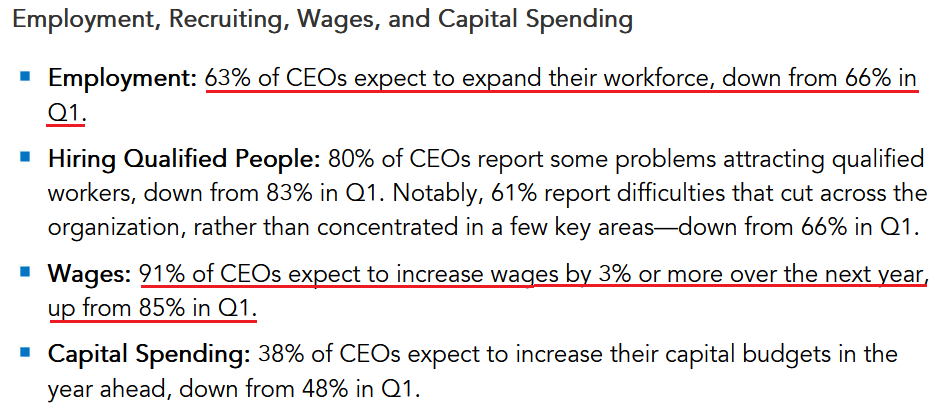
Thus, with most respondents expecting prices and wages to rise in line or faster than the 5% to 6% realized in 2021, they’re nowhere near the Fed’s 2% target. Furthermore, since no respondents expect wages to decline over the next 12 months, how can U.S. consumers be on their deathbed when their salaries are increasing?
Similarly, the data jives with the wage sentiment expressed in The Conference Board’s U.S. CEO Conference survey released on May 18:
 Source: The Conference Board
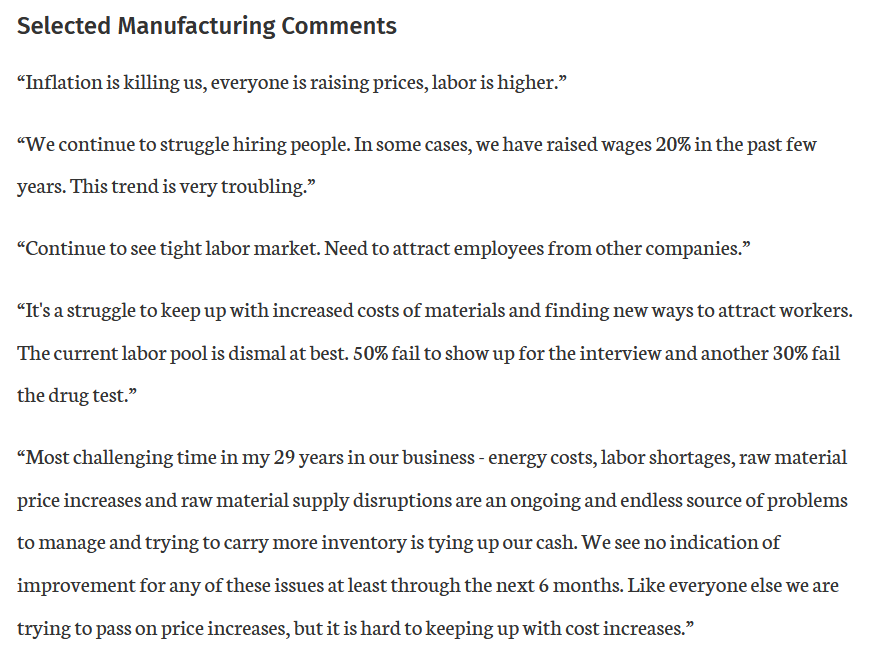
Even more revealing, please read some of the anecdotal comments from the KC Fed’s survey:
 Source: KC Fed
The bottom line? While investors are prone to conjuring up unrealistic narratives, the latest takes the cake. For example, a retail apocalypse two weeks ago meant a recession was imminent. Then, after strong retail earnings flipped the script, all was forgotten. Now, the ‘new narrative’ is that stocks can rise while inflation declines and the post-GFC script is alive and well. However, the reality is that what’s bullish for stocks is also bullish for economically-sensitive commodities. As a result, higher asset prices elicit more inflation and a more hawkish Fed.
In conclusion, the PMs rallied on May 30, as optimism bloomed on Wall Street. However, I noted on Apr. 27 that while investors will likely remain in ‘buy the dip’ mode until the very end, lower highs and lower lows should confront the S&P 500 and the PMs over the next few months. Moreover, nothing has changed. The Fed has a profound problem, and solving its inflation crisis should result in more pain over the medium term.
Overview of the Upcoming Part of the Decline
- It seems to me that the short-term rally in the precious metals market is either over or very close to being over. It’s so close to being over that I think it’s already a good idea to be shorting junior mining stocks.
- We’re likely to (if not immediately, then soon) see another big slide, perhaps close to the 2021 lows ($1,650 - $1,700).
- If we see a situation where miners slide in a meaningful and volatile way while silver doesn’t (it just declines moderately), I plan to – once again – switch from short positions in miners to short positions in silver. At this time, it’s too early to say at what price levels this could take place, and if we get this kind of opportunity at all – perhaps with gold close to $1,600.
- I plan to exit all remaining short positions once gold shows substantial strength relative to the USD Index while the latter is still rallying. This may be the case with gold close to $1,400. I expect silver to fall the hardest in the final part of the move. This moment (when gold performs very strongly against the rallying USD and miners are strong relative to gold after its substantial decline) is likely to be the best entry point for long-term investments, in my view. This can also happen with gold close to $1,400, but at the moment it’s too early to say with certainty.
- The above is based on the information available today, and it might change in the following days/weeks.
You will find my general overview of the outlook for gold on the chart below:
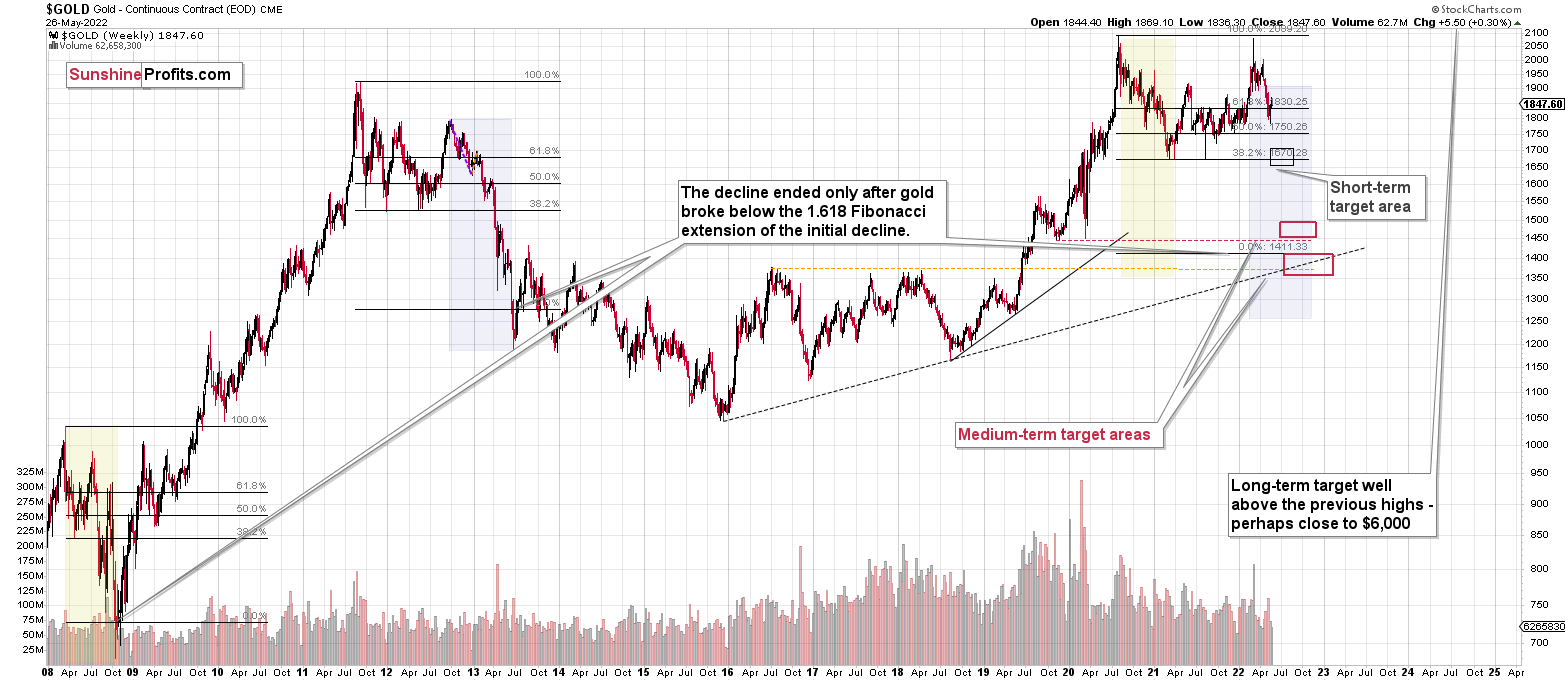
Please note that the above timing details are relatively broad and “for general overview only” – so that you know more or less what I think and how volatile I think the moves are likely to be – on an approximate basis. These time targets are not binding or clear enough for me to think that they should be used for purchasing options, warrants or similar instruments.
Summary
Summing up, it seems to me that the short-term rally in the precious metals market is either over or close to being over. In fact, it’s so close to being over that I think it’s already a good idea to be shorting junior mining stocks.
I previously wrote that the profits from the previous long position (congratulations once again) were likely to further enhance the profits on this huge decline, and that’s exactly what happened. The profit potential with regard to the upcoming gargantuan decline remains huge.
As investors are starting to wake up to reality, the precious metals sector (particularly junior mining stocks) is declining sharply. Here are the key aspects of the reality that market participants have ignored:
- rising real interest rates,
- rising USD Index values.
Both of the aforementioned are the two most important fundamental drivers of the gold price. Since neither the USD Index nor real interest rates are likely to stop rising anytime soon (especially now that inflation has become highly political), the gold price is likely to fall sooner or later. Given the analogy to 2012 in gold, silver, and mining stocks, “sooner” is the more likely outcome.
After the final sell-off (that takes gold to about $1,350-$1,500), I expect the precious metals to rally significantly. The final part of the decline might take as little as 1-5 weeks, so it's important to stay alert to any changes.
As always, we'll keep you – our subscribers – informed.
To summarize:
Trading capital (supplementary part of the portfolio; our opinion): Full speculative short positions (300% of the full position) in junior mining stocks are justified from the risk to reward point of view with the following binding exit profit-take price levels:
Mining stocks (price levels for the GDXJ ETF): binding profit-take exit price: $27.32; stop-loss: none (the volatility is too big to justify a stop-loss order in case of this particular trade)
Alternatively, if one seeks leverage, we’re providing the binding profit-take levels for the JDST (2x leveraged). The binding profit-take level for the JDST: $19.87; stop-loss for the JDST: none (the volatility is too big to justify a SL order in case of this particular trade).
For-your-information targets (our opinion; we continue to think that mining stocks are the preferred way of taking advantage of the upcoming price move, but if for whatever reason one wants / has to use silver or gold for this trade, we are providing the details anyway.):
Silver futures downside profit-take exit price: $17.22
SLV profit-take exit price: $16.22
ZSL profit-take exit price: $41.87
Gold futures downside profit-take exit price: $1,706
HGD.TO – alternative (Canadian) 2x inverse leveraged gold stocks ETF – the upside profit-take exit price: $11.87
HZD.TO – alternative (Canadian) 2x inverse leveraged silver ETF – the upside profit-take exit price: $31.87
Long-term capital (core part of the portfolio; our opinion): No positions (in other words: cash)
Insurance capital (core part of the portfolio; our opinion): Full position
Whether you’ve already subscribed or not, we encourage you to find out how to make the most of our alerts and read our replies to the most common alert-and-gold-trading-related-questions.
Please note that we describe the situation for the day that the alert is posted in the trading section. In other words, if we are writing about a speculative position, it means that it is up-to-date on the day it was posted. We are also featuring the initial target prices to decide whether keeping a position on a given day is in tune with your approach (some moves are too small for medium-term traders, and some might appear too big for day-traders).
Additionally, you might want to read why our stop-loss orders are usually relatively far from the current price.
Please note that a full position doesn't mean using all of the capital for a given trade. You will find details on our thoughts on gold portfolio structuring in the Key Insights section on our website.
As a reminder - "initial target price" means exactly that - an "initial" one. It's not a price level at which we suggest closing positions. If this becomes the case (as it did in the previous trade), we will refer to these levels as levels of exit orders (exactly as we've done previously). Stop-loss levels, however, are naturally not "initial", but something that, in our opinion, might be entered as an order.
Since it is impossible to synchronize target prices and stop-loss levels for all the ETFs and ETNs with the main markets that we provide these levels for (gold, silver and mining stocks - the GDX ETF), the stop-loss levels and target prices for other ETNs and ETF (among other: UGL, GLL, AGQ, ZSL, NUGT, DUST, JNUG, JDST) are provided as supplementary, and not as "final". This means that if a stop-loss or a target level is reached for any of the "additional instruments" (GLL for instance), but not for the "main instrument" (gold in this case), we will view positions in both gold and GLL as still open and the stop-loss for GLL would have to be moved lower. On the other hand, if gold moves to a stop-loss level but GLL doesn't, then we will view both positions (in gold and GLL) as closed. In other words, since it's not possible to be 100% certain that each related instrument moves to a given level when the underlying instrument does, we can't provide levels that would be binding. The levels that we do provide are our best estimate of the levels that will correspond to the levels in the underlying assets, but it will be the underlying assets that one will need to focus on regarding the signs pointing to closing a given position or keeping it open. We might adjust the levels in the "additional instruments" without adjusting the levels in the "main instruments", which will simply mean that we have improved our estimation of these levels, not that we changed our outlook on the markets. We are already working on a tool that would update these levels daily for the most popular ETFs, ETNs and individual mining stocks.
Our preferred ways to invest in and to trade gold along with the reasoning can be found in the how to buy gold section. Furthermore, our preferred ETFs and ETNs can be found in our Gold & Silver ETF Ranking.
As a reminder, Gold & Silver Trading Alerts are posted before or on each trading day (we usually post them before the opening bell, but we don't promise doing that each day). If there's anything urgent, we will send you an additional small alert before posting the main one.
Thank you.
Przemyslaw Radomski, CFA
Founder, Editor-in-chief

