

Briefly: in our opinion, full (300% of the regular position size) speculative short positions in mining stocks are justified from the risk/reward point of view at the moment of publishing this Alert.
In yesterday’s analysis, I emphasized that silver’s volatile upswing is likely just temporary, and I discussed the Kondratiev cycle which implies much higher gold prices but not necessarily right away, because the value of cash (USD) would be likely to soar as well. The latter would likely to trigger a temporary slide in gold.
Well, was silver’s rally temporary?
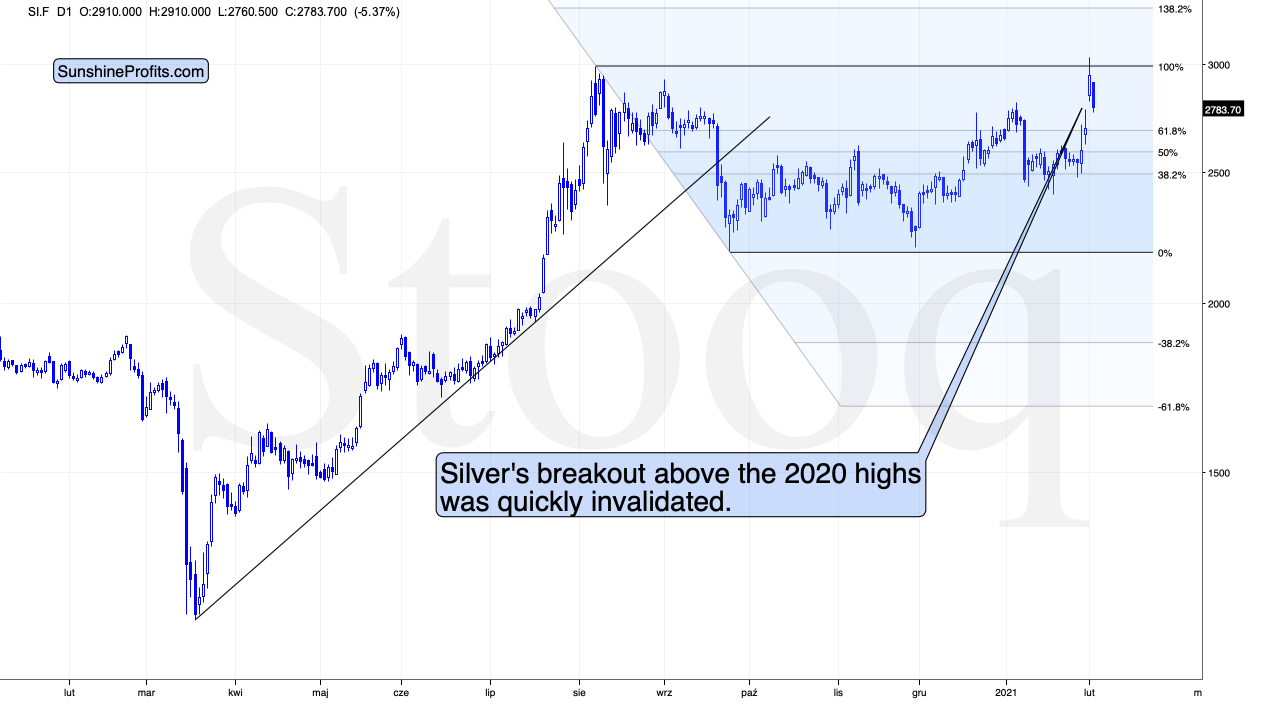
Figure 1 – COMEX Silver Futures
That seems to have been the case. In yesterday’s analysis I commented on the above short-term silver chart in the following way:
On a short-term basis, silver showed strength – also today, when it rallied slightly above the early-September high. Perhaps the final part of those who might have been inclined to buy based on the “silver manipulation” narrative and the forum encouragements in general, have decided to make their purchases over the weekend, and we’re seeing the result in today’s pre-market trading.
This, coupled with the miners’ relative weakness means that the bearish outlook remains intact. If it “feels” that the precious metals market is about take off, but the analysis says otherwise (please remember about the first chart from today’s analysis), then it’s very likely that the PMs are topping. That’s what people see and “feel” at the top.
While silver moved close to its 2021 highs, the GDX ETF moved close to its 2021 lows – the relative underperformance of the latter is striking.
Silver invalidated the breakout above the 2020 highs. During today’s trading, silver is already down quite visibly. It’s now apparent that the silver world is not ending, and that silver’s price doesn’t have to keep on climbing. Is the silver shortage here? Not necessarily. Some bullion products might be in short supply and it wouldn’t be the first time this is the case. The size of the silver market is not that small after all.
Silver had many strong short-term run-ups in the past, and in the vast majority of cases, when they corresponded with relatively weak performance of mining stocks, it meant that lower prices for the precious metals sector are to be expected, not higher ones. This also implies a bearish forecast for silver in the medium term.
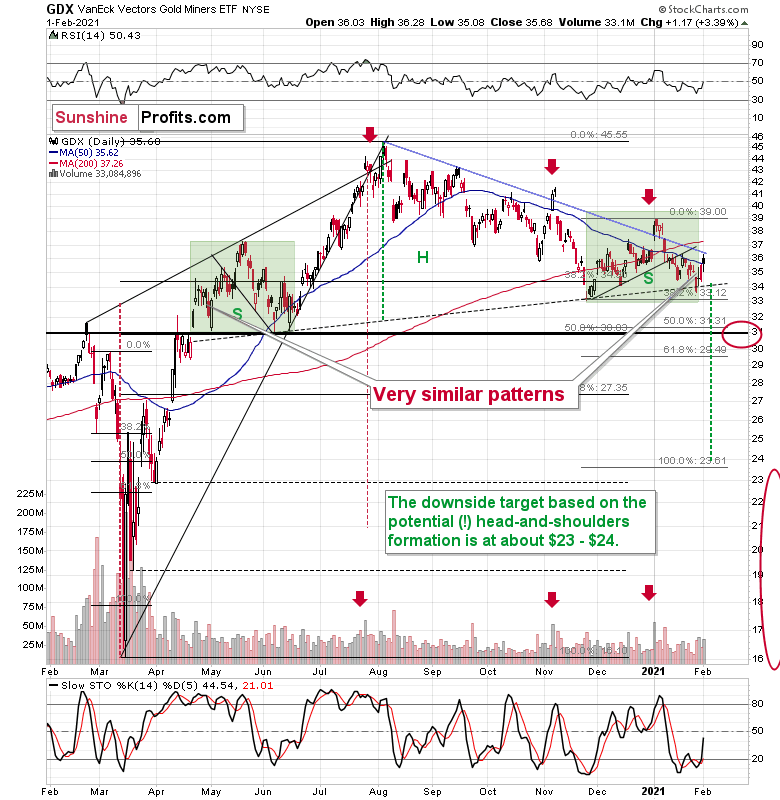
Figure 2 – VanEck Vectors Gold Miners ETF (GDX)
Are miners weak right now? Of course, they are weak. It was not only silver that got attention recently, but also silver stocks. The GDX ETF is mostly based on gold stocks, but still, silver miners’ performance still affects it. And… GDX is still trading relatively close to the yearly lows. Silver moved a bit above its 2020 highs – did miners do that as well? Absolutely not, they were only able to trigger a tiny move higher.
Interestingly, the most recent move higher only made the similarity of this shoulder portion of the bearish head-and-shoulders pattern to the left shoulder (figure 2 - both marked with green) bigger. This means that when the GDX breaks below the neck level of the pattern in a decisive way, the implications are likely to be extremely bearish for the next several weeks or months.
The GDX is still likely to form an initial (!) bottom close to $31, though.
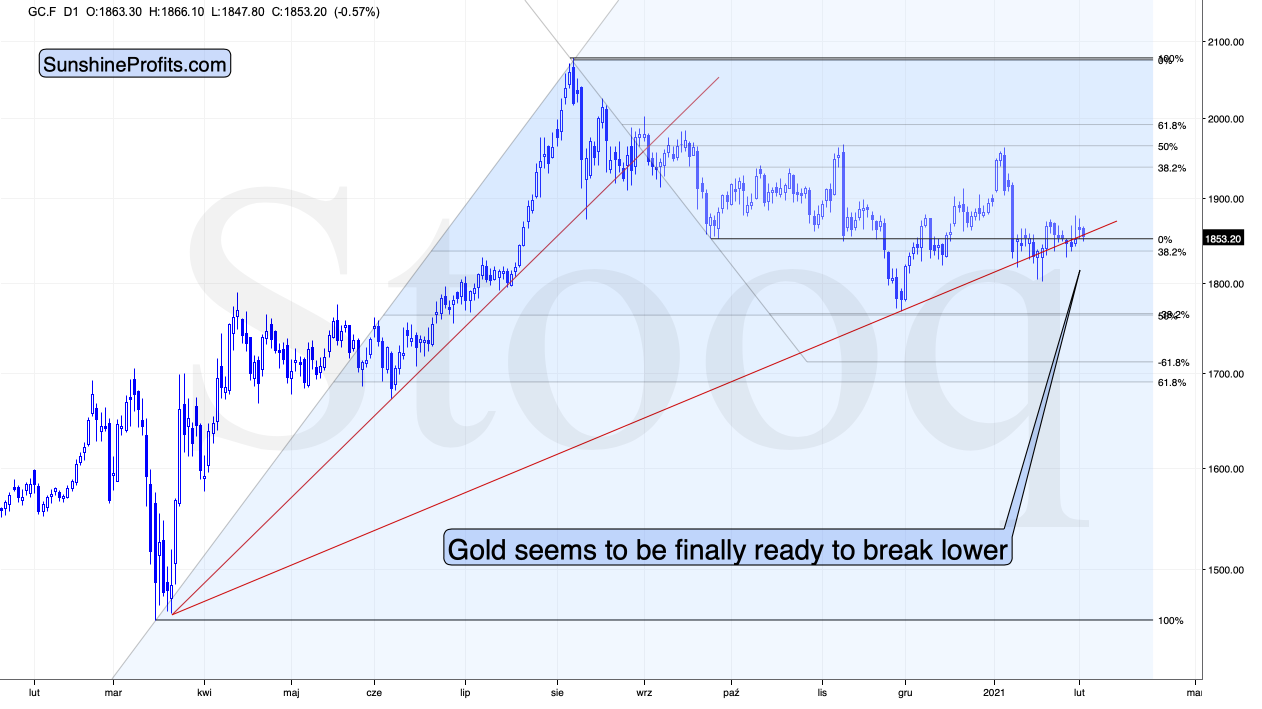
Figure 3 - COMEX Gold Futures (GC.F)
Despite yesterday’s higher close, gold is already back down in today’s pre-market trading. All that we saw recently was a back-and-forth movement that was a part of a consolidation which started after gold declined earlier this year in a volatile manner.
Please note that the thing that prevented gold from declining further right away, was the rising red support line based on the March 2020 and November 2020 lows. In all cases, when gold was about to break below this line, it ultimately moved slightly higher. Right now, gold is making another attempt to break below it. It seems quite likely that this attempt will be successful.
You already know about the key, crystal-clear point that confirms this outlook – very strong relative performance of silver and very weak relative performance of mining stocks.
The second important short-term detail comes from the USD Index, which just moved to a new yearly high.
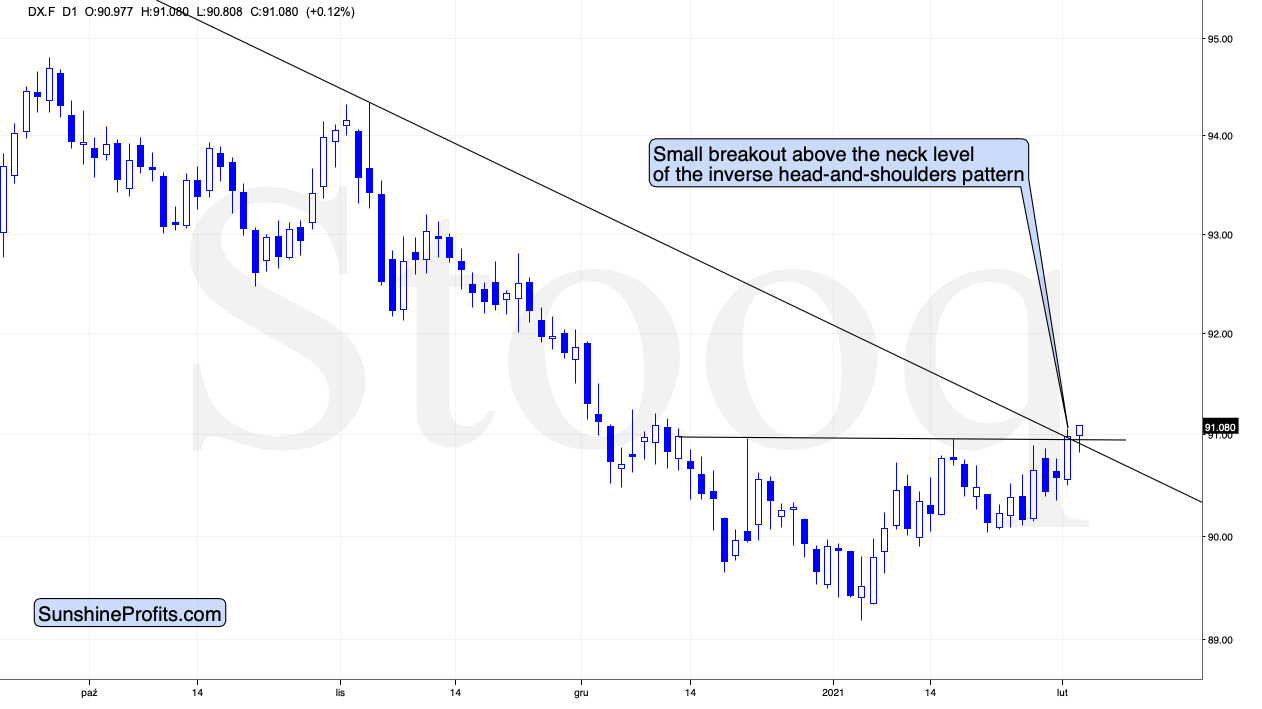
Figure 4 - USD Index
The move to a new yearly high is not that important as the move above the neck level of the inverse head-and-shoulders pattern. This breakout is not yet confirmed, but once it is confirmed, it’s likely to trigger another powerful upswing.
And another short-term rally here will mean a decisive move above the medium-term declining resistance line and USD’s 50-day moving average. Please take a look at the below chart for details.
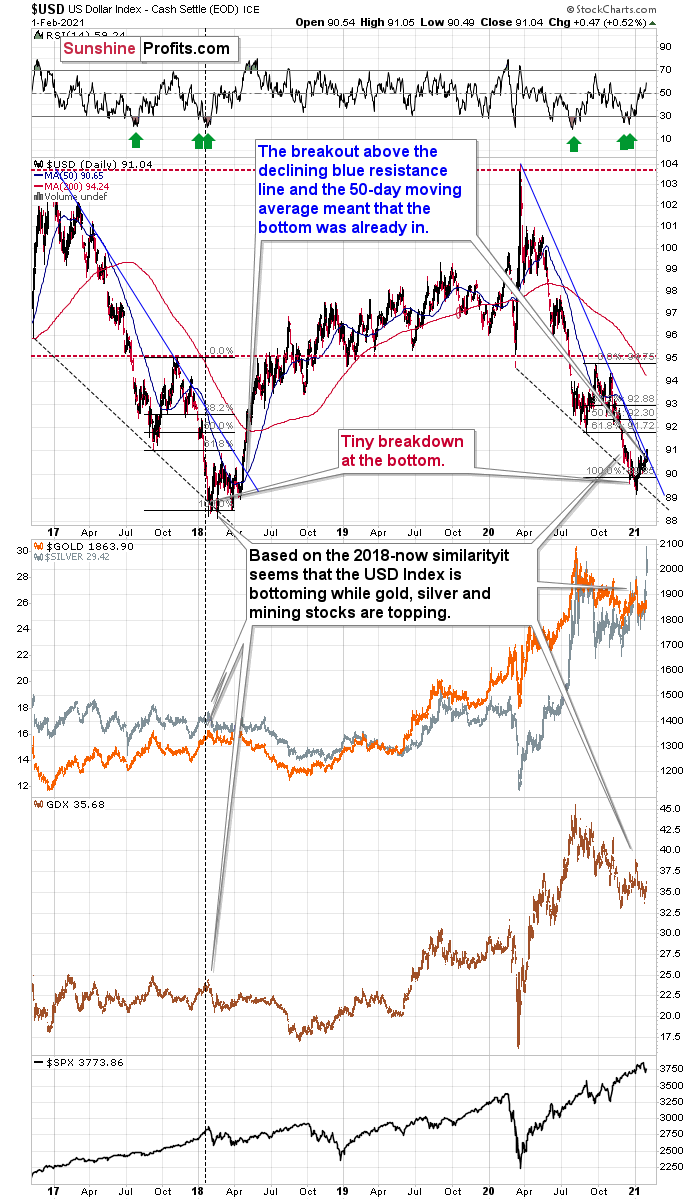
Figure 5
Yesterday’s close of 91.04 was above both the declining blue resistance line and the 50-day moving average (90.65).
When we saw this kind of double breakout back in 2018, it meant that the bottoming process was complete and that one should buckle up for a sharp upswing. The implications are very bullish for the USD Index and very bearish for the precious metals sector.
Having said that, let’s take a look at the markets from the fundamental point of view.
Follow the Leader
With the precious metals getting sucked into equities’ speculative vortex, WallStreetBets’ (WSB) latest target is silver. But despite the group’s ability to orchestrate daily price spikes, the PMs overall trend remains down.
On Dec. 28, I warned that nominal interest rates could be a sleeping giant. With the U.S. yield curve stuck in hibernation, I wrote that it was only a matter of time before Treasury yields awoke from their slumber.
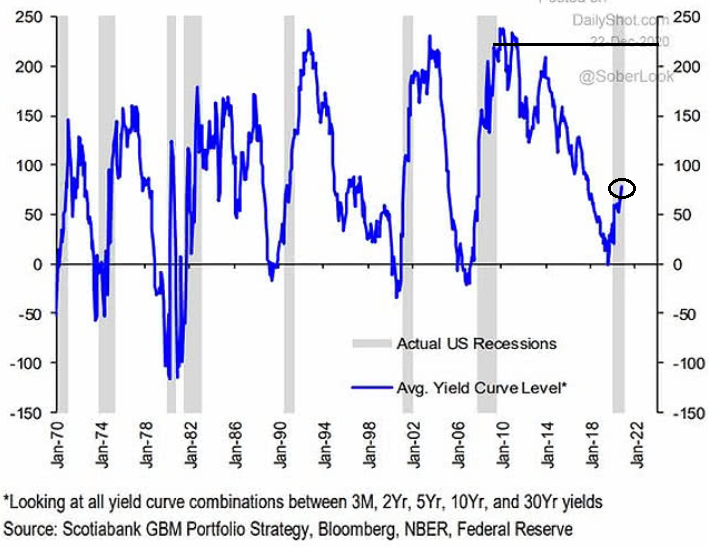
Figure 6
Notice the shaded gray bars from top to bottom? They represent historical U.S. recessions. And to make a relative assessment, the blue line is the average interest rate on U.S. Treasuries (various maturities) during the same time periods.
If you analyze the last U.S. recession (the 2008 housing crisis, represented by the shaded gray bar near Jan-10), you’ll notice that the average U.S. Treasury yield peaked at more than 200 basis points (2.00%). In contrast, during the current economic malaise, the average U.S. Treasury yield hasn’t eclipsed (roughly) 75 basis points (0.75%).
The key takeaway?
If the average U.S. Treasury yield repeats its historical pattern, then nominal interest rates have plenty of room to move higher. And following right along, they will lift real yields in the process (unless the expected inflation rate swells, which is unlikely). The potential development is extremely bearish for gold, because it decreases gold’s attractiveness relative to government bonds. So, while pundits keep reiterating that “this time is different,” history suggests otherwise.
With the script still being written, the U.S. 10-Year Treasury yield has rallied by more than 17% since Jan. 5, while gold has fallen by more than 4%.
Please see below:
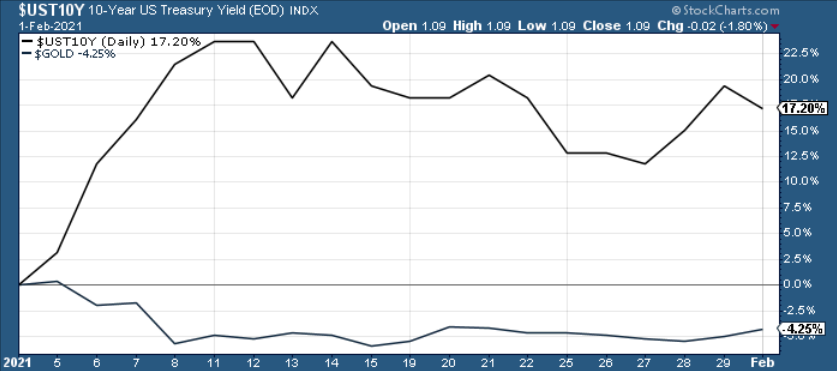
Figure 7
But even more telling, the copper/U.S. 10-Year Treasury yield ratio is signaling that gold’s decline is far from over.
However, before getting into the details, I want to explain the significance of the copper/gold ratio:
- Copper/gold is highly correlated with U.S. Treasury yields
- When copper is outperforming (the ratio increases), higher interest rates tend to follow
- When gold is outperforming (the ratio decreases), lower interest rates tend to follow
For context, I wrote previously:
Notice the blue and gold lines moving in similar directions – especially since 2010?
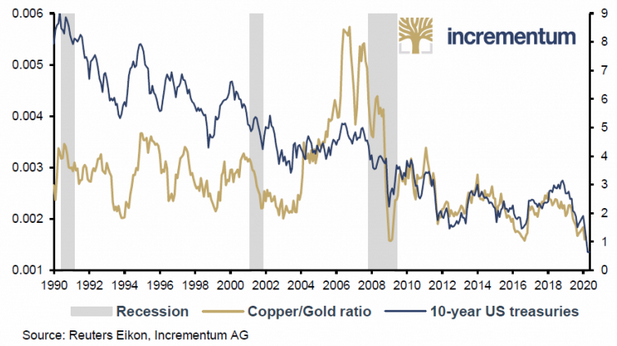
Figure 8
The bottom line is that copper/gold might have the same effect as the steepening yield curve (one might be indicating the other and result in lower gold prices). If it reverts back to its historical average (by moving higher), gold will likely face significant selling pressure.
Now circling back to the copper/U.S. 10-Year Treasury yield ratio, we can apply a little bit of algebra. Essentially, if the copper/gold ratio is a reliable indicator of future U.S. interest rates, then the copper/U.S. 10-Year Treasury yield ratio should be a reliable indicator of future gold prices.
Please see below:
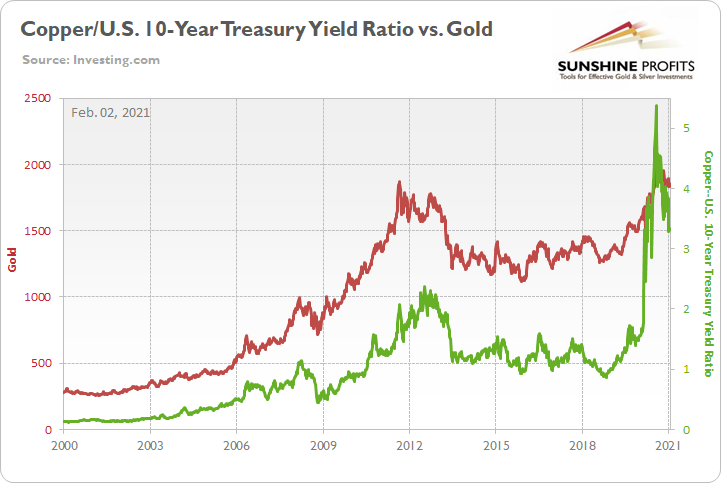
Figure 9
To explain the chart above, the red line depicts the price of gold over the last ~21 years, while the green line depicts the copper/U.S. 10-Year Treasury yield ratio. As you can see, the two have a tight relationship: when the copper/U.S. 10-Year Treasury yield ratio is rising (meaning that copper prices are rising at a faster pace than the U.S. 10-Year Treasury yield), it usually results in higher gold prices. Conversely, when the copper/U.S. 10-Year Treasury yield ratio is falling (meaning that the U.S. 10-Year Treasury yield is rising at a faster pace than copper prices), it usually results in lower gold prices.
If you focus on the right side of the chart, you can see that the copper/U.S. 10-Year Treasury yield ratio (the green line) has made a vertical move lower. Falling from a high of nearly 5.5, the ratio is now below 3.5. And moving in lockstep, gold peaked at roughly the same time.
The key takeaway?
With gold already tracking the copper/U.S. 10-Year Treasury yield ratio lower, the magnitude of the latter’s decline implies further downside for gold. In addition, the U.S. 10-Year Treasury yield remains technically sound, with higher highs and higher lows signaling that a continuation of August’s uptrend remains the path of least resistance.
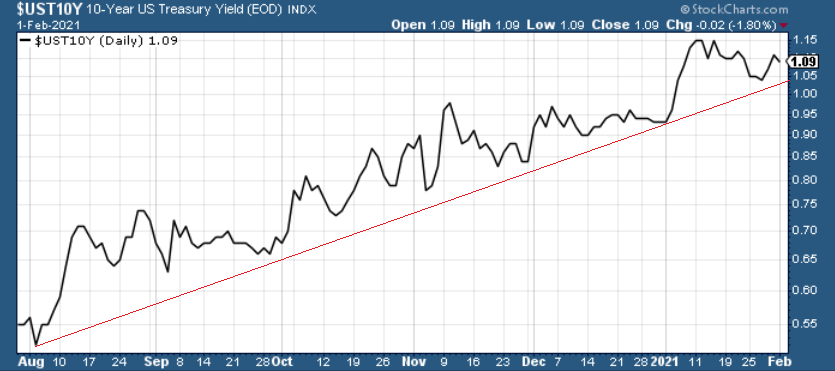
Figure 10
Can’t Stop, Won’t Stop
Despite the S&P 500’s Volatility Index (VIX) delivering its largest one-week spike in nearly three years, the Fear Index hasn’t instilled much fear in U.S. investors.
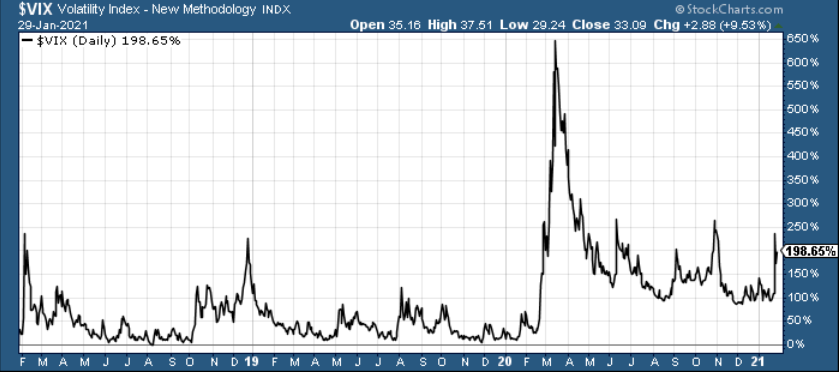
Figure 11
To explain, the VIX is calculated by taking the average prices of call and put options. When the line above rises, it means that dealers (the sellers of options) are charging higher prices. This occurs when dealers expect volatility to increase over the next 30 days (or relative to the options expiry date). Because higher volatility increases the likelihood that the underlying asset will rise above or below the options strike price, dealers demand higher compensation to provide their service.
But undeterred by the rising prices, nearly 38 million call options exchanged hands on Jan. 27 – an all-time high. Furthermore, daily volume was nearly 5.5x its historical average.
Please see below:
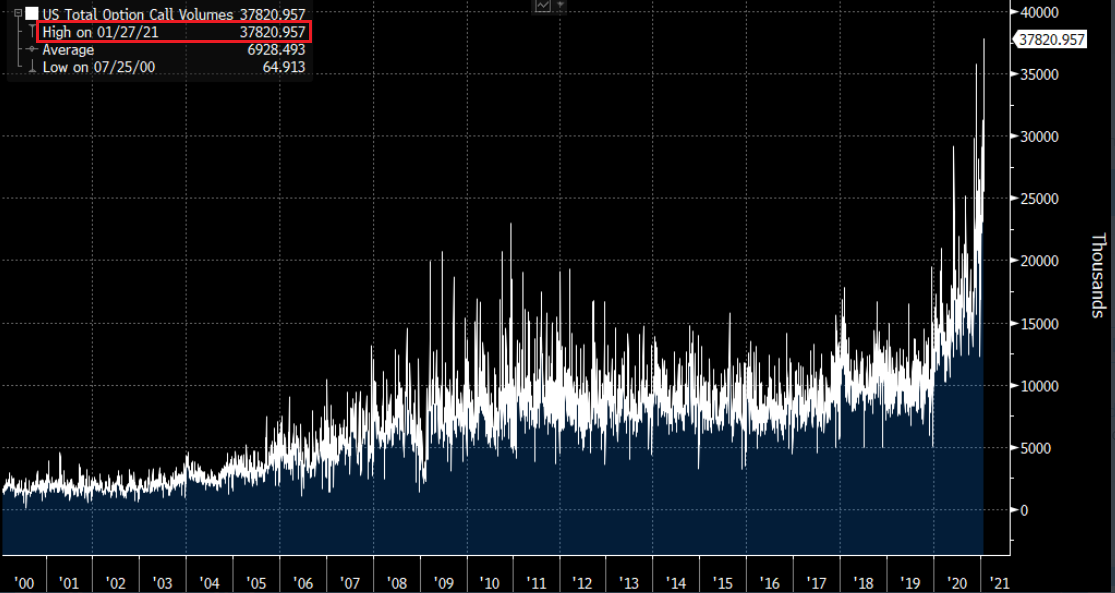
Figure 12 - Source: Bloomberg/ Sarah Ponczek
In addition, the least sophisticated investors continue to Push It to the Limit. Small traders, or investors that purchase 10 or less call option contracts, are buying in droves. For context, options sell in lots of 100, so small traders have exposure to 1,000 shares or less.
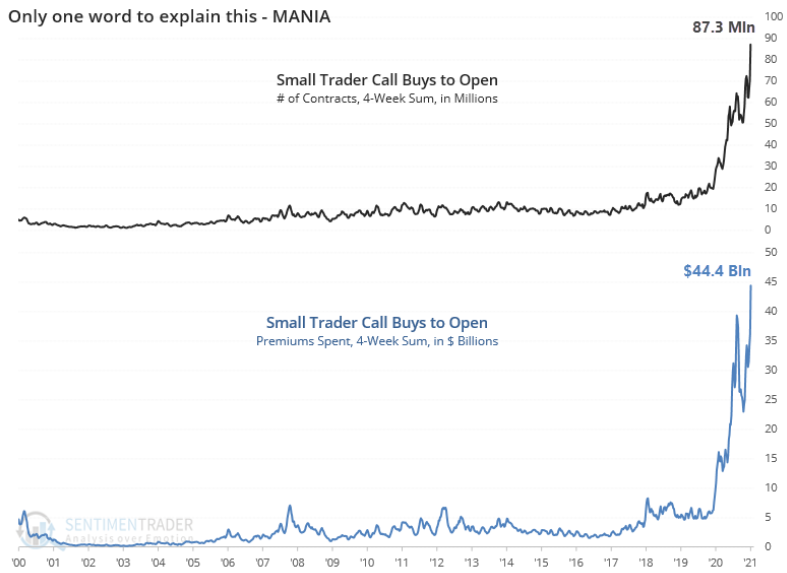
Figure 13 - Source: SentimenTrader/OCC
To explain the chart above, small traders have purchased more than 87 million call option contracts over the last four weeks and have spent more than $44 billion in the process. As you can see, the speculative behavior is unprecedented. Moreover, once the Delta/Gamma squeeze reverses, dealers (option sellers) will have more hedging shares to unload than ever before.
And as the speculation becomes more brazen by the day, the gap between the Russell 2000’s (a proxy for U.S. small caps) price and fundamentals has now reached epic proportions.
Please see below:
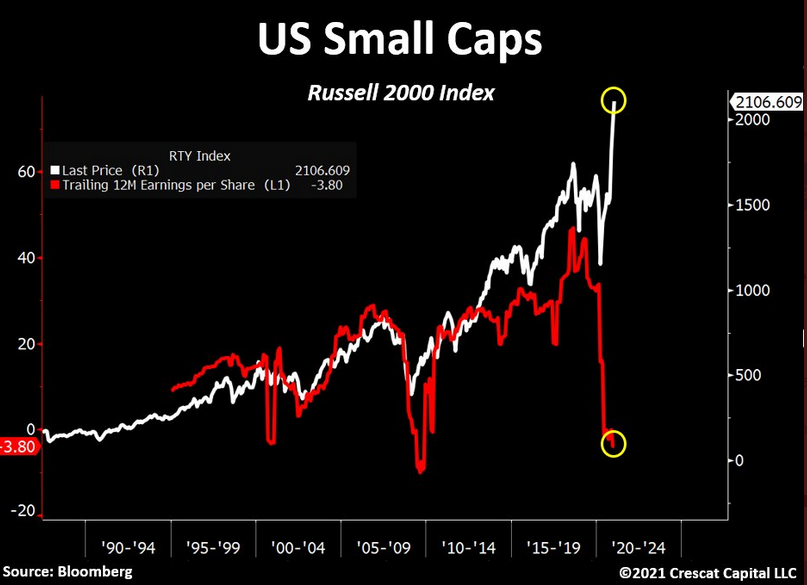
Figure 14
To explain, the white line above depicts the Russell 2000’s price (a vertical move higher), while the red line above depicts the consolidated trailing 12-month earnings per-share (EPS) of companies within the Russell 2000 index (a vertical move lower).
The bottom line?
U.S. equities continue to dance the night away, but once the party ends, the hangover will last for more than a few days. As a result, the PMs are likely to experience a similar headache.
Despite shrugging off the NASDAQ 100’s more than 2.0% decline on Jan. 29 (with silver’s effect already discussed), the PMs have a strong-to-moderate correlation with U.S. equities. Case in point: the previous six times that the NASDAQ 100 plunged by more than 2.0% in a single day, the PMs suffered mightily.
Please see below:
Figure 15
As a result, the short-term outlook remains bearish for the PMs. Despite WSB’s newfound fondness for silver – with the white metal’s strength helping to support the rest of the PMs on Jan. 29 and Feb. 1 – the Reddit board’s influence is unlikely to last. However, once the PMs complete their drawdown and gold displays prolonged strength relative to the USD Index, an attractive entry point will present itself.
Letters to the Editor
Q: This is good. You might be able to use it. Total stock market capitalization vs GDP on inauguration day of a new president: Ford: 40% Carter: 47% Reagan: 43% Bush I: 53% Clinton: 64% Bush II: 117% Obama: 60% Trump: 125% Biden: 190%. Yikes. GAME OVER. They have to spend $7.00 to get $1.00 of GDP growth
A: Thank you, and that’s yet another sign showing how excessive the situation on the stock market has become. It confirms other points made in today’s analysis and in the previous ones.
Q: I am short 2 silver futures. Do you recommend that I cover?
A: I can’t recommend any action – that would be investment advice. In particular, I don’t know many other factors that could contribute to one making a decision with regard to closing a position (that depends on you, and the ability and willingness to accept risk).
But do I think that silver already topped here? It might have, but I wouldn’t be so sure. When silver is soaring (and miners are not), the clearest thing is that this won’t last long. But, how high can silver temporarily go is relatively unclear. That’s one of the reasons I’m not featuring a short position in silver at this time – the temporary losses could be too big for one to handle, especially if they use futures contracts. I’d give it a 60% probability that silver has already formed its short-term top.
Q: I understand that you’re bearish on gold and silver short-term and the plan is to go long and add physical metals upon a broad market collapse or when gold bottoms at 1500-1700. However, based on the recent events and the potential short squeeze of silver, do you think a short-term rally and immediate play on SLV, PSLV, and/or AG would be advisable?
A: In general, no. This is connected with my reply to the previous question. Due to the volatility, the profit potential for silver and silver-related equities might be bigger than the one for mining stocks, but the risk is many times higher than the one associated with other mining stocks or ETFs.
As encouraging as the silver short squeeze story is right now, I don’t think that the silver market will be cornered anytime soon. If the USD Index is about to soar and the general stock market is about to decline, then it would be difficult to find a worse time for people to try to corner the silver market, similarly to how the Hunt Brothers tried to corner it years ago.
The cyclical forces right now appear to favor declines in the precious metals, especially in silver, so the buying pressure is likely to be well absorbed by the sellers. If not immediately, then relatively soon.
The nature of buyers is also an important thing to consider.
Those who dedicate a lot of time to study a given market, consider their investment goals and constraints, and plan to invest for the long run can be viewed as “strong hands” or “diamond hands” using modern parlance – they won’t sell just because of some temporary price decline even if the decline takes at least several months.
However, those that purchase based on something being the “hot thing” right now and just do a brief check on a given market without considering their investment objectives and constraints and without planning for the long run, can be described as “weak hands”. These people will likely run for the hills and sell their assets when they get too uncomfortable with short-term price declines, thus adding to the bearish forces.
Now, the vast majority of those who made purchases in the recent days are “weak hands”. This means that as the cycle causes the prices of silver to decline, they are likely to get out of the silver market, making the slide even more volatile.
If the people really wanted to succeed in pushing the price of silver much higher, they should be patient and act when they have the cycle on their side. That’s likely to happen after the next medium-term downswing is completed. Ideally, they should wait until silver is in the final part of the following upswing, when it will soar anyway. Then, adding fuel to the fire, could make a significant difference.
Q: Is there a long-term cup-and-handle pattern being formed in silver right now? The implications would be very bullish.
A: No, silver would need to move to about $50 first (creating the cup) and then decline somewhat (creating the handle). The “potential” cup-and-handle is nothing more than just that – a potential. If an incomplete formation would already be meaningful, it would be a formation by itself. So, right now, there are no bullish implications of the long-term cup-and-handle pattern in silver.
Overview of the Upcoming Part of the Decline
- I expect the initial bottom to form with gold falling to roughly $1,700, and I expect the GDX ETF to decline to about $31 - $32 at that time. I then plan to exit the short positions in the miners and I will consider long positions in the miners at that time – in order to benefit from the likely rebound.
I expect the above-mentioned decline to take another 1 – 6 weeks to materialize and I expect the rebound to take place during 1-3 weeks.
- After the rebound (perhaps to $33 - $34 in the GDX), I plan to get back in with the short position in the mining stocks.
- Then, after miners slide once again in a meaningful and volatile way, but silver doesn’t (and it just declines moderately), I plan to switch from short positions in miners to short positions in silver (this could take another 1-4 weeks to materialize). I plan to exit those positions when gold shows substantial strength relative to the USD Index, while the latter is still rallying. This might take place with gold close to $1,500 and the entire decline (from above $1,700 to about $1,500) would be likely to take place within 1-5 weeks and I would expect silver to fall hardest in the final part of the move. This moment (when gold performs very strongly against the rallying USD and miners are strong relative to gold – after gold has already declined substantially) is likely to be the best entry point for long-term investments in my view. This might happen with gold close to $1,500, but it’s too early to say with certainty at this time.
Consequently, the entire decline could take between 3 and 14 weeks, while the initial part of the decline (to $1,700 in gold) is likely to take between 1 and 6 weeks.
The above is based on the information available today and it might change in the following days/weeks.
Summary
To summarize, it might be the case that the next big short-term downswing has just begun as miners broke below the neck level of their almost-yearly head-and-shoulders formation and Thursday’s (Jan. 28) and Friday’s (Jan. 29) invalidation has “accidental” written all over it. The outlook for the precious metals sector remains bearish, especially when it seems that we are entering the “winter” part of the Kondratiev cycle. Silver’s strength seems bullish at first sight, but taking a closer look at this move, and comparing it with previous cases (when silver got so much attention) and with miners’ weakness, provides us with bearish implications for the medium term.
The things are likely to be VERY INTERESTING on the stock market in the following days, weeks, and months, and besides having important implications for the precious metals sector, stock price moves might be very important (and perhaps lucrative) if one gets additional insight into this sector.
Consequently, we’re enabling a special promotion for Matthew Levy’s, CFA Stock Trading Alerts – the first three weeks are for just $9. The subscription then renews normally, unless cancelled, which effectively means that you get to access Matthew’s up-to-date thoughts on the market for next to nothing, and if you don’t like what you’re getting, you can simply cancel the subscription. There are quite many “specialists” out there, most of them self-proclaimed (the “Robinhood investors” etc.), so it’s important to make sure that the information that one is getting come from a high-quality source.
Like your Editor (PR), Matthew is a CFA Charterholder, which means that he passed three rigorous exams (each one per year) demonstrating expertise in i.a. analysis, portfolio management & valuation, risk management and – most importantly – ethics. And it’s not just “theory” – far from it. As you can read in Matthew’s bio, he’s been managing and co-managing over $600MM in cumulative assets. Moreover, since he started publishing his analyses with us – which was on Nov. 30, 2020 – he’s made numerous good calls about the market. The great buy of the EWF ETF (Taiwan ETF) on Dec. 3 was one of them (at about $50, and it recently moved above $58). This promotion will only last a few days (today is the final day), so we encourage you to examine Matthew’s work at these preferred terms today.
As always, we'll keep you - our subscribers - informed.
To summarize:
Trading capital (supplementary part of the portfolio; our opinion): Full speculative short positions (300% of the full position) in mining stocks is justified from the risk to reward point of view with the following binding exit profit-take price levels:
Senior mining stocks (price levels for the GDX ETF): binding profit-take exit price: $32.02; stop-loss: none (the volatility is too big to justify a SL order in case of this particular trade); binding profit-take level for the DUST ETF: $28.73; stop-loss for the DUST ETF: none (the volatility is too big to justify a SL order in case of this particular trade)
Junior mining stocks (price levels for the GDXJ ETF): binding profit-take exit price: $42.72; stop-loss: none (the volatility is too big to justify a SL order in case of this particular trade); binding profit-take level for the JDST ETF: $21.22; stop-loss for the JDST ETF: none (the volatility is too big to justify a SL order in case of this particular trade)
For-your-information targets (our opinion; we continue to think that mining stocks are the preferred way of taking advantage of the upcoming price move, but if for whatever reason one wants / has to use silver or gold for this trade, we are providing the details anyway. In our view, silver has greater potential than gold does):
Silver futures downside profit-take exit price: unclear at this time - initially, it might be a good idea to exit, when gold moves to $1,703.
Gold futures downside profit-take exit price: $1,703
Long-term capital (core part of the portfolio; our opinion): No positions (in other words: cash
Insurance capital (core part of the portfolio; our opinion): Full position
Whether you already subscribed or not, we encourage you to find out how to make the most of our alerts and read our replies to the most common alert-and-gold-trading-related-questions.
Please note that we describe the situation for the day that the alert is posted in the trading section. In other words, if we are writing about a speculative position, it means that it is up-to-date on the day it was posted. We are also featuring the initial target prices to decide whether keeping a position on a given day is in tune with your approach (some moves are too small for medium-term traders, and some might appear too big for day-traders).
Additionally, you might want to read why our stop-loss orders are usually relatively far from the current price.
Please note that a full position doesn't mean using all of the capital for a given trade. You will find details on our thoughts on gold portfolio structuring in the Key Insights section on our website.
As a reminder - "initial target price" means exactly that - an "initial" one. It's not a price level at which we suggest closing positions. If this becomes the case (like it did in the previous trade), we will refer to these levels as levels of exit orders (exactly as we've done previously). Stop-loss levels, however, are naturally not "initial", but something that, in our opinion, might be entered as an order.
Since it is impossible to synchronize target prices and stop-loss levels for all the ETFs and ETNs with the main markets that we provide these levels for (gold, silver and mining stocks - the GDX ETF), the stop-loss levels and target prices for other ETNs and ETF (among other: UGL, GLL, AGQ, ZSL, NUGT, DUST, JNUG, JDST) are provided as supplementary, and not as "final". This means that if a stop-loss or a target level is reached for any of the "additional instruments" (GLL for instance), but not for the "main instrument" (gold in this case), we will view positions in both gold and GLL as still open and the stop-loss for GLL would have to be moved lower. On the other hand, if gold moves to a stop-loss level but GLL doesn't, then we will view both positions (in gold and GLL) as closed. In other words, since it's not possible to be 100% certain that each related instrument moves to a given level when the underlying instrument does, we can't provide levels that would be binding. The levels that we do provide are our best estimate of the levels that will correspond to the levels in the underlying assets, but it will be the underlying assets that one will need to focus on regarding the signs pointing to closing a given position or keeping it open. We might adjust the levels in the "additional instruments" without adjusting the levels in the "main instruments", which will simply mean that we have improved our estimation of these levels, not that we changed our outlook on the markets. We are already working on a tool that would update these levels daily for the most popular ETFs, ETNs and individual mining stocks.
Our preferred ways to invest in and to trade gold along with the reasoning can be found in the how to buy gold section. Furthermore, our preferred ETFs and ETNs can be found in our Gold & Silver ETF Ranking.
As a reminder, Gold & Silver Trading Alerts are posted before or on each trading day (we usually post them before the opening bell, but we don't promise doing that each day). If there's anything urgent, we will send you an additional small alert before posting the main one.
Thank you.
Przemyslaw Radomski, CFA
Founder, Editor-in-chief

