
tools spotlight

-
Stocks Mayhem: Is Evergrande a Perfect Scapegoat?
September 21, 2021, 9:23 AMEvergrande. The topic everyone requested me to cover, so I will. But before I do, I would like to emphasize that I’ve been writing about it for months. No, not about Evergrande per se, but about the situation being similar to 2008. The exact trigger and the name of the company are not really relevant. What is important is that the storm has been brewing for some time, and now, when we finally see the straw that broke the camel’s neck, it seems like a game-changer. But it’s not a game-changer. It’s a milestone telling us that the game is going very similarly to how it was played 13 years ago (in 2008).
Can the markets repeat both previous patterns at the same time (2008 and 2013)? Sure, why not. The history doesn’t repeat itself to the letter, it rhymes instead. And the current rhyme is somewhat similar to both previous situations.
Previously, gold and gold stocks have been quite clear with the repeat of their respective 2011-2013 price actions. The USD Index is moving steadily (with corrections) higher this year, also similarly to what we saw then.
However, if the general stock market is about to plunge, then we might lean more toward its 2008 counterpart, as that was the key thing on the charts at that time (as far as the main markets are concerned). The USD Index soared at that time, which might happen this time as well. But the most important implication from the point of view of a precious metals investor and trader is the dramatic slide in mining stocks and in silver that we saw in 2008. Yes, I’ve been repeating that these two parts of the precious metals sector were likely to fall the most (perhaps miners first, silver a bit later – a’la 2020), but what we’re seeing now in the general stock market and what kind of news accompanies it (major bankruptcy threat related to the real estate market) has 2008 written all over it.
The Plunge Protection Team
And yet, there is one thing I haven’t considered previously that hit me today regarding Evergrande. There is something different this time that makes the declines in stocks and the precious metals sector (especially silver, gold stocks, and silver stocks) even more likely.
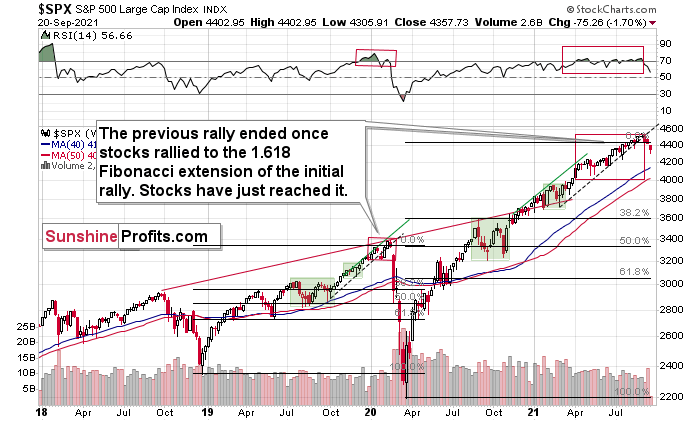
One might say that the thing that prevented the stock market from declining was the rising dashed line. Or the 50-day moving average. And they have likely indeed played an important part on a technical level. But the thing that really prevented the stock market from declining was… the issue of blame.
You know, it’s not rocket science that the stock markets are overheated. There are myriads of indicators pointing to the overbought status, and I’ve been featuring them for months. Furthermore, the authorities know that.
Earlier this year, the largest U.S. banks had to prove that they would be able to withstand a 55% crash in the stock market. Interesting, right? Of course, one could say that it was just a normal precautionary test, irrelevant to the authorities knowing that stocks will need to crash eventually.
If the Powers That Be know that stocks have to crash and that banks can take it, then it’s safe to let the markets do their thing, right?
Wrong. People might put the blame on those Powers, and the Powers wouldn’t like that, as they like votes, power, money, and such. Blame doesn’t go well with those.
So, if there is indeed the “Plunge Protection Team” that’s been actively working on keeping the stock market afloat until it’s obvious that the blame can be placed somewhere else, ideally on a political adversary, then they just had their dreams fulfilled.
The Evergrande Group – a Chinese real estate developer – is a perfect scapegoat here. Of course, the real reason that the stock markets got too high practically all over the world is caused by excessive money printing / stimulus of all kinds. But from the political point of view, it can now be narrated to be someone else’s fault.
“Yes, folks, it’s very unfortunate that you lost your retirement money, and your kids will have trouble finding jobs in this stagflation… But it’s all because of China! We did all we could, but they caused all this – we couldn’t prevent it despite all our best efforts. Good luck to you and vote for us again so that we may fight for your rights and your financial safety on your behalf!”
Or something along those lines. That’s what the narrative might be once the stock markets crash globally and once the real-life implications kick in.
I’m not sure if anyone already called it “the Chinese crisis”, but if not, please mark it in your calendars that I’m forecasting today (Sep. 21, 2021) that this name will emerge sooner or later. Also, please keep in mind that months ago, I wrote that bitcoin was topping (at least in the medium term) at about $50,000. It then moved higher somewhat, but overall, it seems that we’re seeing a broad top in this market. The rising USDX is unlikely to help it, either way.
Also, please don’t get me wrong. I’m not “cheering for China” here, defending China, etc. In fact, I’m not cheering at all. I’m just analyzing the situation as realistically (perhaps even “brutally”) as I can, and I’m reporting my findings to you, along with discussing the implications for the precious metals sector.
And the implications for the precious metals sector of the above are very bearish.
Where Are the Metals Headed?
Now, on a short-term basis, the reactions might be relatively chaotic, as on one hand, the situation getting out of hand might trigger safe-haven buying for gold, and on the other hand, it might trigger safe-haven buying for the USD Index. This might trigger quite many erratic price swings in the short run.
Gold moved higher by $12 yesterday, but this move seems to have just been a breather after a powerful daily decline.
Why? Because gold miners are confirming their breakdown and they completely ignored gold’s rally, for instance.
The GDX ETF closed below the previous 2021 lows for the second consecutive trading day. If we get a daily close below these lows today, the breakdown will be fully confirmed, and the road to new lows will be fully open.
Just as I wrote previously, the outlook for the precious metals market remains extremely bearish for the next several months.
Junior miners moved lower yesterday, catching up with the GDX’s decline. The GDXJ didn’t close below the August lows yet, but it’s very close to them. The outlook for the junior mining stocks remains very bearish, especially given the likely declines in the general stock market. Remember how profoundly juniors plunged in 2020 when the general stock market declined? In my view, we’ll likely see something similar also this time.
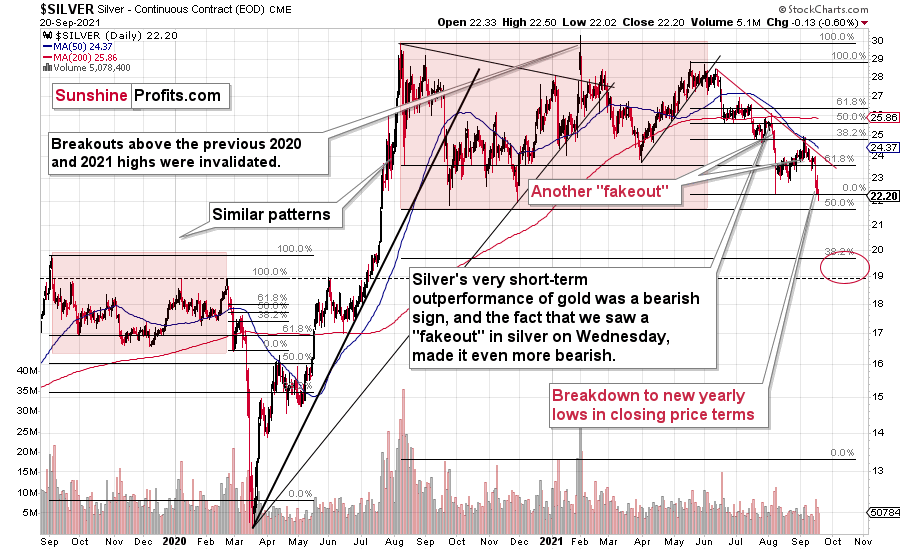
In yesterday’s analysis, I wrote that silver moved to a new yearly low in terms of the daily closing prices. This move was confirmed, and the bearish outlook was emphasized by the move to new intraday 2021 lows. The losses of those who purchased silver close to its yearly top are now very significant. And it’s going to get worse, as silver is likely to decline more – likely much more – before it rallies back up.
The USD Index suggests caution in the very short term, as it reversed before the end of yesterday’s session, and it did so after moving to its March highs.

Indeed, the USD Index is declining in today’s pre-market trading. But does it change much? It doesn’t. Even if the USD Index declines a bit here (and PMs move a bit higher), it’s still likely to soar soon (and PMs are likely to plunge soon).
The long-term USD Index chart and the analogy to its previous performance after mid-year bottoms continue to have bullish implications for the medium term. In particular, the analogies to 2014 and 2008 are particularly bullish.
Thank you for reading our free analysis today. Please note that the above is just a small fraction of the full analyses that our subscribers enjoy on a regular basis. They include multiple premium details such as the interim targets for gold and mining stocks that could be reached in the next few weeks. We invite you to subscribe now and read today’s issue right away.
Sincerely,
Przemyslaw Radomski, CFA
Founder, Editor-in-chief -
USD Bears Are Fresh Out of Honey Pots
September 20, 2021, 9:31 AMThe declining medium-term outlook for gold, silver, and mining stocks will eat away at the honey pot of US dollar bears. Get ready for bee stings.
With headline after headline attempting to knock the USD Index off of its lofty perch, I warned on Sep. 13 that dollar bears will likely run out of honey sooner rather than later.
I wrote:
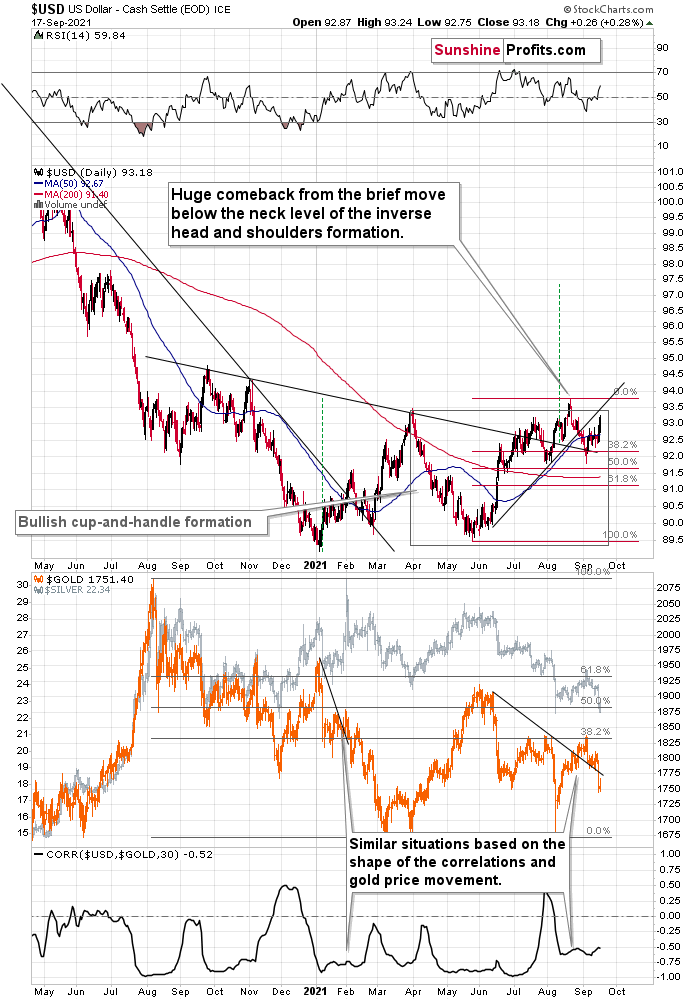
While the USD Index was under fundamental fire in recent weeks, buyers eagerly hit the bid near the 38.2% Fibonacci retracement level. And after positive sentiment lifted the greenback back above the neckline of its inverse (bullish) head & shoulders pattern last week, the USDX’s medium-term outlook remains profoundly bullish.
More importantly, though, after the USD Index rallied by 0.63% last week and further validated its bullish breakout, gold, silver, and mining stocks ran in the opposite direction. And with the divergence likely to accelerate over the medium term, the swarm should sting the precious metals during the autumn months.
Please see below:
Conversely, if the USD Index encounters resistance as it attempts to make a new 2021 high, gold, silver, and mining stocks could enjoy an immaterial corrective upswing. However, the optimism will likely be short lived, and it’s likely a matter of when, not if, the USD Index reaches the illustrious milestone.
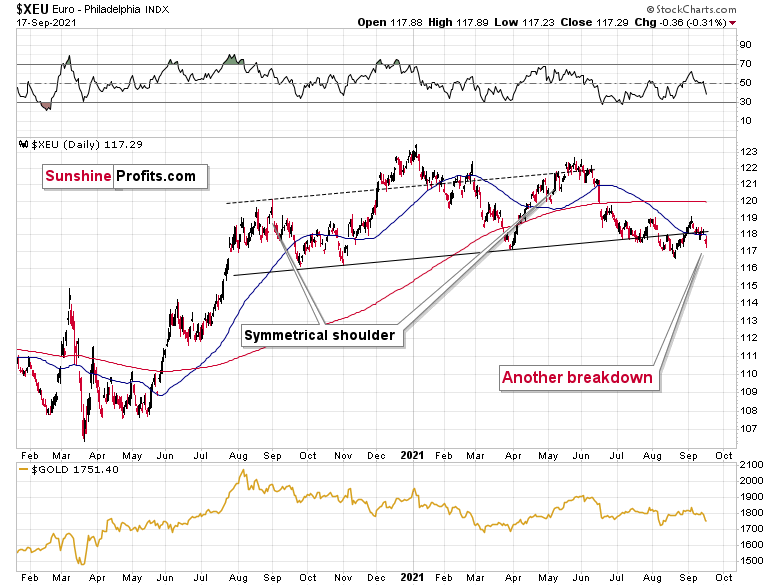
Equally bullish for the greenback, with the USD Index’s technical strength signaling an ominous ending for the Euro Index, I warned on Sep. 13 that the latter faced a tough road ahead.
I wrote:
While I have less conviction in the Euro Index’s next move relative to the USD Index, more likely than not, the Euro Index should break down once again and the bearish momentum should resume over the medium term.
And after the Euro Index sunk below the neckline of its bearish head & shoulders pattern last week, lower lows remains the most likely outcome over the medium term.
Please see below:
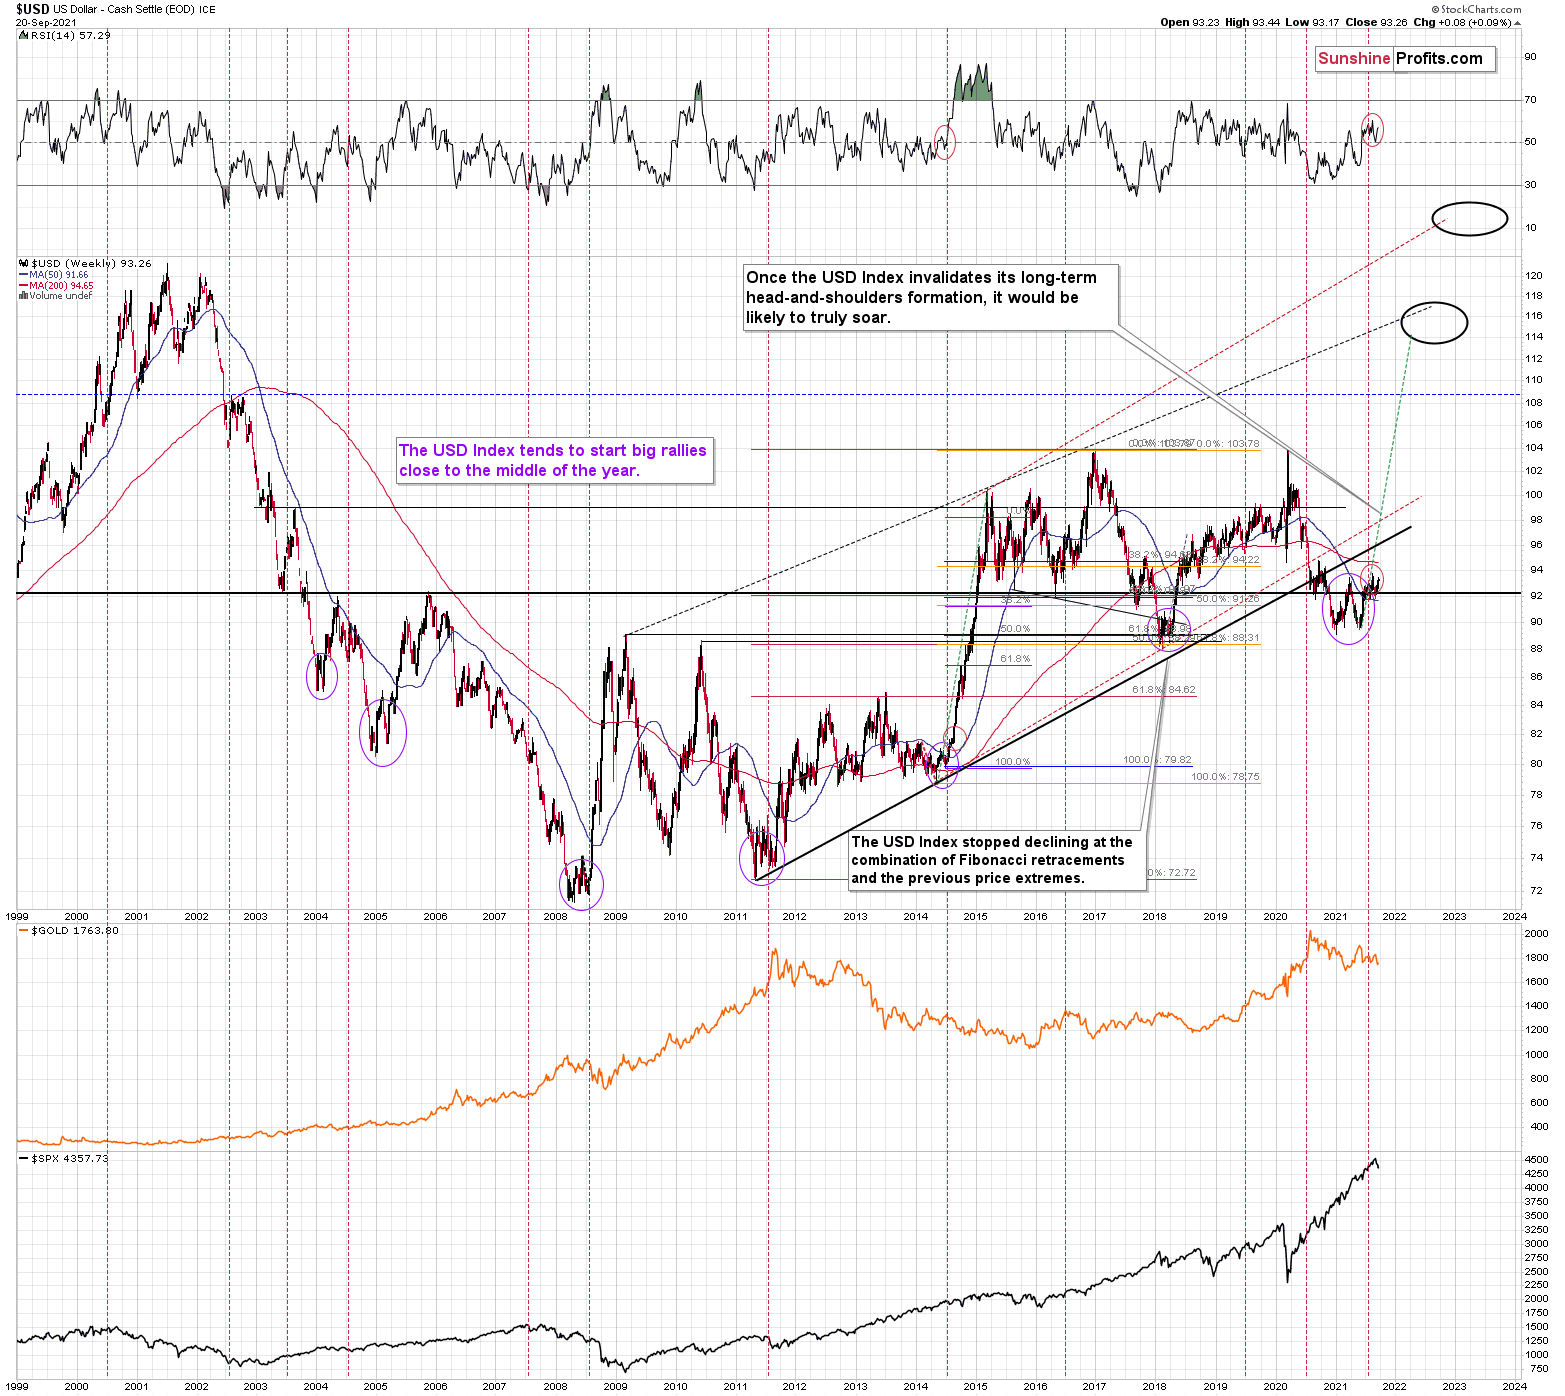
Adding to our confidence (don’t get me wrong, there are no certainties in any market; it’s just that the bullish narrative for the USDX is even more bullish in my view), the USD Index often sizzles in the summer sun and major USDX rallies often start during the middle of the year. Summertime spikes have been mainstays on the USD Index’s historical record and in 2004, 2005, 2008, 2011, 2014 and 2018 a retest of the lows (or close to them) occurred before the USD Index began its upward flights (which is exactly what’s happened this time around).
Furthermore, profound rallies (marked by the red vertical dashed lines below) followed in 2008, 2011 and 2014. With the current situation mirroring the latter, a small consolidation on the long-term chart is exactly what occurred before the USD Index surged in 2014. Likewise, the USD Index recently bottomed near its 50-week moving average; an identical development occurred in 2014. More importantly, though, with bottoms in the precious metals market often occurring when gold trades in unison with the USD Index (after ceasing to respond to the USD’s rallies with declines), we’re still far away from that milestone in terms of both price and duration.
Moreover, as the journey unfolds, the bullish signals from 2014 have resurfaced once again. For example, the USD Index’s RSI is hovering near a similar level (marked with red ellipses), and back then, a corrective downswing also occurred at the previous highs. More importantly, though, the short-term weakness was followed by a profound rally in 2014, and many technical and fundamental indicators signal that another reenactment could be forthcoming.
Please see below:
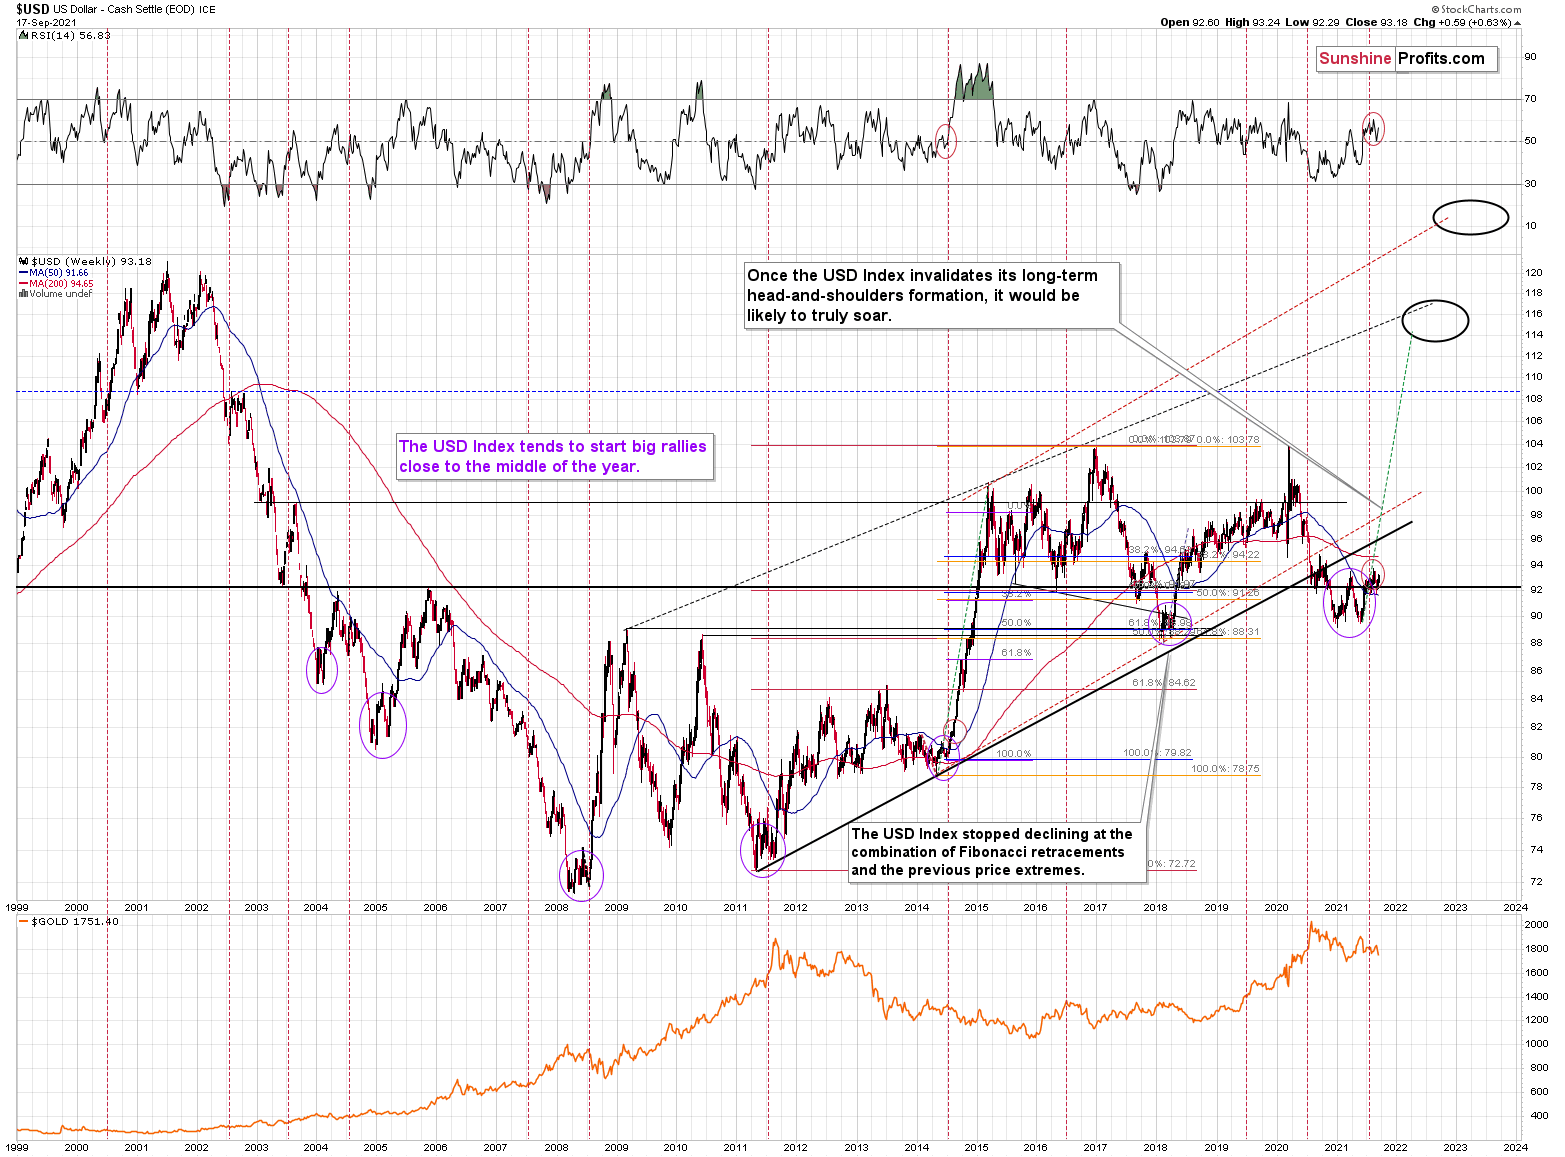
Just as the USD Index took a breather before its massive rally in 2014, it seems that we saw the same recently. This means that predicting higher gold prices (or the ones of silver) here is likely not a good idea.
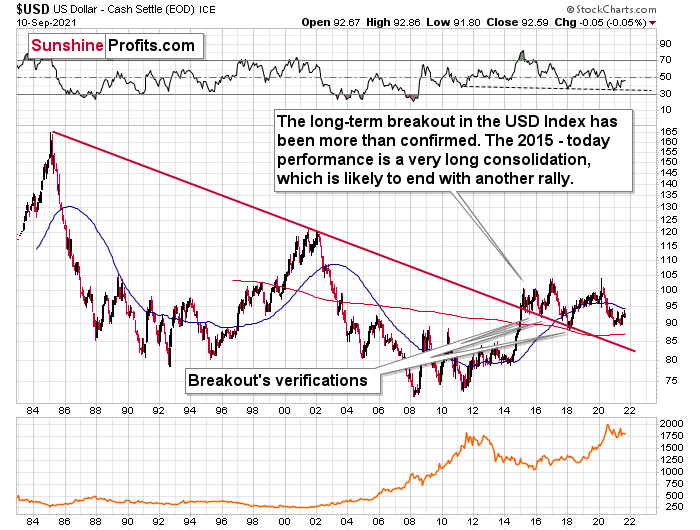
Continuing the theme, the eye in the sky doesn’t lie. And with the USDX’s long-term breakout clearly visible, the wind still remains at the greenback’s back.
Please see below:
The bottom line?
Once the momentum unfolds, ~94.5 is likely the USD Index’s first stop, ~98 is likely the next stop after that, and the USDX will likely exceed 100 at some point over the medium or long term. Keep in mind though: we’re not bullish on the greenback because of the U.S.’ absolute outperformance. It’s because the region is fundamentally outperforming the Eurozone, the EUR/USD accounts for nearly 58% of the movement of the USD Index, and the relative performance is what really matters.
In conclusion, the USD Index’s sweet performance left sour tastes in the precious metals’ mouths. And with the former’s bullish breakout signaling an ominous future for the latter, gold, silver, and mining stocks will likely confront new lows over the medium term. However, once the autumn months fade and the winter weather approaches, buying opportunities may present themselves. And with unprecedented monetary and fiscal policy likely to underwrite new highs in the coming years, the long-term outlook for gold, silver, and mining stocks remains extremely bright.
Thank you for reading our free analysis today. Please note that the above is just a small fraction of the full analyses that our subscribers enjoy on a regular basis. They include multiple premium details such as the interim targets for gold and mining stocks that could be reached in the next few weeks. We invite you to subscribe now and read today’s issue right away.
Sincerely,
Przemyslaw Radomski, CFA
Founder, Editor-in-chief -
Gold Downturn: Why Strong Fundamentals Are Not Everything
September 17, 2021, 9:23 AMSo much money printed. Excessive debt. Even pandemic! And gold failed to hold gains. But that’s how markets work, no matter what gold permabulls say.
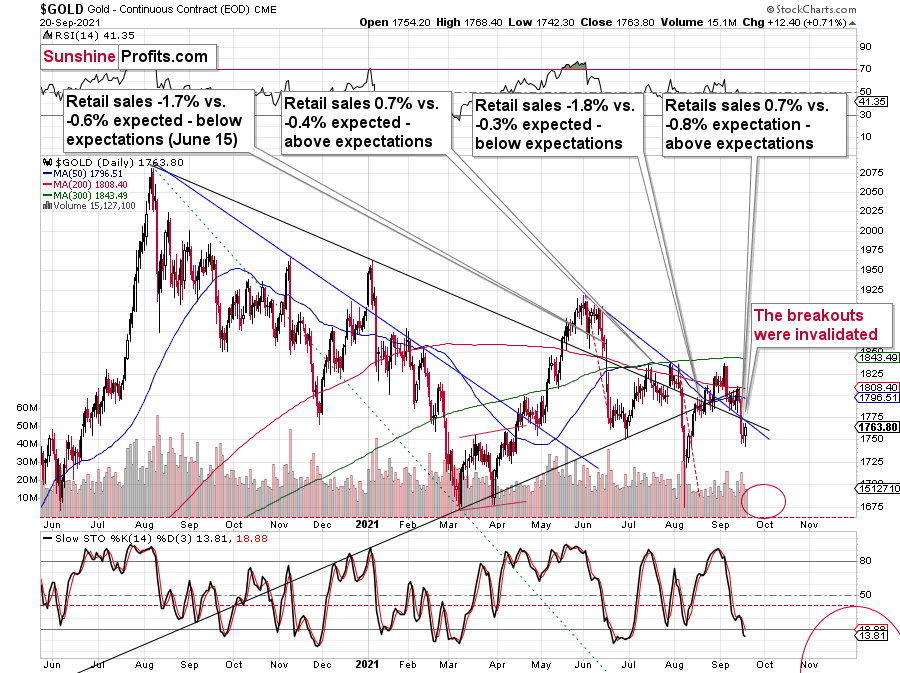
Gold plunged yesterday, just as it was likely to. The fake reason? U.S. retail sales exceeded expectations. The real reason? A major downtrend.

On the above gold chart, I added annotations that show what happened in the previous 3 cases after the retail sales reports. We saw the following:
- gold declined after retail sales disappointed in June
- gold topped after retail sales outperformed in July
- gold paused its rally after retail sales disappointed in August
- gold declined after retail sales outperformed in September
What should one make of that?
Nothing.
There is no clear link (and perhaps no link whatsoever) between U.S. retail sales and the price of gold. If gold had declined based only on great retail sales, then it surely should have soared based on disappointing retails sales in June, right? It plunged then.
For many weeks, months, and years, I’ve been writing that markets don’t need a trigger to move in a certain way. Getting one could speed things up, but the markets might eventually rally or decline on just about any piece of news, provided that they really “want to”. By markets “wanting” to move in a given way, I mean the fact that markets move in trends and cycles, and even if a given market has a very favorable fundamental situation for the long run, it doesn’t mean that it won’t slide in the short or medium term. That’s how markets work, and that’s been the case for decades, regardless of what gold permabulls might tell you.
Let’s face it, the monetary authorities around the world are printing ridiculous amounts of money, stagflation is likely next, and gold is extremely likely to soar based on that in the following years, just like what we saw in the 1970s.
But.
This is already the case – lots of money has been already printed, and the world has been suffering from the pandemic for well over a year. Gold should be soaring in this environment! Silver should be soaring! Gold stocks should be soaring too!
And what’s the reality?
Gold failed to hold its gains above its 2011 highs. Can you imagine that? So much money printed. Excessive debts. Even pandemic! And gold still failed to hold gains above its 2011 highs. If this doesn’t make you question the validity of the bullish narrative in the medium term in the precious metals sector, consider this:
Silver – with an even better fundamental situation than gold – wasn’t even close to its 2011 highs (~50). The closest it got to this level was a brief rally above $30. And now, after even more money was printed, silver is in its low 20s.
And gold stocks? Gold stocks are not above their 2011 highs, they were not even close. They were not above their 2008 highs either. In fact, the HUI Index – the flagship proxy for gold stocks – is trading below its 2003 high! And that’s in nominal prices. In real prices, it’s even lower. Just imagine how weak the precious metals sector is if the part of the sector that is supposed to rally first (that’s what we usually see at the beginning of major rallies) is underperforming in such a ridiculous manner.
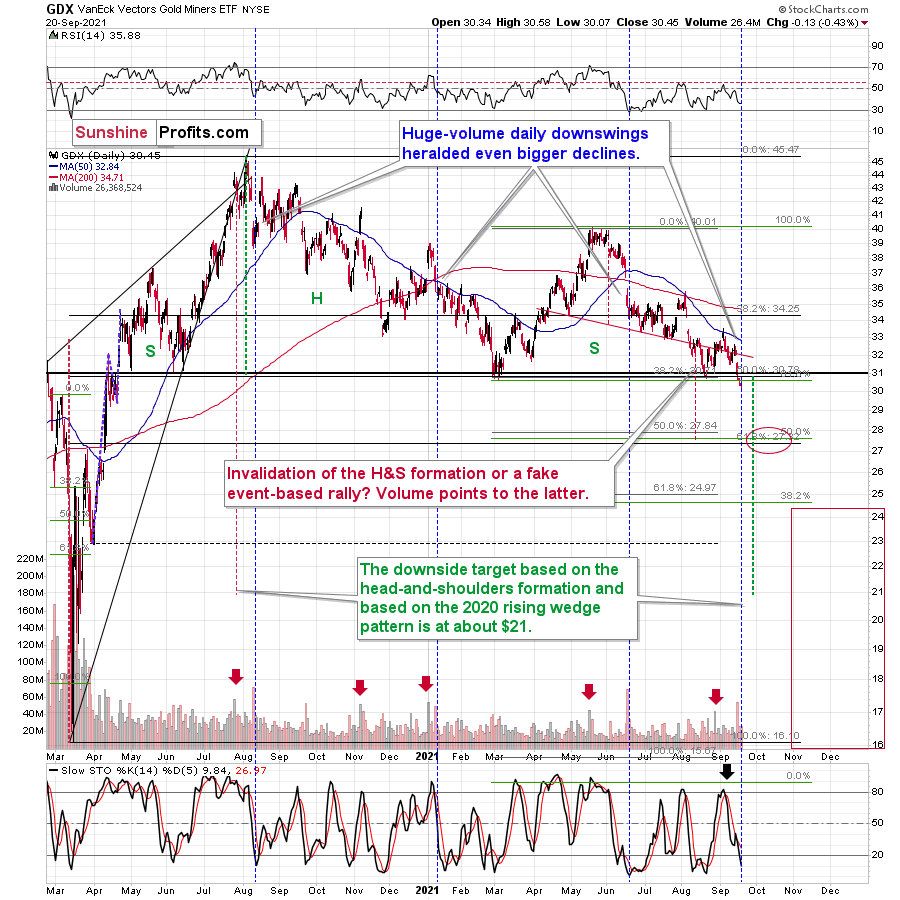
And that’s just the beginning of the decline in the mining stocks.
More to Come!
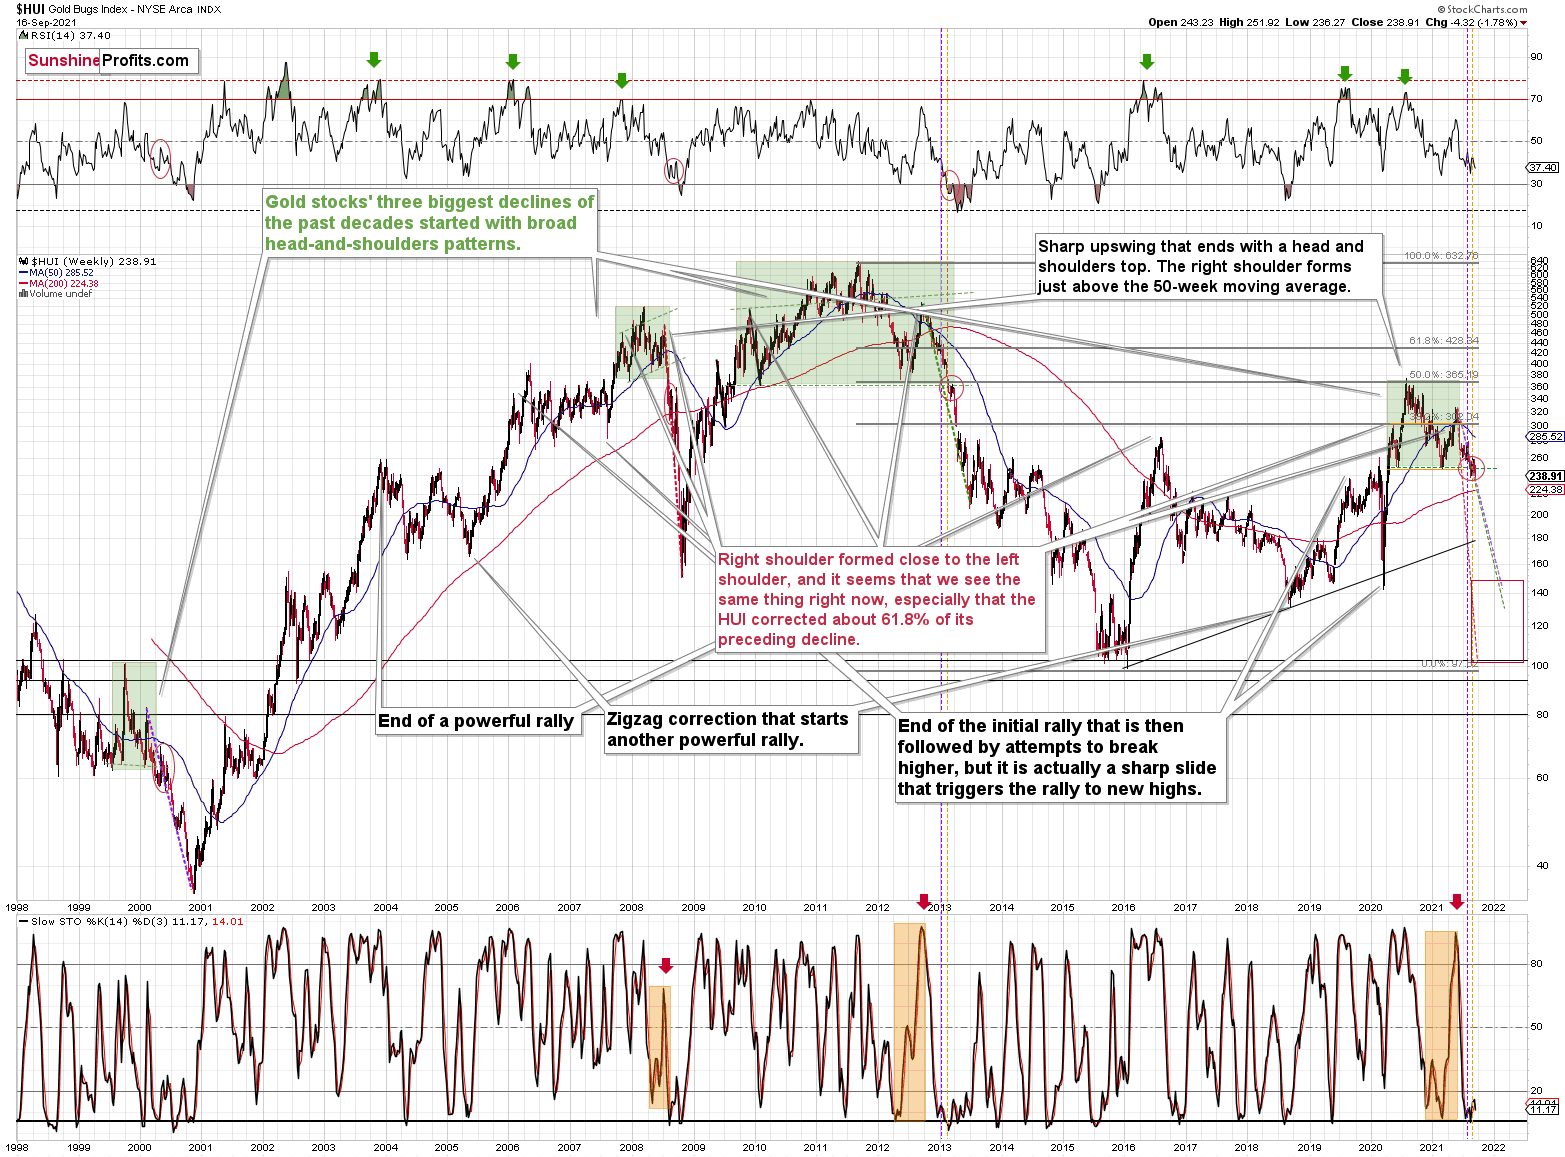
The breakdown below the broad head and shoulders pattern (marked with green) was verified. The previous three similar patterns (also marked with green) were followed by huge declines, and I copied the moves to the current situation (marked with dashed lines). This simple analogy tells us that the HUI Index could slide to the 100 – 150 range, meaning that it could even decline to its early 2016 low.
Can it really happen? With the precious metals market as weak as it is right now (from the medium-term point of view, not the long-term one) — of course.
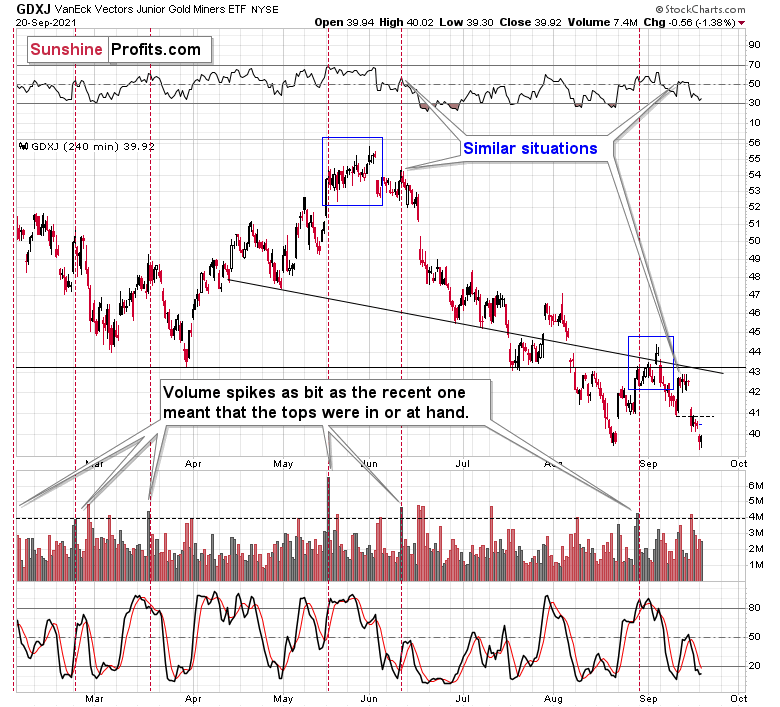
On a short-term note, please take a look at what silver just did.
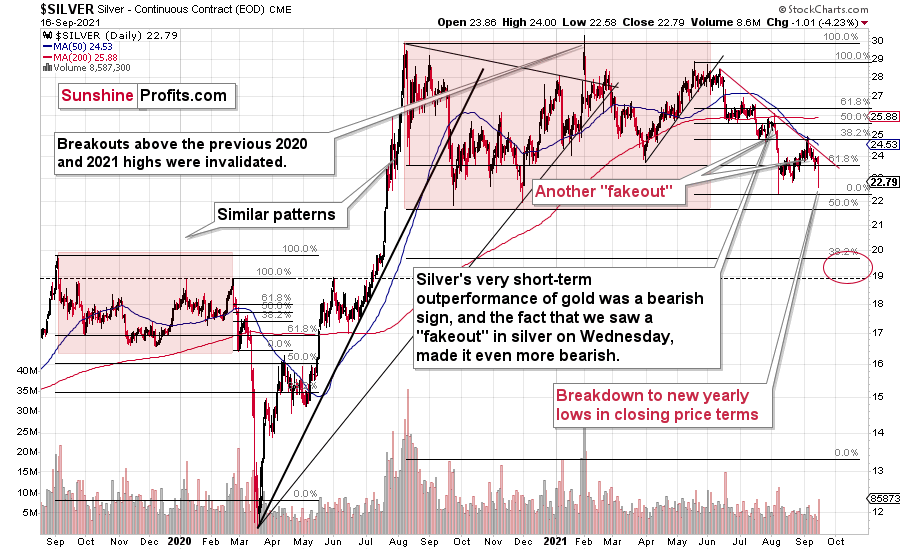
It broke to new 2021 lows in terms of the closing prices. Indeed, back in August, silver’s intraday low was lower, but it didn’t close as low. That’s a major confirmation of the bearish price forecast for silver.
Thank you for reading our free analysis today. Please note that the above is just a small fraction of the full analyses that our subscribers enjoy on a regular basis. They include multiple premium details such as the interim targets for gold and mining stocks that could be reached in the next few weeks. We invite you to subscribe now and read today’s issue right away.
Sincerely,
Przemyslaw Radomski, CFA
Founder, Editor-in-chief -
Gold & Silver Trading Alert #2 – Video Commentary
September 16, 2021, 12:57 PMAvailable to premium subscribers only.
-
Will Fed Give US Dollar the Green Light?
September 16, 2021, 8:03 AMAfter the U.S. Consumer Price Index (CPI) soared by 5.3% year-over-year (YoY) on Sep. 14, investors celebrated the news due to the perceived impact on the Fed. To explain, accelerating inflation could expedite the Fed’s taper timeline and force the central bank to raise interest rates much sooner than expected. However, when inflation is perceived as peaking, investors price in more patience from the Fed and the optimism helps uplift the PMs.
However, it’s an illusory state of happiness. For example, the S&P Goldman Sachs Commodity Index (S&P GSCI) closed at a new 2021 high on Sep. 15. For context, the S&P GSCI contains 24 commodities from all sectors: six energy products, five industrial metals, eight agricultural products, three livestock products and two precious metals.
Please see below:
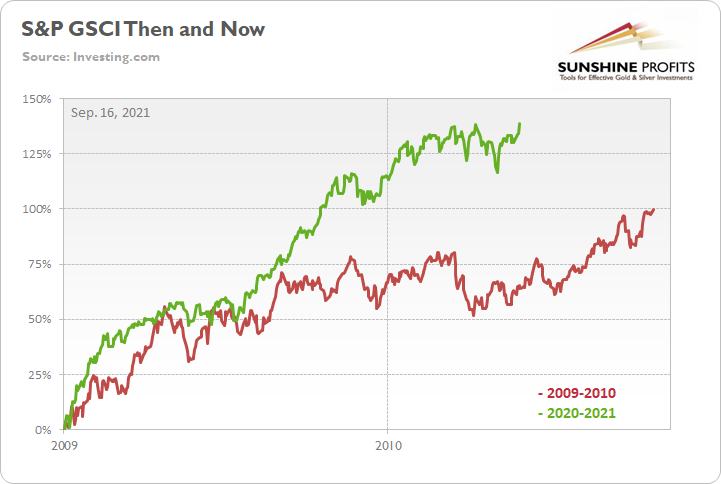
To explain, the green line above tracks the S&P GSCI’s current rally off of the bottom, while the red line above tracks the S&P GSCI’s rally off of the bottom in 2009-2010 (following the global financial crisis). If you analyze the middle of the chart, you can see that the S&P GSCI has completely run away from the 2009-2010 analogue. For context, at this point in 2009-2010, the S&P GSCI had rallied by 65% off of the bottom. However, as of the Sep. 15 close, the S&P GSCI has now rallied by 139% off of the April 2020 bottom.
Furthermore, while I’ve been warning for months that speculation in the commodities market is the main driver of the inflationary surge, proclamations of $100 oil are mutually exclusive to the Fed achieving its dual mandate.
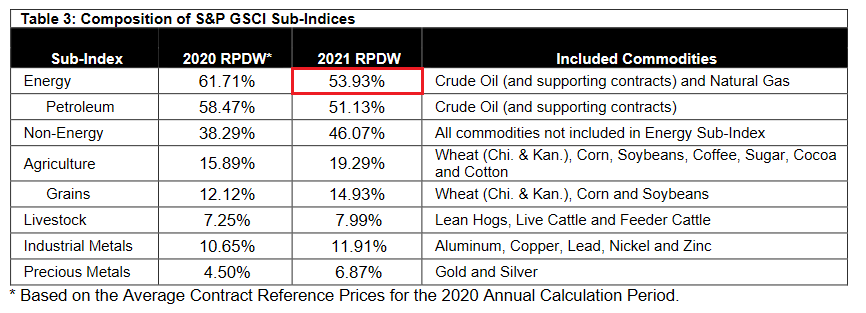
To explain, the weighting of the S&P GSCI is of immense importance. With energy accounting for roughly 54% of the index’s movement (the red box below), WTI – which is up by 4.15% this week and up by 6% since the beginning of September – is trading like the Fed is on hold. However, while investors want to have their cake and eat it too, higher commodity prices will only increase the inflationary momentum and put more pressure on the Fed to act.
Please see below:
 Source: S&P Global
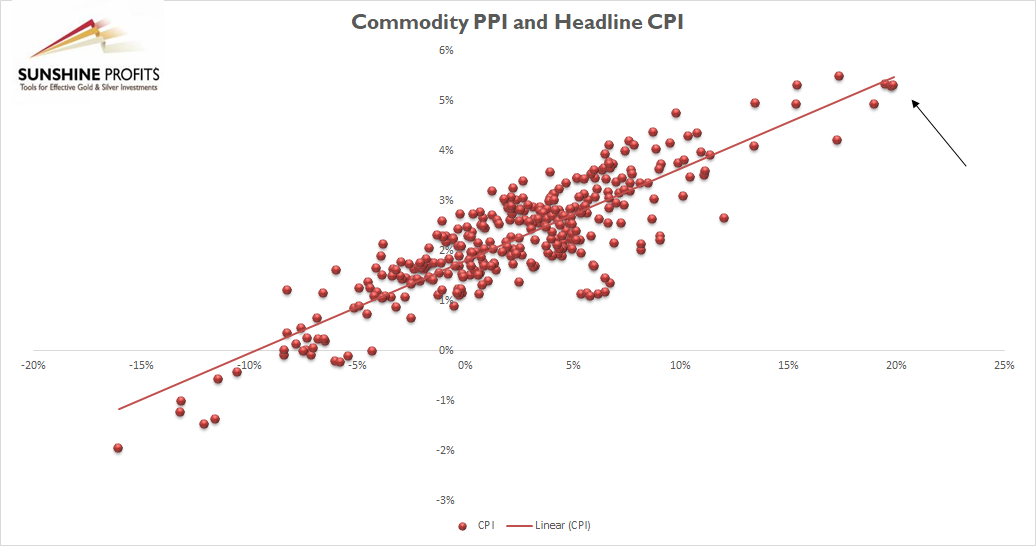
To that point, the S&P GSCI declined by roughly 2.5% in August. As a result, it’s no coincidence that inflationary pressures calmed once commodity prices stopped rising. For context, ‘calmed’ is quite inaccurate. However, since 5.3% YoY inflation seems to pass for good news these days, we’ll oblige. Looking ahead, though, the S&P GSCI has already risen by more than 3% in September. And if the monthly strength continues, higher prices should put upward pressure on the Commodity Producer Price Index (PPI) and reignite cost-push inflation’s impact on the U.S. economy.
For context, I highlighted on Sep. 15 that the PPI/CPI relationship remains on trend:
As further evidence, while proponents of the “transitory” narrative cite used cars & trucks, lodging away from home and airfares as items that will mean revert (we agree), reopening components actually fell in August while the overall CPI remained elevated.
Please see below:
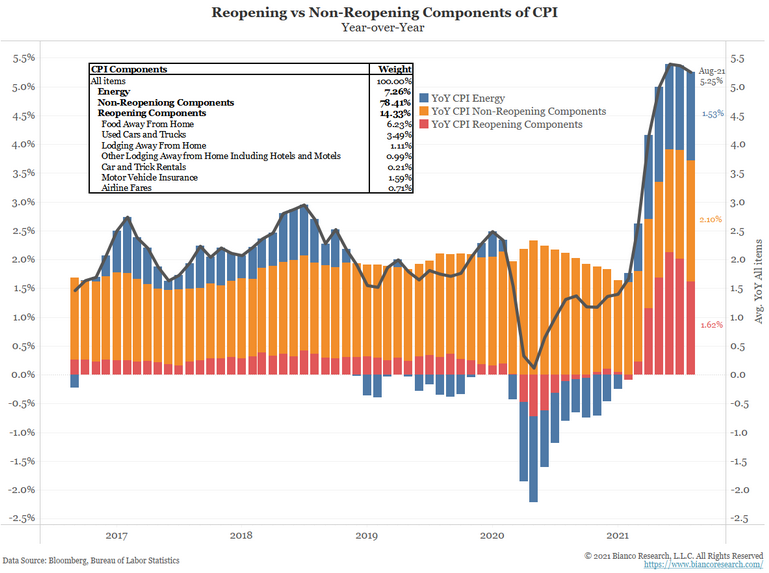
To explain, the blue (energy), orange (non-reopening) and red (reopening) bars above segregate the various contributors to the headline CPI. If you analyze the right side of the chart, you can see that reopening components peaked in June and have come down. Conversely, if you focus your attention on the blue bars, notice how energy accounts for roughly one-third of the headline CPI and its share actually increased in August? Furthermore, the blue bars don’t account for the inflationary contributions of industrial metals, agricultural commodities, plastics, or shipping costs (which are at all-time highs). As a result, even if the reopening metrics begin to fade, higher commodity prices and prospective rent inflation should add upward pressure to the headline CPI over the medium term.
Decomposing the former, with the Delta variant surging since late July, social activities have been the hardest hit. And after the entire reopening basket declined month-over-month (MoM) in August, progress on the health front could reverse that decline in the future.
Please see below:
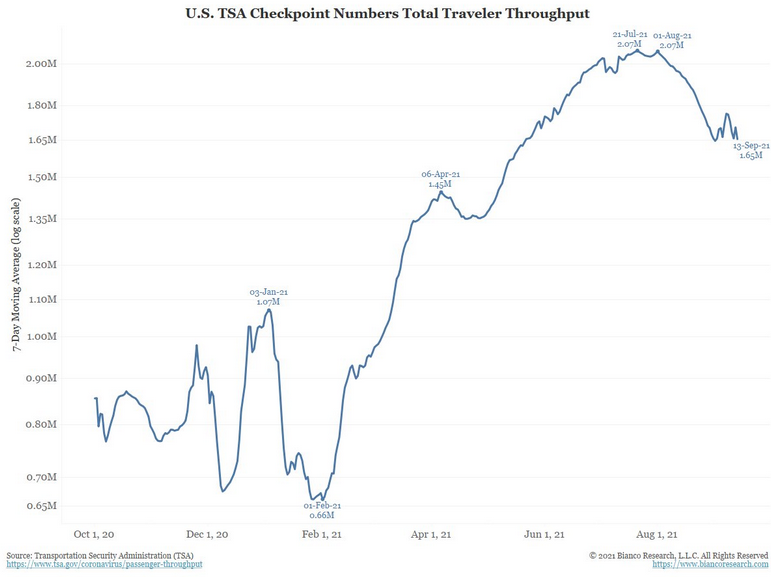
To explain, the blue line above tracks the seven-day moving average of U.S. airport traffic. If you analyze the right side of the chart, you can see that traveler demand peaked when the Delta variant surged and has rolled over ever since. Thus, it’s no surprise that airfares also declined. However, if (once) the Delta variant fades, travel demand should re-accelerate and airlines will likely raise prices again. Summing up, while we consider the reopening basket an immaterial piece of the inflationary puzzle, further declines in “transitory” components still seems unlikely at this point.
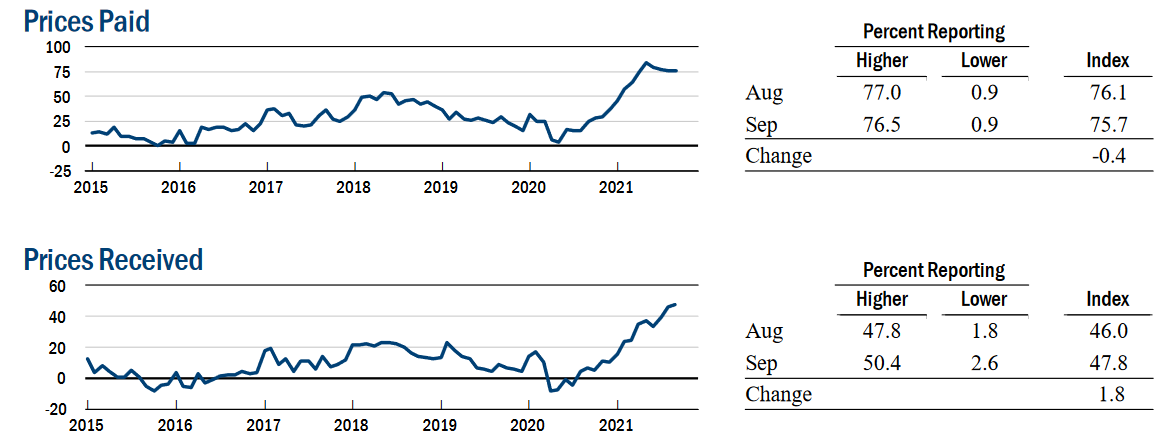
Moving on, the New York Fed released its Empire State Manufacturing Survey on Sep. 15. And after plunging in August, the headline index increased from 18.30 to 34.30 in September. Moreover, checking off all of the Fed’s boxes, the report revealed:
“New orders, shipments, and unfilled orders all increased substantially. The delivery times index reached a record high. Labor market indicators pointed to strong growth in employment and the average workweek…. Looking ahead, firms remained very optimistic that conditions would improve over the next six months, and capital spending and technology spending plans increased markedly.”
More importantly, though:
“The prices paid index held steady at 75.7, and the prices received index edged up two points to 47.8, marking its third consecutive record high.”
Please see below:
 Source: New York Fed
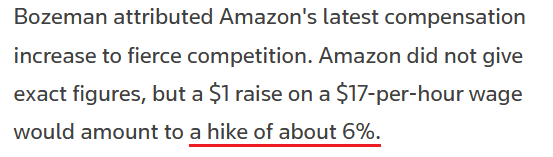
On top of that, while input and output inflation remains the talk of the town, wage inflation is still on the up and up. And after Walmart (the largest employer in the U.S) announced a wage increase on Sep. 2, Amazon (the second-largest employer in the U.S.) followed suit on Sep. 15 and said that its average starting wage will increase to more than $18 per hour. Moreover, the company plans to hire another 125,000 warehouse and transportation workers to prepare for the holiday season.
Please see below:
 Source: Reuters
Finally, with inflation surging and the Fed’s patience exasperating the problem, the only way for inflation to prove “transitory” is for the Fed to strengthen the U.S. dollar and reduce the incentive for investors to bid up commodity prices. If not, the dovish rhetoric will only accelerate commodities’ fervor and the cost-push inflationary spiral will continue. However, while Chairman Jerome Powell may come across as slow-witted, he likely understands what’s happening. And with political survival often a motivator of policy initiatives, inflationary pressures are already affecting consumer sentiment. As a result, continuing QE is actually doing more harm than good.
The bottom line? The Fed’s taper timeline remains on track and the USD Index likely awaits the fundamental cue. Moreover, the longer the Fed delays the announcement, the faster it may have to move over the medium term (which is bullish for the USD Index). And with that, Scotiabank told its clients that the Fed may deliver an autumn surprise and that the U.S. dollar should benefit from the hawkish move.
“We think a combination of modest economic revisions (by the Fed) and steady messaging on the interest rate outlook should be supportive for the U.S. dollar, given that many other central banks are likely to lag the Fed's policy normalization process by a substantial margin.”
In conclusion, gold underperformed on Sep. 15 and stock-market euphoria wasn’t enough to uplift the gold miners or sink the USD Index. And with the former demonstrating relative weakness (considering other commodity producers were on fire) and the latter demonstrating relative strength, prior bouts of euphoria often coincided with sharp declines in the USD Index. However, with the Fed’s taper timeline inching closer and inflation likely to accelerate until a formal announcement commences, the Fed’s policy conundrum will likely uplift the U.S. dollar and upend the PMs over the medium term.
Thank you for reading our free analysis today. Please note that the above is just a small fraction of the full analyses that our subscribers enjoy on a regular basis. They include multiple premium details such as the interim targets for gold and mining stocks that could be reached in the next few weeks. We invite you to subscribe now and read today’s issue right away.
Sincerely,
Przemyslaw Radomski, CFA
Founder, Editor-in-chief


Gold Investment News
Delivered To Your Inbox
Free Of Charge
Bonus: A week of free access to Gold & Silver StockPickers.
Gold Alerts
More-
Status
New 2024 Lows in Miners, New Highs in The USD Index
January 17, 2024, 12:19 PM -
Status
Soaring USD is SO Unsurprising – And SO Full of Implications
January 16, 2024, 8:40 AM -
Status
Rare Opportunity in Rare Earth Minerals?
January 15, 2024, 2:06 PM

