

Briefly: in our opinion, a full (300% of the regular position size) speculative short position in silver is justified from the risk/reward point of view at the moment of publishing this Alert. I’m moving the profit-take level for our already profitable positions lower.
Today’s technical analysis of the markets will revolve around the question I received, which is probably something that more of you are wondering about. Namely, did yesterday’s rally in the precious metals market change anything, and should we be concerned with it?
In short, I don’t think so.
Markets don’t necessarily move lower in a straight line, and it’s more natural for them to move back and forth and decline over time, forming lower lows and lower highs.
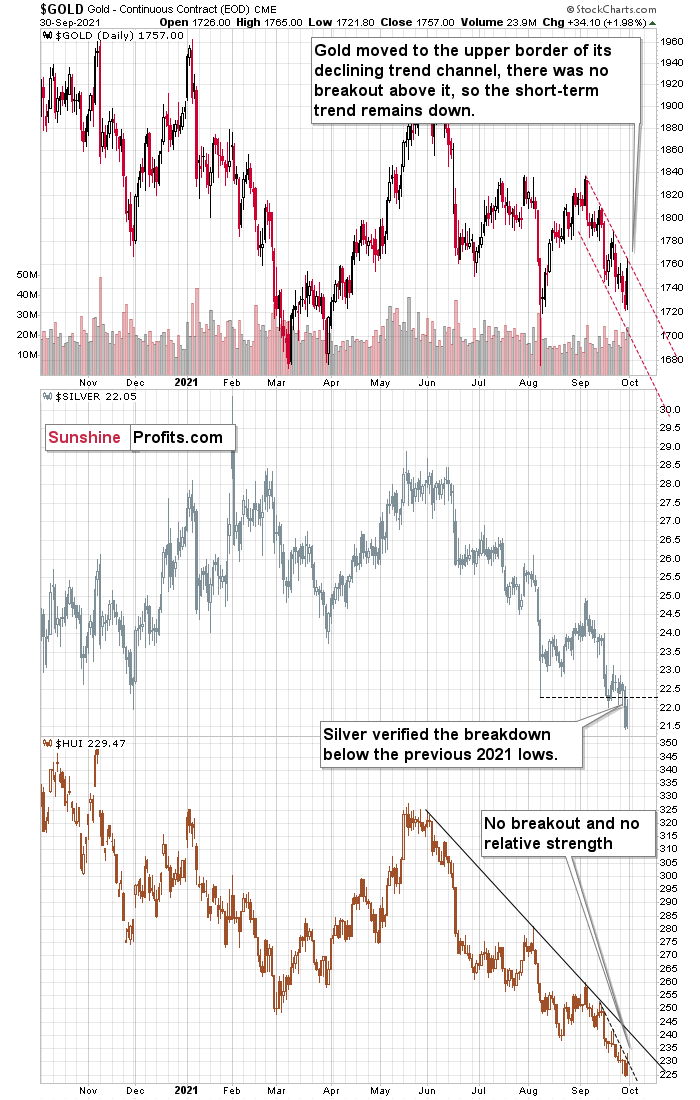
That seems to be taking place right now. Gold moved sharply higher and a $30+ rally is something that appears bullish on a day-to-day basis, but looking at the situation from a medium-term point of view, we see that it didn’t change anything.
It was another local high that was lower than the previous one, and the previous trend channel remains intact. I marked it with red dashed lines, and you can see that the gold price moved briefly to its upper border but was unable to rally above it.
So, nothing changed when we look at gold.
As far as silver is concerned, it also moved higher in a more visible manner, but it gave away part of its daily gains before the closing bell. Taking the last two days into account, silver is still down. Even taking today’s pre-market upswing into account, silver is still below the price levels that it was trading at when I wrote about switching from a short position in junior miners to a short position in silver.
Silver’s yesterday’s move higher ended when the white metal moved to its August low, which means that there’s no good reason to think that yesterday’s rally was anything more than just a verification of the previous breakdown in silver.
Gold stocks – the HUI Index – didn’t manage to break above the very short-term resistance line that I marked with a dashed line, and even if they rallied up to their solid resistance line, it would not be a game-changer.
Besides, if this was a game-changing rally, gold stocks should be strong relative to gold, and they are not.
So, no, nothing changed from this point of view, and the bearish outlook remains intact.
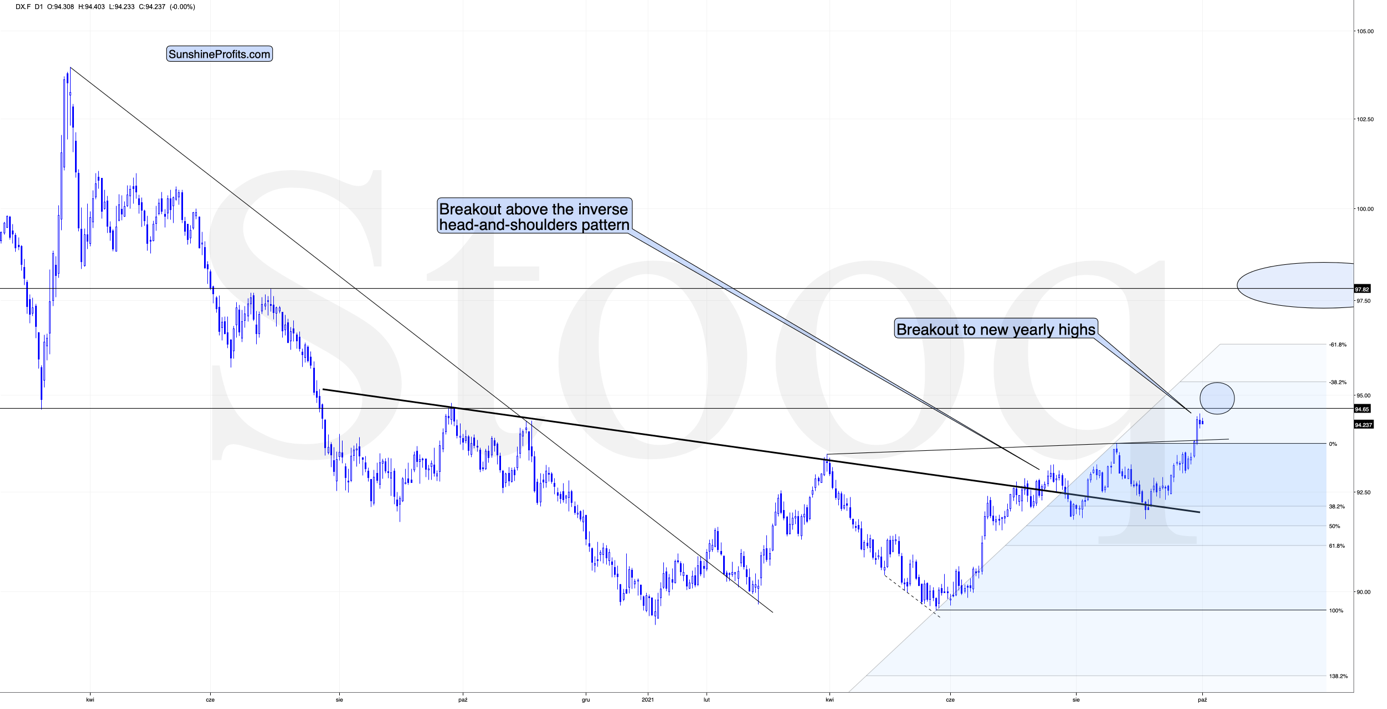
The USD Index started to consolidate, and if it consolidates for relatively long, it might be ready to break above the nearby resistance without looking back. Or we might see a quick jump above it and then see a pullback or consolidation. The latter seems a little more probable to me, but both scenarios seem relatively likely to me. In both situations, precious metals are likely to decline, but the dynamic of this decline will vary. This will be interesting to watch, but it doesn’t impact my decision regarding our current short position in silver.
Please note that something even more interesting seems to be taking place (or is about to take place) in the general stock market.
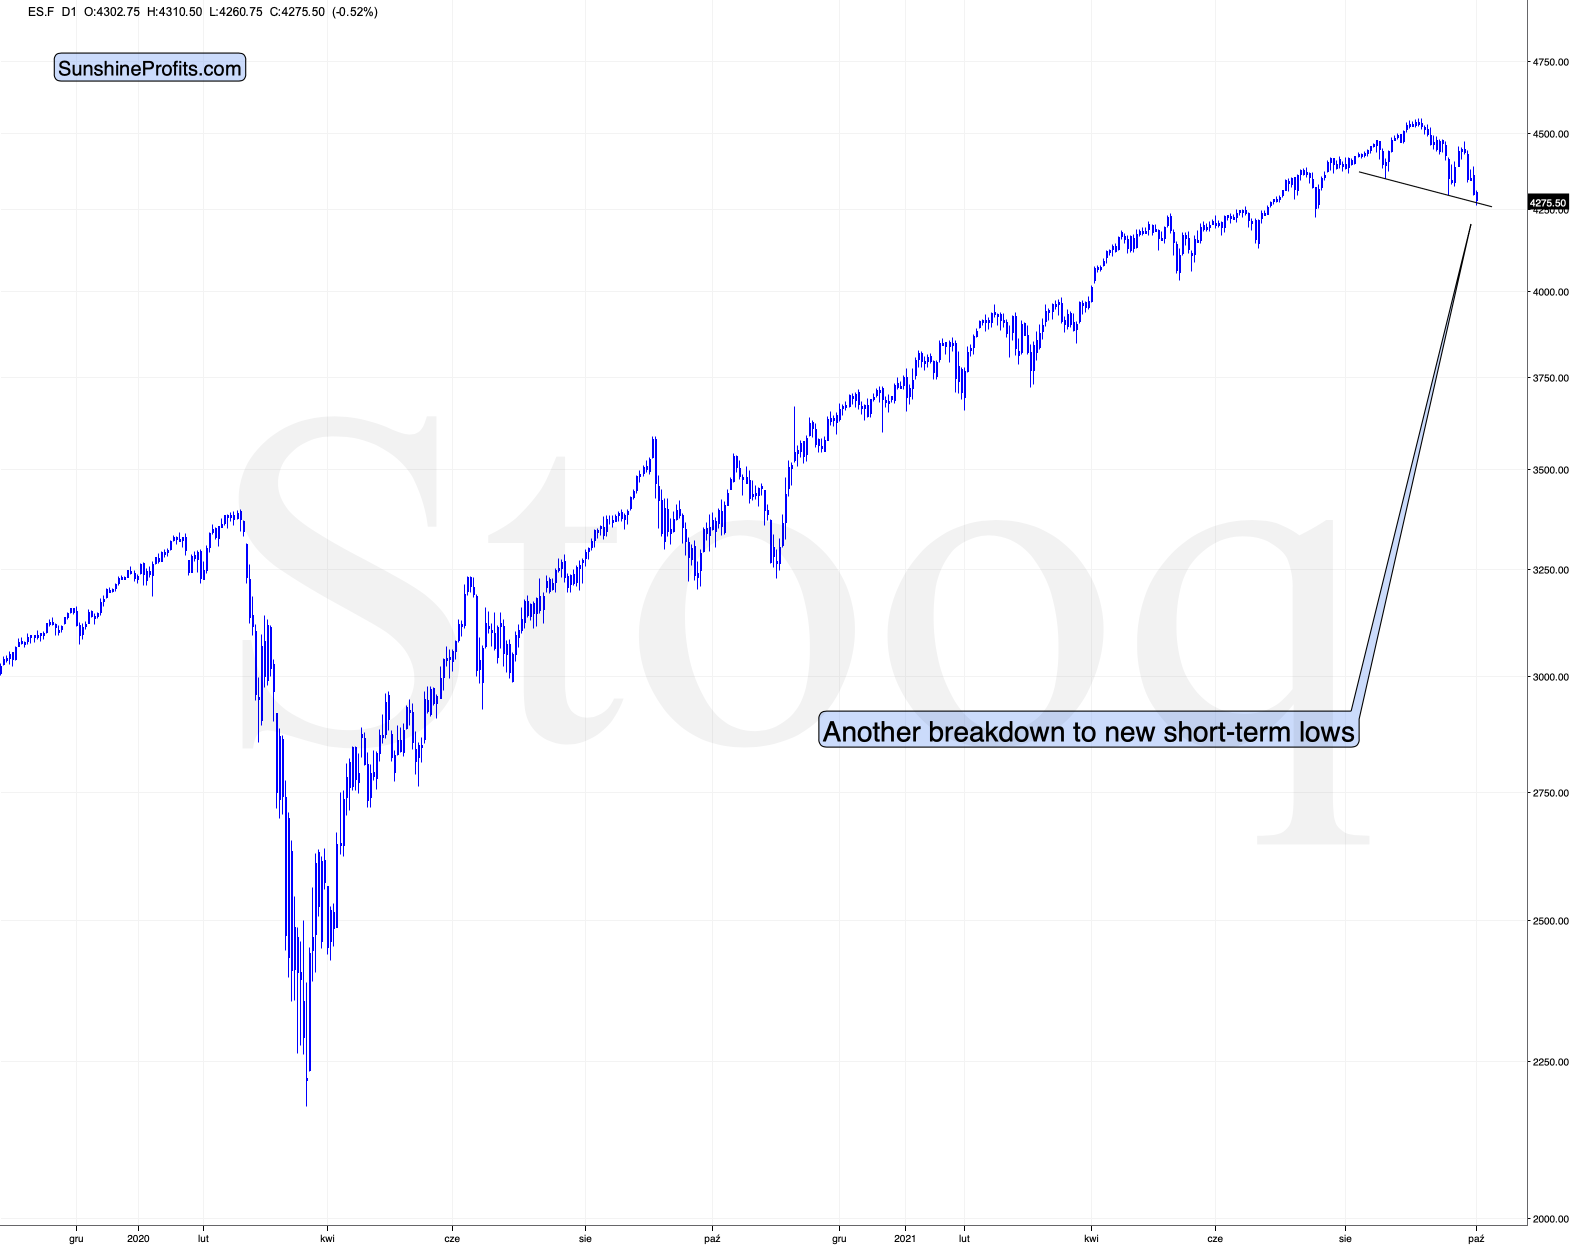
The S&P 500 futures moved to the neck level of the head and shoulders pattern. I previously explained that the recent rally from the new lows could be the beginning of a right shoulder of the pattern, but it was too early to say with certainty. Well, it’s now clear that it was the right shoulder of this important bearish pattern, and the only thing that’s missing is the breakdown.
Once we see the breakdown, we’re likely to see a major slide – either right away or after a brief verification of the breakdown. The slide in the stock market will be likely to lead to significant declines in the PMs, especially in silver and mining stocks.
All in all, the outlook for the precious metals market remains bearish for the short and medium term.
And as far as the more fundamental approach is concerned, you will find the details below.
Another Spark to Light the Fire
While the USD Index was largely flat on Sep. 30, the EUR/USD closed at a new 2021 low. And because the currency pair accounts for nearly 58% of the movement of the USD Index, its performance is material. Moreover, while I’ve been warning for months that the Fed and the ECB are worlds apart, the EUR/USD still hasn’t priced in the magnitude of the divergence.
Please see below:
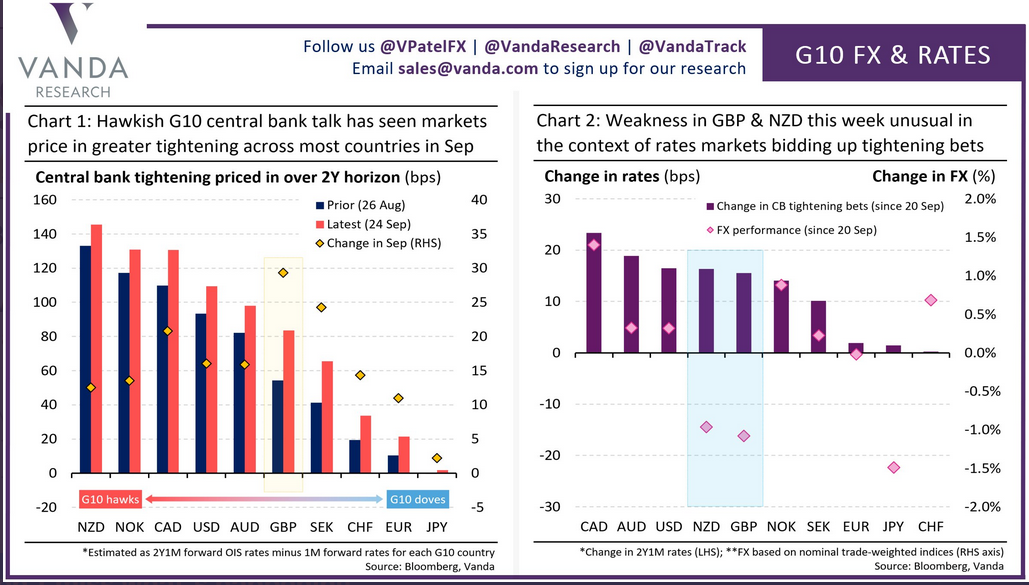
To explain, the chart on the right is where you should focus your attention: the purple bars above depict the change in investors’ hawkish central bank bets since Sep. 20, while the pink diamonds above depict the performance of various currencies during that same timeframe. If you analyze the column labeled “USD,” you can see that the Fed’s hawkish rhetoric has ramped up bets on further tightening. However, if you analyze the pink diamond near the bottom of the purple bar, you can see that the U.S. dollar’s performance hasn’t matched the fervor. Conversely, if you analyze the column labeled “EUR,” you can see that investors’ expectations of lower-for-longer Eurozone interest rates haven’t budged, and the euro has held up quite well. For context, the GBP (11.9% of the USD Index’s movement) and the CAD (9.1% of the USD Index’s movement) have largely offset one another. With the former not pricing in any of investors’ hawkish bets and the latter pricing in nearly all of investors’ hawkish bets, the divergence is largely a wash. However, with the U.S. dollar still underpriced and few upside catalysts available for the euro, more EUR/USD downside should commence over the medium term.
Supporting that argument, Jeremy Stretch, Head of G10 FX Strategy at CIBC Capital Markets, told clients that “the ECB is intent upon maintaining favorable financing conditions to perpetuate the recovery narrative. As a consequence, we expect the central bank to consider PEPP transitioning into the Asset Purchase Programme [APP].” And with that, “slower growth into 2023 will help limit medium-term price gains. Although headline HICP risks testing 13-year highs, the ECB’s adjusted inflation remit will allow the bank to look through short-term price spikes, especially as core prices are expected to remain relatively well-contained. Alongside fiscal policy developments, that will promote a lower-for-longer trajectory for interest rates, and as a result, a weaker EUR in 2022.”
And advocating for just that, ECB Governing Council Member Mario Centeno told CNBC on Sep. 27 that “we were fooled by some news on inflation in the past, which prompted us to act in the wrong way, so we don’t want, definitely, to commit the same sort of errors this time.... We need to guarantee favorable financing conditions to all sectors in our economy as we go out of [the] crisis, and we are not yet there, we are not yet out of the woods.”
And how does all of this impact Centeno’s taper timeline?
 Source: CNBC
In addition, while the ECB’s PEPP program should conclude at the end of March 2022, its APP program isn’t going anywhere. And when the central bank announced its PEPP “recalibration” on Sep. 9, I warned that the ECB’s liquidity spigot should remain on full blast much longer than the Fed’s.
I wrote:
While the deceleration may seem like a monumental shift, the move is much more semblance than substance: net APP purchases will still be reinvested “for an extended period of time past the date when [the ECB] starts raising the key ECB interest rates, and in any case for as long as necessary to maintain favorable liquidity conditions and an ample degree of monetary accommodation.”
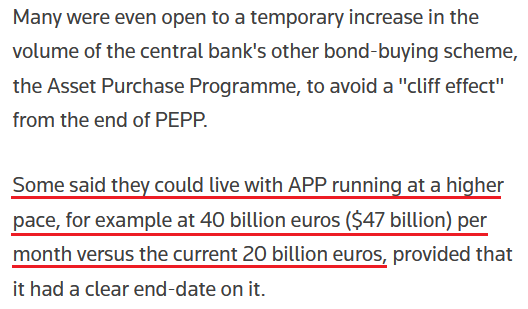
Likewise, with many ECB officials aiming to avoid a “cliff effect” when the PEPP program unwinds, Reuters reported that the central bank could expand its APP program to offset the damage. The bottom line? Tapering in Europe is nothing like tapering in the U.S.
Please see below:
 Source: Reuters
Reverse Repos Strike Again
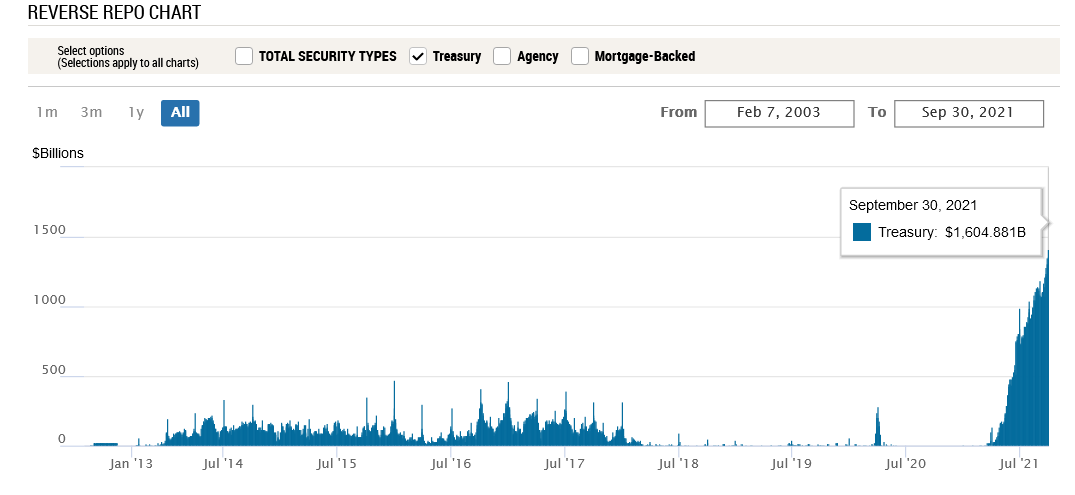
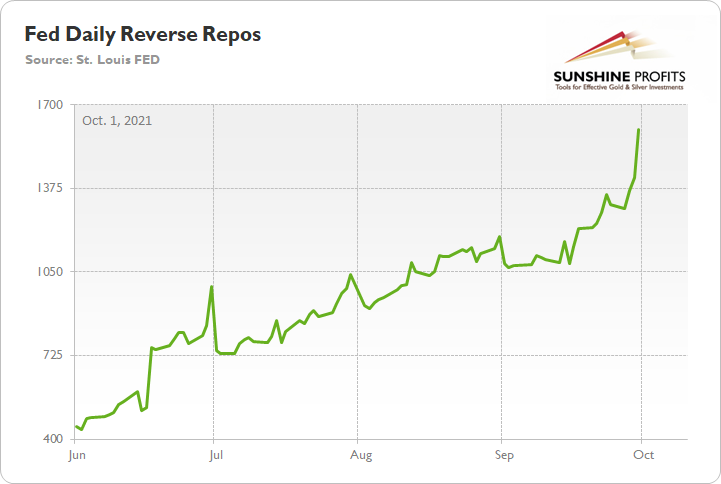
Also supporting a stronger U.S. dollar, the Fed’s waterfall of QE is running out of reservoirs. And after 92 counterparties drained nearly $1.605 trillion out of the U.S. financial system on Sep. 30, the Fed’s daily reverse repurchase agreements hit another all-time high.
Please see below:
 Source: New York Fed
To explain, a reverse repurchase agreement (repo) occurs when an institution offloads cash to the Fed in exchange for a Treasury security (on an overnight or short-term basis). And with U.S. financial institutions currently flooded with excess liquidity, they’re shipping cash to the Fed at an alarming rate. And while I’ve been warning for months that the activity is the fundamental equivalent of a taper – due to the lower supply of U.S. dollars (which is bullish for the USD Index) – as we await a formal announcement from the Fed, the U.S. dollar’s fundamental foundation remains robust.
Furthermore, with the Fed’s daily reverse repos averaging $642 billion in June, $848 billion in July, $1.053 trillion in August, and $1.211 trillion in September, the accelerated liquidity drain further supports a stronger U.S. dollar.
Stock Market On Its Last Legs?
What’s more, with the safe-haven bid also an important piece of the USD Index’s puzzle, the stock market’s recent struggles still haven’t manifested into a full-blown correction. However, with seasonal factors signaling more weakness ahead, a profound drawdown of the S&P 500 could accelerate the pace of the USD Index’s uprising.
Please see below:
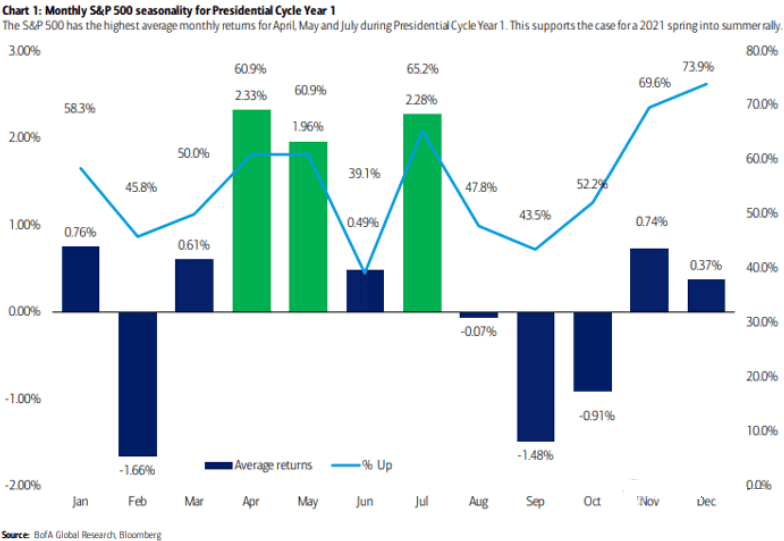
To explain, the blue and green bars above track the average monthly performance of the S&P 500 after a new U.S. President takes office. If you analyze the columns labeled “Sep” and “Oct,” you can see that the end of summer often elicits the worst monthly performances. And while the S&P 500 capped off September with a 1.19% decline, the weakness should continue in October.
As evidence, Bed Bath & Beyond’s stock plunged by more than 22% on Sep. 30. And with supply chain disruptions and weak demand clashing with U.S. policy uncertainty, optimism is on shaky ground. For example, the retailer’s second-quarter adjusted EPS came in at $0.04 vs. $0.52 expected, while revenue came in at $1.99 billion vs. $2.06 billion expected. Moreover, the company slashed its third-quarter adjusted EPS guidance to between flat and $0.05, with revenue ranging from $1.96 billion to $2 billion. Analysts were expecting figures of $0.28 and $2.02 billion respectively.
And while I’ve highlighted the issue on several occasions, CFO Gustavo Arnal lamented the fervor of surging freight costs. He said during the company’s Q2 earnings call:
“What we're seeing now in the second quarter is, look, significant freight cost increases well above what we had anticipated. We had anticipated 240 basis points. We got 360 basis points. We're still projecting some sequential increase in freight costs as we go from Q2 to Q3.”
Furthermore, CEO Mark Tritton said that the Delta variant has also “created a challenging and volatile environment:”
“In August, the final and largest sales month of Q2, traffic unexpectedly slowed, and, therefore, sales did not materialize as we had anticipated. External disruptive forces such as the resurgence of COVID-19 cases and growing Delta fears created a challenging and volatile environment. This is particularly evident in large southern states, such as Florida and Texas, as well as California, which, in aggregate, represent approximately 30% of our total sales. From July to August, traffic trends evolved in this state and worsened by double-digit percentages.”
As a result:
“As the quarter progressed, particularly in August, conditions worsened relative to our thoughtful preparations. The speed of industry inflation and lead time pressures outpaced our plans to offset these headwinds, and as a result, we did not pivot fast enough, especially on price and margin recovery.”
The bottom line? With the U.S. dollar already supported by a strong technical and fundamental foundation, a profound correction of the S&P 500 could be the next spark that lights the bullish fire. And with earnings season beginning in early/mid-October, more disappointments like what we witnessed with Bed Bath & Beyond could encourage the next correction. More importantly, though, given the PMs’ strong negative correlations with the U.S. dollar, a sharp move higher in the greenback could coincide with a sharp move lower in the PMs.
In conclusion, the PMs rallied on Sep. 30, but the bearish thesis remains unchanged: the USD Index is poised for an upward re-rating and U.S. Treasury yields still have the medium-term wind at their backs. Moreover, with the general stock market showing signs of stress, a real bout of panic could also uplift the USD Index and upend the PMs. As a result, lower precious metals prices should materialize over the next few months.
Overview of the Upcoming Part of the Decline
- It seems to me that the corrective upswing in gold is over, and the big decline seems to be already underway. We are very likely in the final part of this short-term decline, which is why I expect silver to catch up with mining stocks and decline quite substantially.
- It seems that the first stop for gold will be close to its previous 2021 lows, slightly below $1,700. Then it will likely correct a bit, but it’s unclear if I want to exit or reverse the current short position based on that – it depends on the number and the nature of the bullish indications that we get at that time. Before the next big slide, I will likely prefer to get back to the short position in the junior mining stocks.
- After the above-mentioned correction, we’re likely to see a powerful slide, perhaps close to the 2020 low ($1,450 - $1,500).
- If we see a situation where miners slide in a meaningful and volatile way while silver doesn’t (it just declines moderately), I plan to – once again – switch from short positions in miners to short positions in silver. At this time, it’s too early to say at what price levels this could take place, and if we get this kind of opportunity at all – perhaps with gold close to $1,600.
- I plan to exit all remaining short positions when gold shows substantial strength relative to the USD Index while the latter is still rallying. This might take place with gold close to $1,350 - $1,400. I expect silver to fall the hardest in the final part of the move. This moment (when gold performs very strongly against the rallying USD and miners are strong relative to gold after its substantial decline) is likely to be the best entry point for long-term investments, in my view. This might also happen with gold close to $1,375, but it’s too early to say with certainty at this time. I expect the final bottom to take place near the end of the year, perhaps in mid-December.
- As a confirmation for the above, I will use the (upcoming or perhaps we have already seen it?) top in the general stock market as the starting point for the three-month countdown. The reason is that after the 1929 top, gold miners declined for about three months after the general stock market started to slide. We also saw some confirmations of this theory based on the analogy to 2008. All in all, the precious metals sector is likely to bottom about three months after the general stock market tops.
- The above is based on the information available today, and it might change in the following days/weeks.
You will find my general overview of the outlook for gold on the chart below:
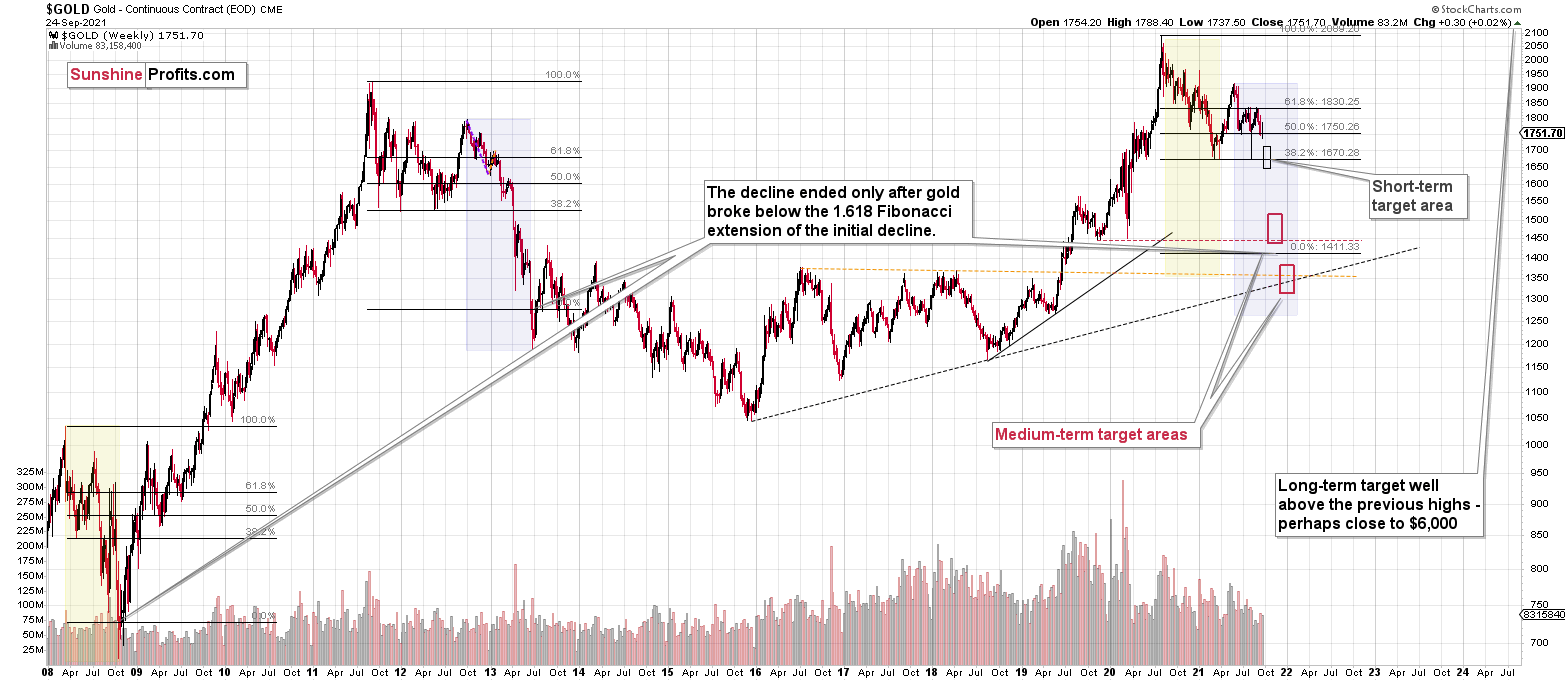
Please note that the above timing details are relatively broad and “for general overview only” – so that you know more or less what I think and how volatile I think the moves are likely to be – on an approximate basis. These time targets are not binding or clear enough for me to think that they should be used for purchasing options, warrants or similar instruments.
Summary
To summarize, the outlook for the precious metals sector remains extremely bearish for the next few months. It seems that we are in the final part of this short-term decline, which is why I expect silver to catch-up with mining stocks and decline quite substantially.
Congratulations on reaping great profits from the previous short position in the junior mining stocks! While juniors are likely to decline more, it seems to me that the profits that one could get from shorting silver right now are likely to be even bigger.
From the medium-term point of view, the key two long-term factors remain the analogy to 2013 in gold and the broad head and shoulders pattern in the HUI Index. They both suggest much lower prices ahead.
It seems that our profits from the short positions are going to become truly epic in the following months.
After the sell-off (that takes gold to about $1,350 - $1,500), I expect the precious metals to rally significantly. The final part of the decline might take as little as 1-5 weeks, so it's important to stay alert to any changes.
Most importantly, please stay healthy and safe. We made a lot of money last March and this March, and it seems that we’re about to make much more on the upcoming decline, but you have to be healthy to enjoy the results.
As always, we'll keep you - our subscribers - informed.
By the way, we’re currently providing you with the possibility to extend your subscription by a year, two years or even three years with a special 20% discount. This discount can be applied right away, without the need to wait for your next renewal – if you choose to secure your premium access and complete the payment upfront. The boring time in the PMs is definitely over, and the time to pay close attention to the market is here. Naturally, it’s your capital, and the choice is up to you, but it seems that it might be a good idea to secure more premium access now while saving 20% at the same time. Our support team will be happy to assist you in the above-described upgrade at preferential terms – if you’d like to proceed, please contact us.
To summarize:
Trading capital (supplementary part of the portfolio; our opinion): Full speculative short position (300% of the full position) in silver is justified from the risk to reward point of view with the following binding exit profit-take price levels:
Silver futures profit-take exit price: $19.12
SLV profit-take exit price: $17.72
ZSL profit-take exit price: $41.38
HZD.TO profit-take exit price: $31.98
OR if gold reaches $1,683 – in this case, I think that taking profits and closing the short position in silver (and related instruments) will be justified from the risk to reward point of view, regardless of silver’s price.
I don’t have a stop-loss level for this trade.
For-your-information targets (our opinion; we continue to think that mining stocks are the preferred way of taking advantage of the upcoming price move, but if for whatever reason one wants / has to use silver or gold for this trade, we are providing the details anyway.):
Gold futures downside profit-take exit price: $1,683
GDXJ: $35.73
JDST: $16.28
GDXD: $33.48
All mining-stock-related instruments: if gold reaches $1,683 or the GDXJ reaches $35.73 (whichever is reached first), I would exit all remaining short positions in any mining stock trading vehicles aimed at profiting from the declines in the mining stocks.
Long-term capital (core part of the portfolio; our opinion): No positions (in other words: cash
Insurance capital (core part of the portfolio; our opinion): Full position
Whether you already subscribed or not, we encourage you to find out how to make the most of our alerts and read our replies to the most common alert-and-gold-trading-related-questions.
Please note that we describe the situation for the day that the alert is posted in the trading section. In other words, if we are writing about a speculative position, it means that it is up-to-date on the day it was posted. We are also featuring the initial target prices to decide whether keeping a position on a given day is in tune with your approach (some moves are too small for medium-term traders, and some might appear too big for day-traders).
Additionally, you might want to read why our stop-loss orders are usually relatively far from the current price.
Please note that a full position doesn't mean using all of the capital for a given trade. You will find details on our thoughts on gold portfolio structuring in the Key Insights section on our website.
As a reminder - "initial target price" means exactly that - an "initial" one. It's not a price level at which we suggest closing positions. If this becomes the case (like it did in the previous trade), we will refer to these levels as levels of exit orders (exactly as we've done previously). Stop-loss levels, however, are naturally not "initial", but something that, in our opinion, might be entered as an order.
Since it is impossible to synchronize target prices and stop-loss levels for all the ETFs and ETNs with the main markets that we provide these levels for (gold, silver and mining stocks - the GDX ETF), the stop-loss levels and target prices for other ETNs and ETF (among other: UGL, GLL, AGQ, ZSL, NUGT, DUST, JNUG, JDST) are provided as supplementary, and not as "final". This means that if a stop-loss or a target level is reached for any of the "additional instruments" (GLL for instance), but not for the "main instrument" (gold in this case), we will view positions in both gold and GLL as still open and the stop-loss for GLL would have to be moved lower. On the other hand, if gold moves to a stop-loss level but GLL doesn't, then we will view both positions (in gold and GLL) as closed. In other words, since it's not possible to be 100% certain that each related instrument moves to a given level when the underlying instrument does, we can't provide levels that would be binding. The levels that we do provide are our best estimate of the levels that will correspond to the levels in the underlying assets, but it will be the underlying assets that one will need to focus on regarding the signs pointing to closing a given position or keeping it open. We might adjust the levels in the "additional instruments" without adjusting the levels in the "main instruments", which will simply mean that we have improved our estimation of these levels, not that we changed our outlook on the markets. We are already working on a tool that would update these levels daily for the most popular ETFs, ETNs and individual mining stocks.
Our preferred ways to invest in and to trade gold along with the reasoning can be found in the how to buy gold section. Furthermore, our preferred ETFs and ETNs can be found in our Gold & Silver ETF Ranking.
As a reminder, Gold & Silver Trading Alerts are posted before or on each trading day (we usually post them before the opening bell, but we don't promise doing that each day). If there's anything urgent, we will send you an additional small alert before posting the main one.
Thank you.
Przemyslaw Radomski, CFA
Founder, Editor-in-chief

