

Briefly: in our opinion, full (300% of the regular position size) speculative short position in silver is justified from the risk/reward point of view at the moment of publishing this Alert.
You will find today’s technical analysis in the video format below, and you will find the profit-take details for the current trade below the summary of today’s analysis, in the “Trading capital” section. Please note that I also updated the “Overview of the Upcoming Part of the Decline” section.
And as far as the more fundamental approach is concerned, you will find the details below.
Fed Up
With U.S. Treasury yields continuing their ascent on Sep. 28, the mini taper tantrum pushed the NASDAQ 100 over a cliff. And with the USD Index loving the surge in volatility, the greenback further cemented its breakout above the neckline of its inverse (bullish) head & shoulders pattern. And looking ahead, the momentum should continue. Case in point: Fed Chairman Jerome Powell testified before the U.S. Senate Banking Committee on Sep. 28. In his prepared remarks, he said:
“Inflation is elevated and will likely remain so in coming months before moderating. As the economy continues to reopen and spending rebounds, we are seeing upward pressure on prices, particularly due to supply bottlenecks in some sectors. These effects have been larger and longer lasting than anticipated, but they will abate, and as they do, inflation is expected to drop back toward our longer-run 2 percent goal.”
Furthermore, while I’ve been warning for months that Powell remains materially behind the inflation curve, his prepared remarks didn’t have a single mention of “base effects” or “transitory.” Instead, the Fed chief’s new favorite buzz word is “moderating.”
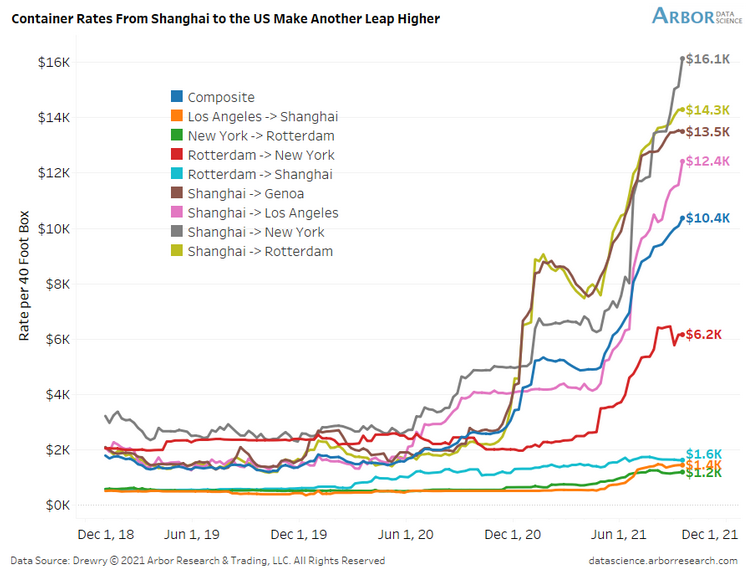
In any event, while I warned on several occasions that the composite container rate has gone from $6.5K to $8.1K to $8.4K to 9.4K, Powell finally admitted that the supply chain disruptions have “gotten worse:”
“Look at the car companies, look at the ships with the anchors down outside of Los Angeles,” he said. “This is really a mismatch between demand and supply, we need those supply blockages to alleviate, to abate, before inflation can come down.”
For context, the composite container rate is now at $10.4K (the blue line below):
To that point, with inflation surging and the Fed materially behind the eight ball, even the doves have turned hawkish since Powell unveiled his accelerated taper timeline on Sep. 22.
New York Fed President John Williams told the Economic Club of New York on Sep. 27:
“I think it’s clear that we have made substantial further progress on achieving our inflation goal. There has also been very good progress toward maximum employment. Assuming the economy continues to improve as I anticipate, a moderation in the pace of asset purchases may soon be warranted.”
Likewise, Fed Governor Lael Brainard added that labor-market conditions may “soon” warrant a reduction in the Fed’s bond-buying program:
“The forward guidance on maximum employment and average inflation sets a much higher bar for the liftoff of the policy rate than for slowing the pace of asset purchases,” Brainard told the National Association for Business Economics on Sep. 27. “I would emphasize that no signal about the timing of liftoff should be taken from any decision to announce a slowing of asset purchases.”
For context, she tried to calm investors’ nerves by separating rate hikes from tapering. However, with “a much higher bar” for “liftoff” implying a much lower bar for tapering, QE is likely on its deathbed.
Rounding out the hawkish rhetoric, Chicago Fed President Charles Evans also told the National Association for Business Economics on Sep. 27 that “I see the economy as being close to meeting the 'substantial further progress' standard we laid out last December. If the flow of employment improvements continues, it seems likely that those conditions will be met soon and tapering can commence.”
And why are these three voices so important?
Well, with Powell ramping up the hawkish rhetoric on Sep. 22 and his dovish minions following suit, their messaging is much different than the hawk talk that we normally hear from Bullard, Kaplan and Rosengren. For context, the latter two actually resigned for ethical reasons after their questionable day trading activity became public.
Please see below:
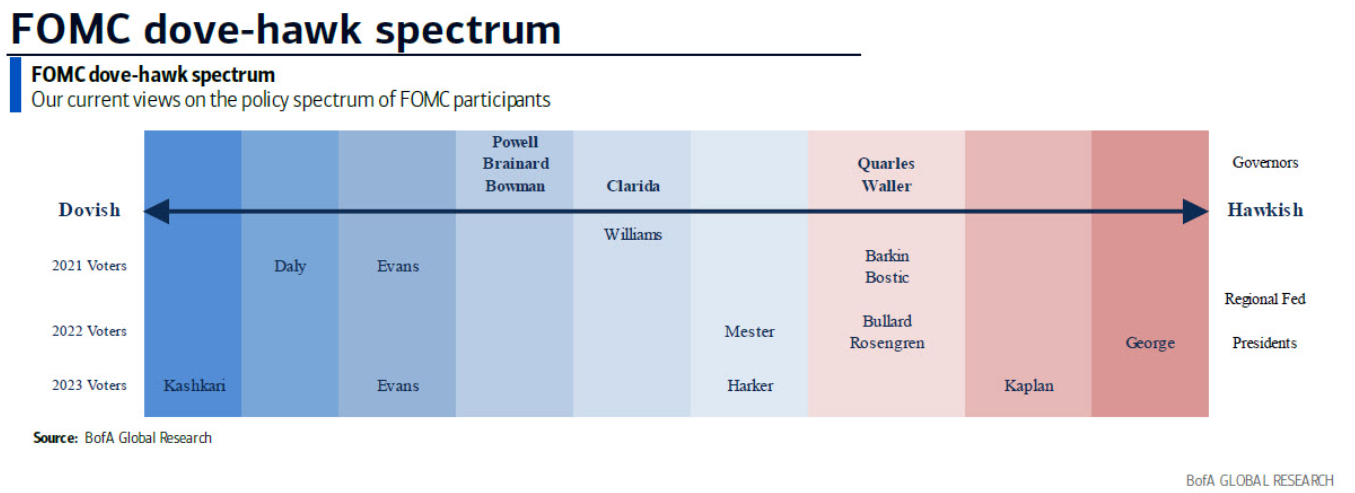
To explain, the graphic above depicts Bank of America’s FOMC dove-hawk spectrum. From left to right, the blue areas categorize the doves, while the red areas categorize the hawks. If you analyze the third, fourth and fifth columns from the left, you can see that Evans, Powell, Brainard and Williams are known for their dovish dispositions. However, with all four materially shifting their stances in the last week, the hawkish realignments are bullish for U.S. Treasury yields, bullish for the USD Index and bearish for the PMs.
For example, the U.S. 10-Year Treasury yield has risen by 19% over the last five trading days. What’s more, the U.S. 5-Year Treasury yield has risen by 24% over the last seven trading days and ended the Sep. 28 session at a new 2021 high. For context, the last time the U.S. 5-Year Treasury yield closed above 1% was Feb. 27, 2020.
Please see below:
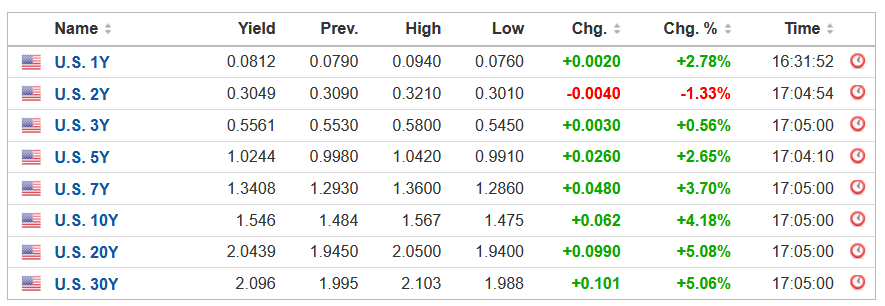 Source: Investing.com
On the opposite end of the double-edged sword slashing the gold price, the USD index is also reasserting its dominance. And with the greenback’s fundamentals also uplifted by higher U.S. Treasury yields, the current (and future) liquidity drains support a stronger U.S. dollar. For one, after 83 counterparties drained more than $1.365 trillion out of the U.S. financial system on Sep. 28, the Fed’s daily reverse repurchase agreements hit another all-time high.
Please see below:
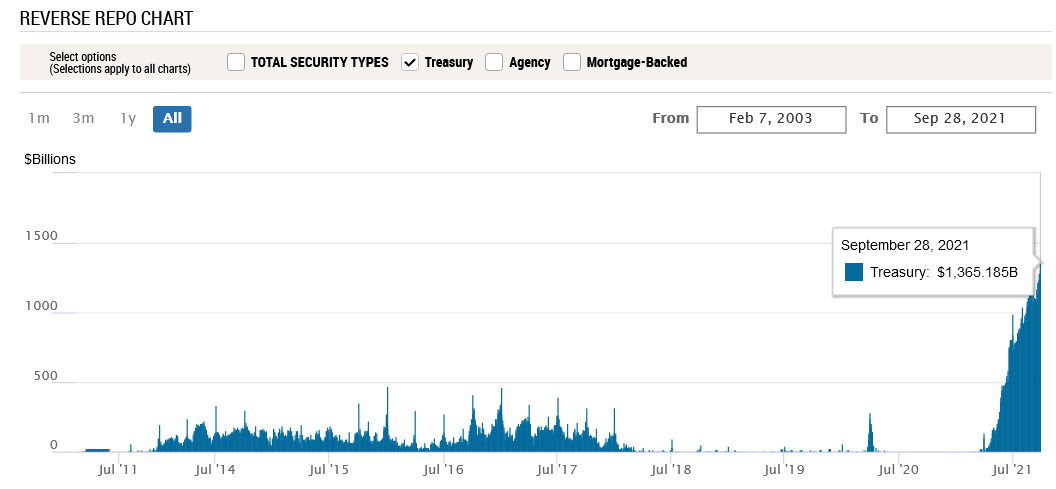 Source: New York Fed
To explain, a reverse repurchase agreement (repo) occurs when an institution offloads cash to the Fed in exchange for a Treasury security (on an overnight or short-term basis). And with U.S. financial institutions currently flooded with excess liquidity, they’re shipping cash to the Fed at an alarming rate. And while I’ve been warning for months that the activity is the fundamental equivalent of a taper – due to the lower supply of U.S. dollars (which is bullish for the USD Index) – as we await a formal announcement from the Fed, the U.S. dollar’s fundamental foundation remains robust.
Second, non-commercial (speculative) futures traders, asset managers and leveraged funds’ allocations to the U.S. dollar remain strong.
Please see below:
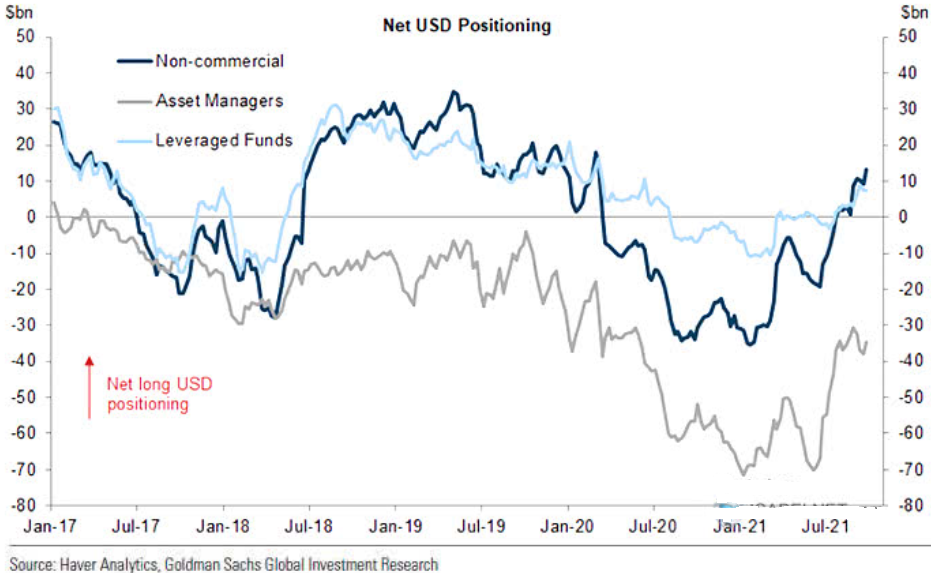
To explain, the dark blue, gray, and light blue lines above represent net-long positions of non-commercial (speculative) futures traders, asset managers and leveraged funds. When the lines are falling, it means that the trio have reduced their net-long positions and are expecting a weaker U.S. dollar. Conversely, when the lines are rising, it means that the trio have increased their net-long positions and are expecting a stronger U.S. dollar. And while asset managers and leveraged funds’ allocations (the gray and light blue lines) remain slightly below their 2021 highs, non-commercial (speculative) futures traders’ allocation to the U.S. dollar has now hit a new 2021 high. As a result, a continuation of the theme should uplift the U.S. dollar and negatively impact the performance of the gold and silver prices.
Finally, with the EUR/USD accounting for nearly 58% of the movement of the USD Index, the currency pair has sunk below 1.1700 once again. And with the Fed’s inflationary conundrum dwarfing Europe’s predicament, I warned on Jul. 20 that the dichotomy is bullish for the U.S. dollar.
I wrote:
Not only is the U.S. economy outperforming the Eurozone, but the Fed and the ECB are worlds apart.
Please see below:
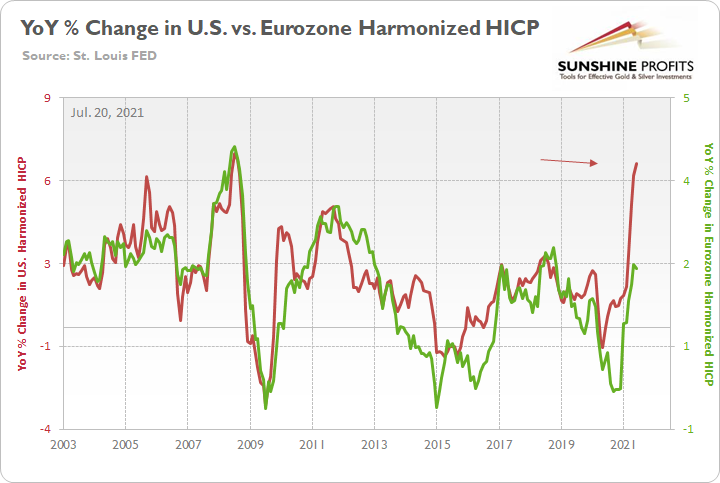
To explain, the green line above tracks the year-over-year (YoY) percentage change in the Eurozone Harmonized Index of Consumer Prices (HICP), while the red line above tracks the YoY percentage change in the U.S. HICP. If you analyze the right side of the chart, it’s not even close. And with the U.S. HICP rising by 6.41% YoY in June and the Eurozone HICP rising by 1.90%, the Fed is likely to taper well in advance of the ECB.
To that point, with the rhetoric above guiding the Fed down a hawkish path, the ECB is heading in the opposite direction. For example, ECB President Christine Lagarde said on Sep. 28 that there are “no signs that this increase in [Eurozone] inflation is becoming broad-based. The key challenge is to ensure that we do not overreact to transitory supply shocks that have no bearing on the medium term…. Monetary policy should normally ‘look through’ temporary supply-driven inflation, so long as inflation expectations remain anchored.”
As a result:
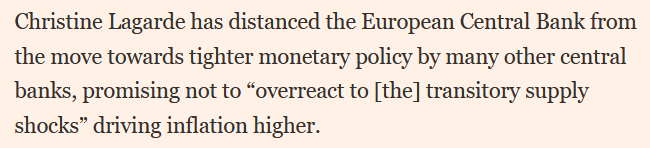 Source: the Financial Times
The bottom line? With U.S. Treasury yields and the USD Index firing on all cylinders, the PMs remain caught in the crossfire. And with both variables still having the fundamental wind at their backs, the Fed’s hawkish shift should help underwrite further gains over the medium term.
In conclusion, the PMs declined on Sep. 28 and the gold miners continued their underperformance. And with the Fed’s inflationary anxiety sparking a mini taper tantrum, the PMs remain stuck in no man’s land. Furthermore, with the general stock market also feeling the heat, a sharp correction could accelerate the ferocity of the PMs’ current downtrend. As a result, their medium-term outlooks remain quite bearish.
Overview of the Upcoming Part of the Decline
- It seems to me that the corrective upswing in gold is over, and the big decline seems to be already underway. It seems that we are in the final part of this short-term decline, which is why I expect silver to catch-up with mining stocks and decline quite substantially.
- It seems that the first stop for gold will be close to its previous 2021 lows, slightly below $1,700. Then it will likely correct a bit, but it’s unclear if I want to exit or reverse the current short position based on that – it depends on the number and the nature of the bullish indications that we get at that time. Before the next big slide, I will likely prefer to get back to a short position in the junior mining stocks.
- After the above-mentioned correction, we’re likely to see a powerful slide, perhaps close to the 2020 low ($1,450 - $1,500).
- If we see a situation where miners slide in a meaningful and volatile way while silver doesn’t (it just declines moderately), I plan to – once again – switch from short positions in miners to short positions in silver. At this time, it’s too early to say at what price levels this could take place, and if we get this kind of opportunity at all – perhaps with gold close to $1,600.
- I plan to exit all remaining short positions when gold shows substantial strength relative to the USD Index while the latter is still rallying. This might take place with gold close to $1,350 - $1,400. I expect silver to fall the hardest in the final part of the move. This moment (when gold performs very strongly against the rallying USD and miners are strong relative to gold after its substantial decline) is likely to be the best entry point for long-term investments, in my view. This might also happen with gold close to $1,375, but it’s too early to say with certainty at this time. I expect the final bottom to take place near the end of the year, perhaps in mid-December.
- As a confirmation for the above, I will use the (upcoming or perhaps we have already seen it?) top in the general stock market as the starting point for the three-month countdown. The reason is that after the 1929 top, gold miners declined for about three months after the general stock market started to slide. We also saw some confirmations of this theory based on the analogy to 2008. All in all, the precious metals sector is likely to bottom about three months after the general stock market tops.
- The above is based on the information available today, and it might change in the following days/weeks.
You will find my general overview of the outlook for gold on the chart below:
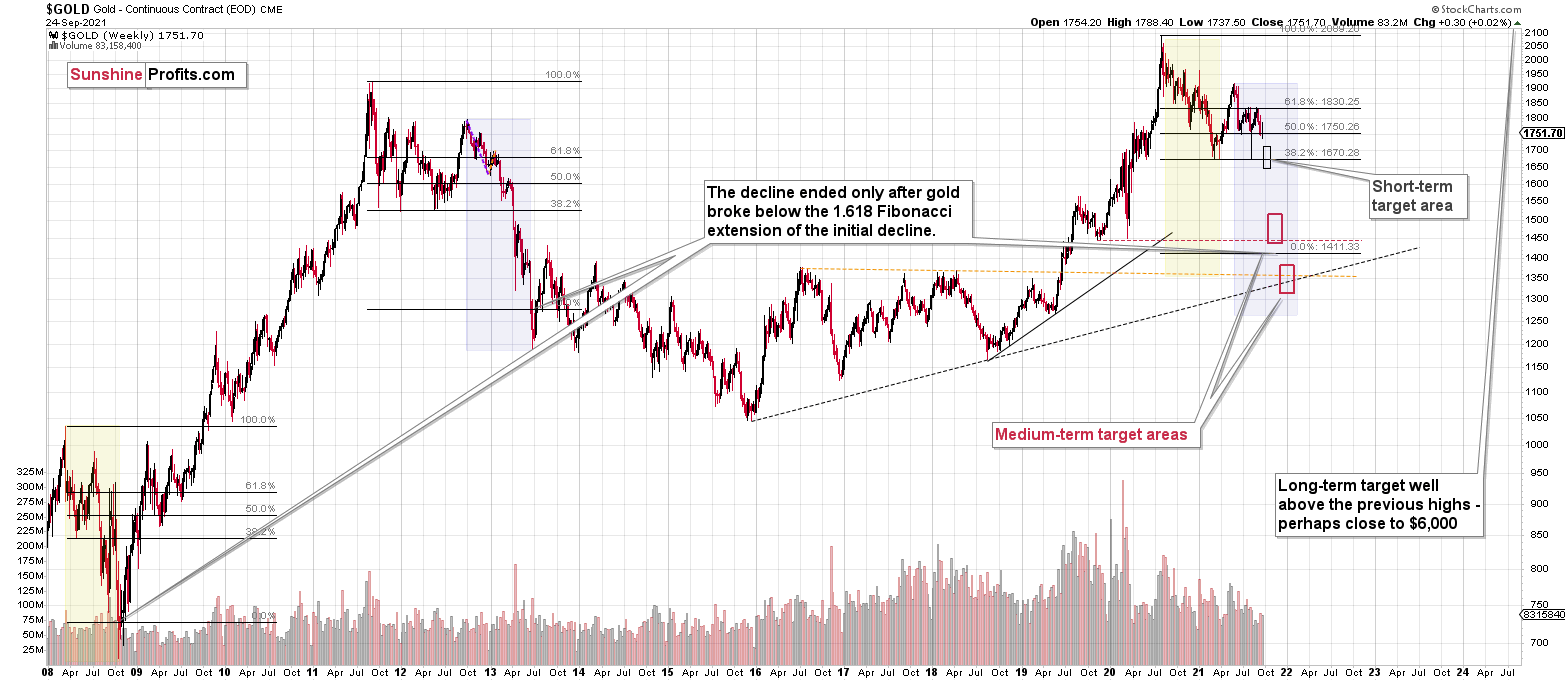
Please note that the above timing details are relatively broad and “for general overview only” – so that you know more or less what I think and how volatile I think the moves are likely to be – on an approximate basis. These time targets are not binding or clear enough for me to think that they should be used for purchasing options, warrants or similar instruments.
Summary
To summarize, the outlook for the precious metals sector remains extremely bearish for the next few months. It seems that we are in the final part of this short-term decline, which is why I expect silver to catch-up with mining stocks and decline quite substantially.
Congratulations on reaping great profits from the previous short position in the junior mining stocks! While juniors are likely to decline more, it seems to me that the profits that one could get from shorting silver right now are likely to be even bigger.
From the medium-term point of view, the key two long-term factors remain the analogy to 2013 in gold and the broad head and shoulders pattern in the HUI Index. They both suggest much lower prices ahead.
It seems that our profits from the short positions are going to become truly epic in the following months.
After the sell-off (that takes gold to about $1,350 - $1,500), I expect the precious metals to rally significantly. The final part of the decline might take as little as 1-5 weeks, so it's important to stay alert to any changes.
Most importantly, please stay healthy and safe. We made a lot of money last March and this March, and it seems that we’re about to make much more on the upcoming decline, but you have to be healthy to enjoy the results.
As always, we'll keep you - our subscribers - informed.
By the way, we’re currently providing you with the possibility to extend your subscription by a year, two years or even three years with a special 20% discount. This discount can be applied right away, without the need to wait for your next renewal – if you choose to secure your premium access and complete the payment upfront. The boring time in the PMs is definitely over, and the time to pay close attention to the market is here. Naturally, it’s your capital, and the choice is up to you, but it seems that it might be a good idea to secure more premium access now while saving 20% at the same time. Our support team will be happy to assist you in the above-described upgrade at preferential terms – if you’d like to proceed, please contact us.
To summarize:
Trading capital (supplementary part of the portfolio; our opinion): Full speculative short position (300% of the full position) in silver is justified from the risk to reward point of view with the following binding exit profit-take price levels:
Silver futures profit-take exit price:
SLV profit-take exit price: $18.42
ZSL profit-take exit price: $38.29
HZD.TO profit-take exit price: $29.69
OR if gold reaches $1,683 – in this case, I think that taking profits and closing the short position in silver (and related instruments) will be justified from the risk to reward point of view, regardless of silver’s price.
I don’t have a stop-loss level for this trade.
For-your-information targets (our opinion; we continue to think that mining stocks are the preferred way of taking advantage of the upcoming price move, but if for whatever reason one wants / has to use silver or gold for this trade, we are providing the details anyway.):
Gold futures downside profit-take exit price: $1,683
GDXJ: $35.73
All mining-stock-related instruments: if gold reaches $1,683 or the GDXJ reaches $35.73 (whichever is reached first), I would exit all remaining short positions in any mining stock trading vehicles aimed at profiting from the declines in the mining stocks.
Long-term capital (core part of the portfolio; our opinion): No positions (in other words: cash
Insurance capital (core part of the portfolio; our opinion): Full position
Whether you already subscribed or not, we encourage you to find out how to make the most of our alerts and read our replies to the most common alert-and-gold-trading-related-questions.
Please note that we describe the situation for the day that the alert is posted in the trading section. In other words, if we are writing about a speculative position, it means that it is up-to-date on the day it was posted. We are also featuring the initial target prices to decide whether keeping a position on a given day is in tune with your approach (some moves are too small for medium-term traders, and some might appear too big for day-traders).
Additionally, you might want to read why our stop-loss orders are usually relatively far from the current price.
Please note that a full position doesn't mean using all of the capital for a given trade. You will find details on our thoughts on gold portfolio structuring in the Key Insights section on our website.
As a reminder - "initial target price" means exactly that - an "initial" one. It's not a price level at which we suggest closing positions. If this becomes the case (like it did in the previous trade), we will refer to these levels as levels of exit orders (exactly as we've done previously). Stop-loss levels, however, are naturally not "initial", but something that, in our opinion, might be entered as an order.
Since it is impossible to synchronize target prices and stop-loss levels for all the ETFs and ETNs with the main markets that we provide these levels for (gold, silver and mining stocks - the GDX ETF), the stop-loss levels and target prices for other ETNs and ETF (among other: UGL, GLL, AGQ, ZSL, NUGT, DUST, JNUG, JDST) are provided as supplementary, and not as "final". This means that if a stop-loss or a target level is reached for any of the "additional instruments" (GLL for instance), but not for the "main instrument" (gold in this case), we will view positions in both gold and GLL as still open and the stop-loss for GLL would have to be moved lower. On the other hand, if gold moves to a stop-loss level but GLL doesn't, then we will view both positions (in gold and GLL) as closed. In other words, since it's not possible to be 100% certain that each related instrument moves to a given level when the underlying instrument does, we can't provide levels that would be binding. The levels that we do provide are our best estimate of the levels that will correspond to the levels in the underlying assets, but it will be the underlying assets that one will need to focus on regarding the signs pointing to closing a given position or keeping it open. We might adjust the levels in the "additional instruments" without adjusting the levels in the "main instruments", which will simply mean that we have improved our estimation of these levels, not that we changed our outlook on the markets. We are already working on a tool that would update these levels daily for the most popular ETFs, ETNs and individual mining stocks.
Our preferred ways to invest in and to trade gold along with the reasoning can be found in the how to buy gold section. Furthermore, our preferred ETFs and ETNs can be found in our Gold & Silver ETF Ranking.
As a reminder, Gold & Silver Trading Alerts are posted before or on each trading day (we usually post them before the opening bell, but we don't promise doing that each day). If there's anything urgent, we will send you an additional small alert before posting the main one.
Thank you.
Przemyslaw Radomski, CFA
Founder, Editor-in-chief

