

-
As Expected, Oil Bounces Back Pending Lower Expected US Stocks
September 22, 2021, 9:58 AMAvailable to premium subscribers only.
In today’s market review, we analyse the last market developments on WTI crude oil (CL) futures while not forgetting to switch to the (new front month) November contract: CLX21.
-
Trading Energy ETFs in Foreign Currencies: What to Focus On
September 21, 2021, 11:04 AMTrading energy ETFs outside of US exchanges can be tricky, as it often means lower liquidity and some latency, but is it worth trying? Definitely!
Let’s do a comparative study between the WTI Crude Oil (CL) and an Exchange-Traded Fund (ETF) tracking this energy commodity as the underlying asset.
Prelude
In the previous two-part series (see Part I & Part II), we presented different ways to trade energies such as stocks, ETFs, CFDs and futures. We saw that picking the right instrument or vehicle depended on businesses, regions, risk profiles, psychology, etc. So, today, as an example, we will compare the well-known WTI Crude Oil (CL) futures contract (quoted in US dollars) with a 2:1 (2x) leveraged ETF traded in Toronto, in Canadian dollars.
Crude Oil (CL) Futures Vs. Horizons BetaPro Crude Oil Leveraged Daily Bull ETF
Here is a comparison table between the two products:
CME/NYMEX WTI Crude Oil Futures
Codes: CL (Standard), MCL (Micro)
Currency: USD
Specs: CME (standard), CME (micro)Horizons Crude Oil 2x Daily Bull ETF
Code: HOU
Currency: CAD
Specifications: Horizons ETFsWTI Crude Oil Futures:
CL (Exchange: CME Group)
Higher liquidity
No management fees
Higher leverage
24-hour access
Cross-margining
Tighter correlation to physical marketOther Crude Oil ETFs (quoted in USD):
USO/UCO/DBO/USL/SCO/OILK/OIL
Lower liquidity
Low management fee
Lower leverage (2:1) and less risk
Easy access to the market
Less maintenance for position rolling
Read more: CME Group – ETF DatabaseBrent Crude Oil Futures:
B (Exchange: ICE)Brent Crude Oil ETF:
BNO (ETF Database)And here are the latest charts:
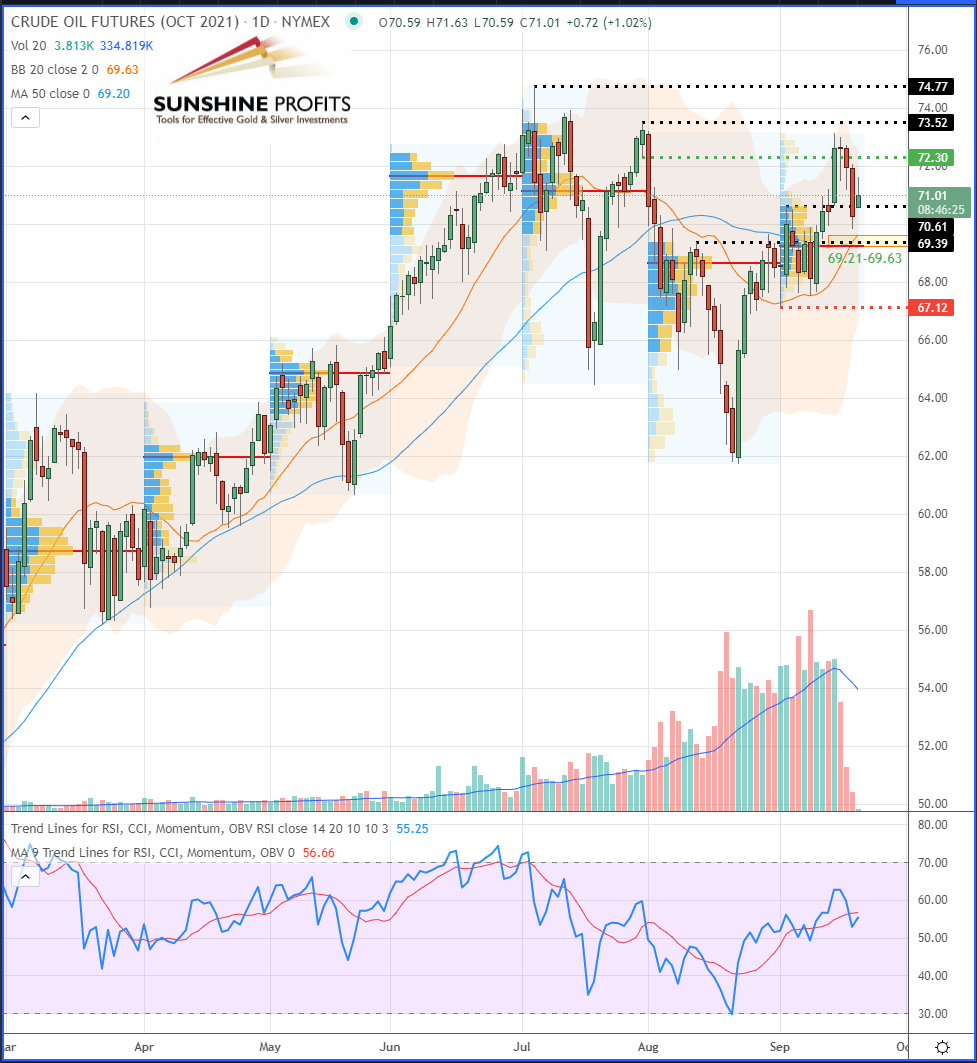
- CL:
- HOU:
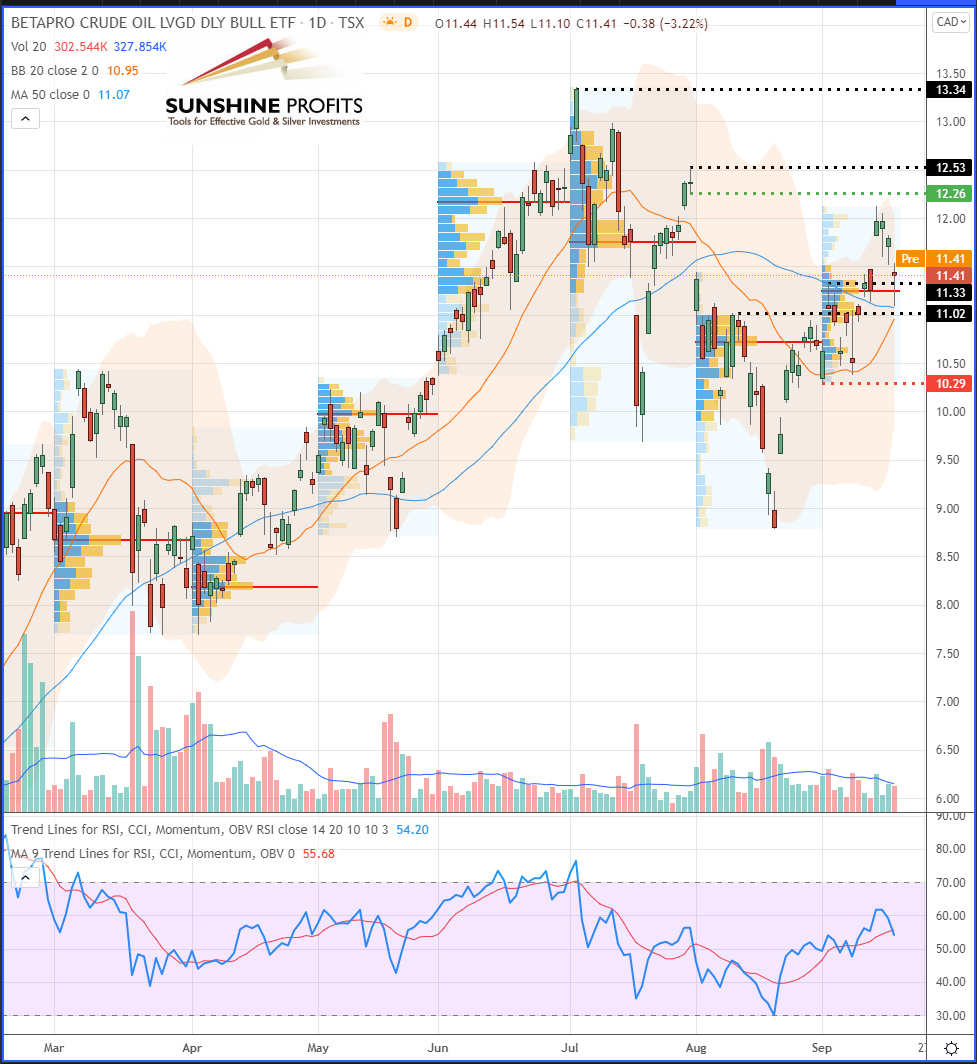
As an example, we take our last oil trading alert about CL Futures that we somehow “translate” into HOU (ETF). It is noticeable that the prices on the HOU ETF are completely different from the Futures, even though the correlation coefficient is 1 since they are perfectly correlated. Therefore, if both assets move similarly together (as the ETF by definition tracks the WTI Crude Oil futures), it is quite simple to draw the same levels that we give for CL to HOU (or any other ETF trackers).
However, some pricing discrepancies may appear on the ETF chart sometimes. Those are due to a delay in tracking the underlying asset, notably due to the fact that the ETF tracker has to catch-up with the Futures prices at the open (because there is no complete market close for the futures the latter benefits from extended market hours). Some other slight discrepancies in the ETF pricing are also present due to the fact that the fund offering the product automatically processes to contract-rolling on the underlying futures. In short, we could equate the ETF to a hypothetical lagging (delayed) indicator of the WTI CL futures.
Volume Profile Accuracy
By comparing the volume profiles respectively for both products, we can also notice some differences. For example, the Volume Point of Control (VPOC) is not always located at the same place, since there are much fewer trade prices (and obviously much less traded volume) for ETFs than Futures. So, the accuracy of Volume Areas and their respective VPOCs (red horizontal lines) could be discussed. However, would that make them less reliable levels for ETFs? Not sure.
Actually, it may sometimes give another view of the market by removing some noise - therefore, they could potentially be used to confirm levels in a clearer way while ignoring/excluding the Asian-Pacific trading session as well as the first half (morning and early afternoon) of the European one, since the HOU prices will be based solely on the Canadian trading session that overlaps most of the Western region, including the U.S. trading session.
Dichotomy Method
A good way to spot the same levels on such a chart (of a product quoted in a different price scale or in another currency) could be to use some sort of “dichotomy” method: drawing the supports and resistance levels from extremities to the center to mark the swing lows/highs and then recentre the scope by taking some mid-point levels. For example, by drawing each support and resistance levels in the same manner as we provide them on futures charts to “translate” them into the desired correlated instrument such as an ETF. This method could help spot the equivalent entry/exit levels, stop loss, targets, etc.
An alternative would consist of using the same indicators on both charts to show similar data at similar levels, like, for example, Fibonacci levels, Ichimoku Kinko Hyo, Pivot Points, etc.
And finally, setting price alerts on the underlying chart in order to enter the trade through a market order in the ETF is possible as well, however it’s not very convenient…
In conclusion, we explored in this article the different ways to trade our Oil and Gas Trading Alerts using a broader range of products: instruments with more or less leverage, in your local currency, different time zones and other price scales. However, the abovementioned methods are practicable as long as the main condition is respected: it requires at least a very high correlation between the main instrument(s) for which we provide alerts and your favourite product(s).
Today's premium Oil Trading Alert includes details of our new trading position. Interested in more exclusive updates? Join our premium Oil Trading Alerts newsletter and read all the details today.
Thank you.
Sebastien Bischeri,
Oil & Gas Trading Strategist -
Q&A: How to use our trading alerts with different instruments and other currencies?
September 20, 2021, 11:17 AMIn response to readers’ questions, in Tuesday’s article we are going to provide you with some tips on how to use our Oil Trading Alerts for different instruments in other currencies.
Here’s the question we received:
"I am a relatively new subscriber and not a sophisticated investor. I am in Canada and plan to use the Horizons Betapro Daily Bull ETF to act on bullish recommendations. A question for you. In your daily letter, when you talk about oil prices, are you referring to WTI crude? I just want to be sure I am looking at the right thing."
We would like to thank William, one of our readers, who asked us this question, so we can focus on providing some answers which probably some of you might be wondering about.
By the way, feel free to send us your questions or any topics that you would like us to write about in the forthcoming editions.
Today's premium Oil Trading Alert includes details of our new trading position. Interested in more exclusive updates? Join our premium Oil Trading Alerts newsletter and read all the details today.
Thank you.
Sebastien Bischeri,
Oil & Gas Trading Strategist -
Natural Gas: New Potential Support!
September 17, 2021, 9:23 AMAvailable to premium subscribers only.
In today’s forecast, we provide new potential support for Henry Hub Natural Gas futures…
-
Oil Surged Amid Falling US Inventories, Hitting Our Target!
September 16, 2021, 3:33 AMOil prices rose to their highest level in two months as U.S. inventories fell more than twice what was expected. Where will it lead us?
Trading positionWe took the position in the forecasted $67.53-67.94 key support zone, and some partial profits were saved by our suggested stop-win at $68.82 last week. However, what’s the most important: the main target that we expected in our previous editions of Oil Trading Alerts at $72.30 was finally reached yesterday!
Market Analysis
U.S. crude inventories for the past week fell 6.4 million barrels (Mb), more than double what analysts had expected (2.7). Gasoline reserves have fallen by 1.9 million barrels, against 3.3 million expected. Notably, strategic crude oil reserves have also declined, by 500,000 barrels.
This phenomenon could be explained by the maintenance of a high level of exports despite the impact on production of the passage of Hurricane Ida in the Gulf of Mexico.
Exports have indeed increased compared to the previous week and are now higher than those of the same period last year.
As a consequence of Hurricane Ida, many companies had to suspend the activity of their rigs in the Gulf of Mexico, as well as of several refineries in Louisiana, also hit by the extreme climatic episode.
As a result, gasoline deliveries remain below their level of last year, even taking into account the drop in demand linked to the end of the summer period, with cooler temperatures.
Our view now is that we could see a pullback to previous supports, either $70.61 (which wouldn’t be the best entry from the risk-to-reward point of view) or $69.39 (which would be preferable). This retracement could either happen (Fig.1):
- sraightaway, which would confirm a long-term bearish trend configuration by failing to break higher, above the $73.52 and $74.77 highs (the next resistance levels). Therefore, the market would be topping at a lower high (as defined by the Dow Theory) [scenario A].
- once the auctioneers push the prices higher (at least above $73.52) – this scenario would redefine a new long-term bullish trend (with higher highs) [scenario B].
Given the recent market developments, the weekly chart (Fig.2) shows a bullish engulfing candle that could eventually confirm the continuation of a bullish trend.
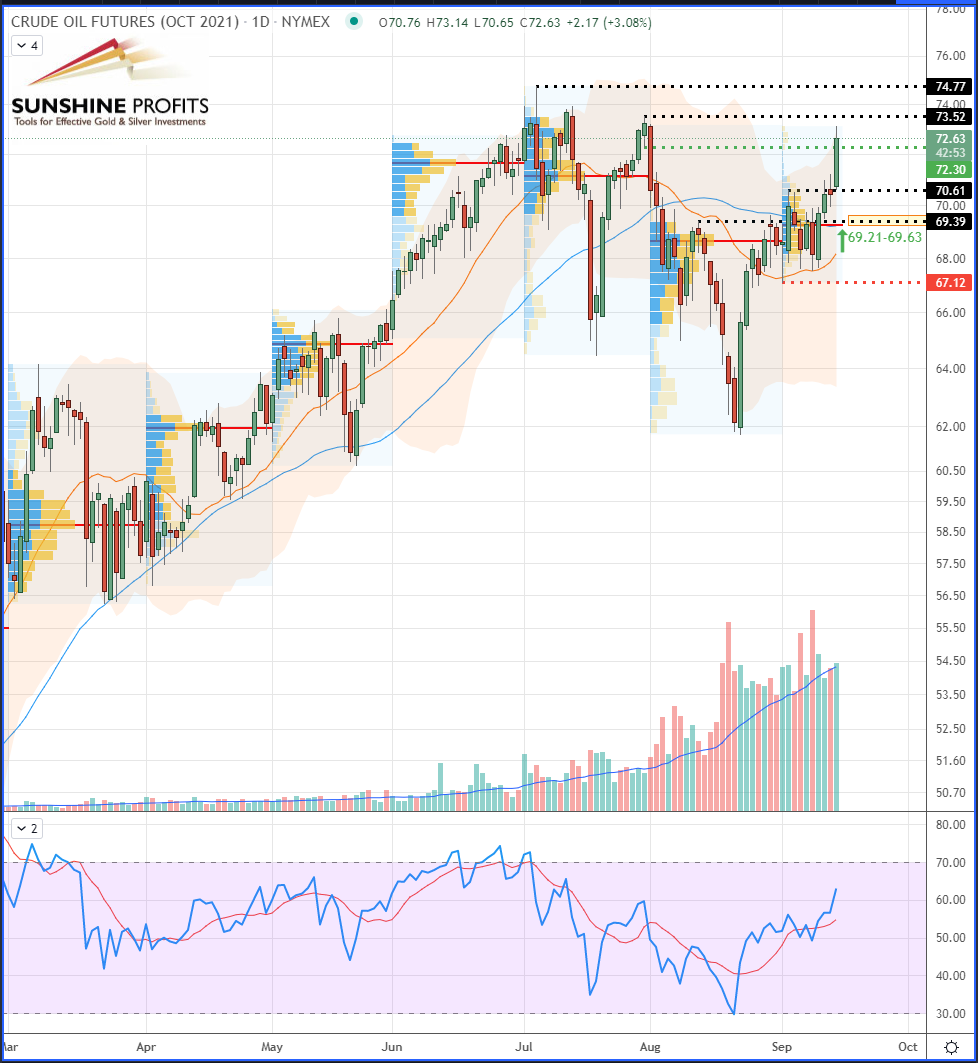
Figure 1 – WTI Crude Oil (CLV21) Futures (October contract, daily)
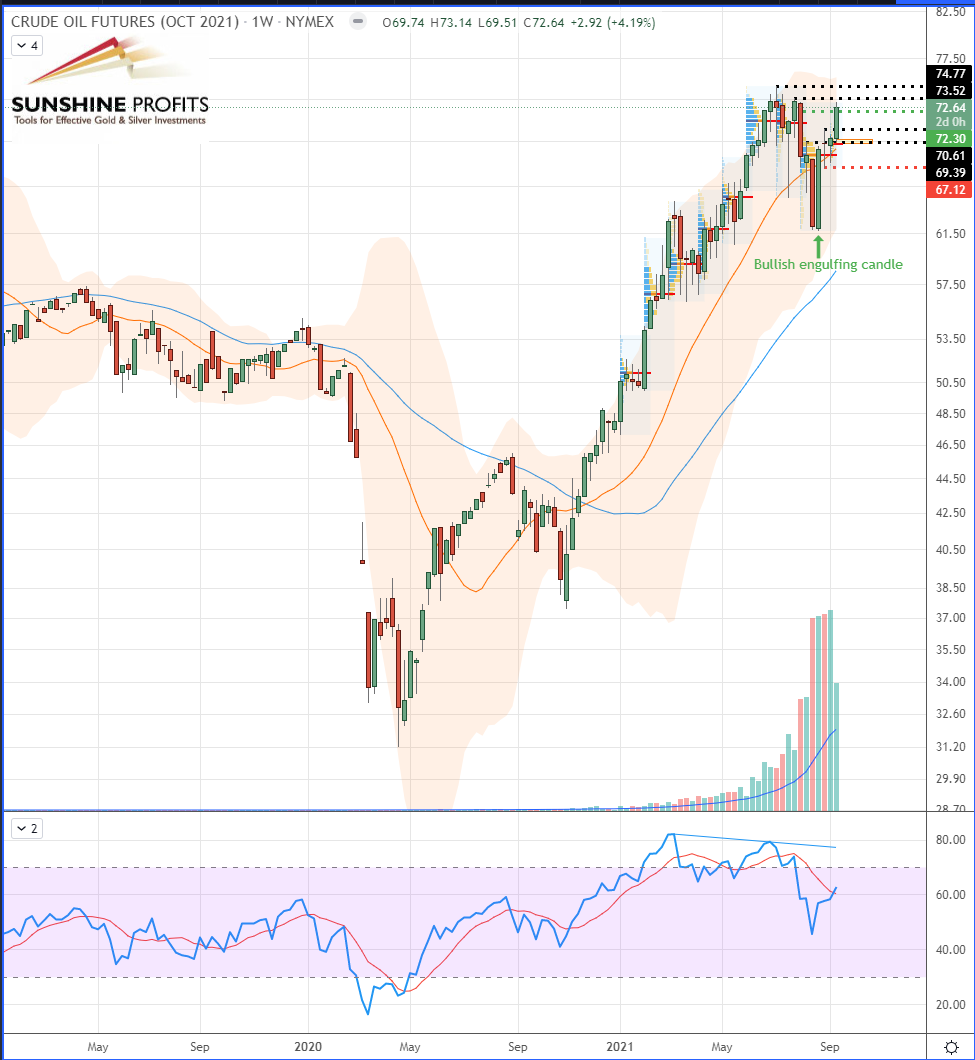
Figure 2 – WTI Crude Oil (CLV21) Futures (October contract, weeky)
In summary, our trading plan on crude oil relies on various scenarios that we have described. For now, in order to see a clearer market picture, we will wait for confirmation. However, as always, we provide you with a pre-defined position that will (or not) be executed, depending on the next price action and oil supply/demand.
As always, we’ll keep you, our subscribers, well-informed.
Today's premium Oil Trading Alert includes details of our new trading position. Interested in more exclusive updates? Join our premium Oil Trading Alerts newsletter and read all the details today.
Thank you.
Sebastien Bischeri,
Oil & Gas Trading Strategist - sraightaway, which would confirm a long-term bearish trend configuration by failing to break higher, above the $73.52 and $74.77 highs (the next resistance levels). Therefore, the market would be topping at a lower high (as defined by the Dow Theory) [scenario A].


Free Gold & Oil Newsletter
with details not available
to 99% investors
+ 7 days of Gold Alerts
+ Mining Stock Rankings
Gold Alerts
More-
Status
New 2024 Lows in Miners, New Highs in The USD Index
January 17, 2024, 12:19 PM -
Status
Soaring USD is SO Unsurprising – And SO Full of Implications
January 16, 2024, 8:40 AM -
Status
Rare Opportunity in Rare Earth Minerals?
January 15, 2024, 2:06 PM
Metals charts


