

Briefly: in our opinion, full (200% of the regular size of the position) speculative short positions in gold, silver and mining stocks are justified from the risk/reward perspective at the moment of publishing this alert. We are – most likely very temporarily – decreasing the size of the trading position.
The general stock market declined last week and the volatility index spiked along with the price of gold. Gold stocks were affected as well and the strength of the impact was less visible in case of silver and silver stocks. Mining stocks have completed the inverse head-and-shoulders pattern and the PMs are up in today’s pre-market trading as well. Did the trend just reverse and what are the implications of what happened?
Before looking at the charts, let’s recall what was the likely reason behind the rally. Declining stocks don’t provide the full picture and focusing on them most likely makes one miss the key detail. The latter came from the US President, Donald Trump. We already discussed it in the previous Alerts, but it seems that reminding the key issues regarding the similarity between now and 2013 and the analogy to the January speech is a good idea:
The 2013 Link
The precious metals market moved higher yesterday, while it should have moved lower or continued to do nothing. At least if the extremely accurate link to 2013 was to be upheld. But we saw a rally. So, what changed?
Technically:
Gold: from the short-term point of view, the link was invalidated and from the long-term point of view nothing really changed. Back in 2013, before the plunge, gold was in the sideways trading pattern that followed a sizable several-month-long decline. This is also what we see right now.
Silver: the white metal didn’t even move above the previous highs, so the link is just as up-to-date as it was previously. The decline doesn’t have to start in exactly the same way as it did in 2013, and the overall similarity remains in place.
Mining stocks: looking at the very long-term HUI Index chart, we see that the key factors that pointed to similarity to 2013 remain intact: the size of the retracement after the initial bottom (mid-2012, late 2016), the pace of the decline (purple line) and the sharpness of the decline that that immediately followed the breakdown below the initial low. The only thing that is different now is that the current corrective upswing is bigger. But, does it invalidate anything? The only thing that would make the current situation different, would be an invalidation of the breakdown below the initial lows (late 2016). This has not happened. Surely, it would be nice to see the 100% repeat of the 2013 decline, but seeing a repeat “just” the vast majority thereof is already remarkable and something to pay great attention to. The shapes and sizes of the corrections in the HUI didn’t have to be identical for the analogy to remain in place and for the implications to remain intact, and thus what we saw this week didn’t invalidate the key 2013-now link.
Logically:
President Trump may be the leader of the most powerful country on Earth, but his quick remarks that are not verified by actions are not even close to being enough to turn around medium-term trends. Such surprising comments can distort the short-term price movement and result in different route that the market will ultimately take while moving to its targets, but not much else is likely to happen.
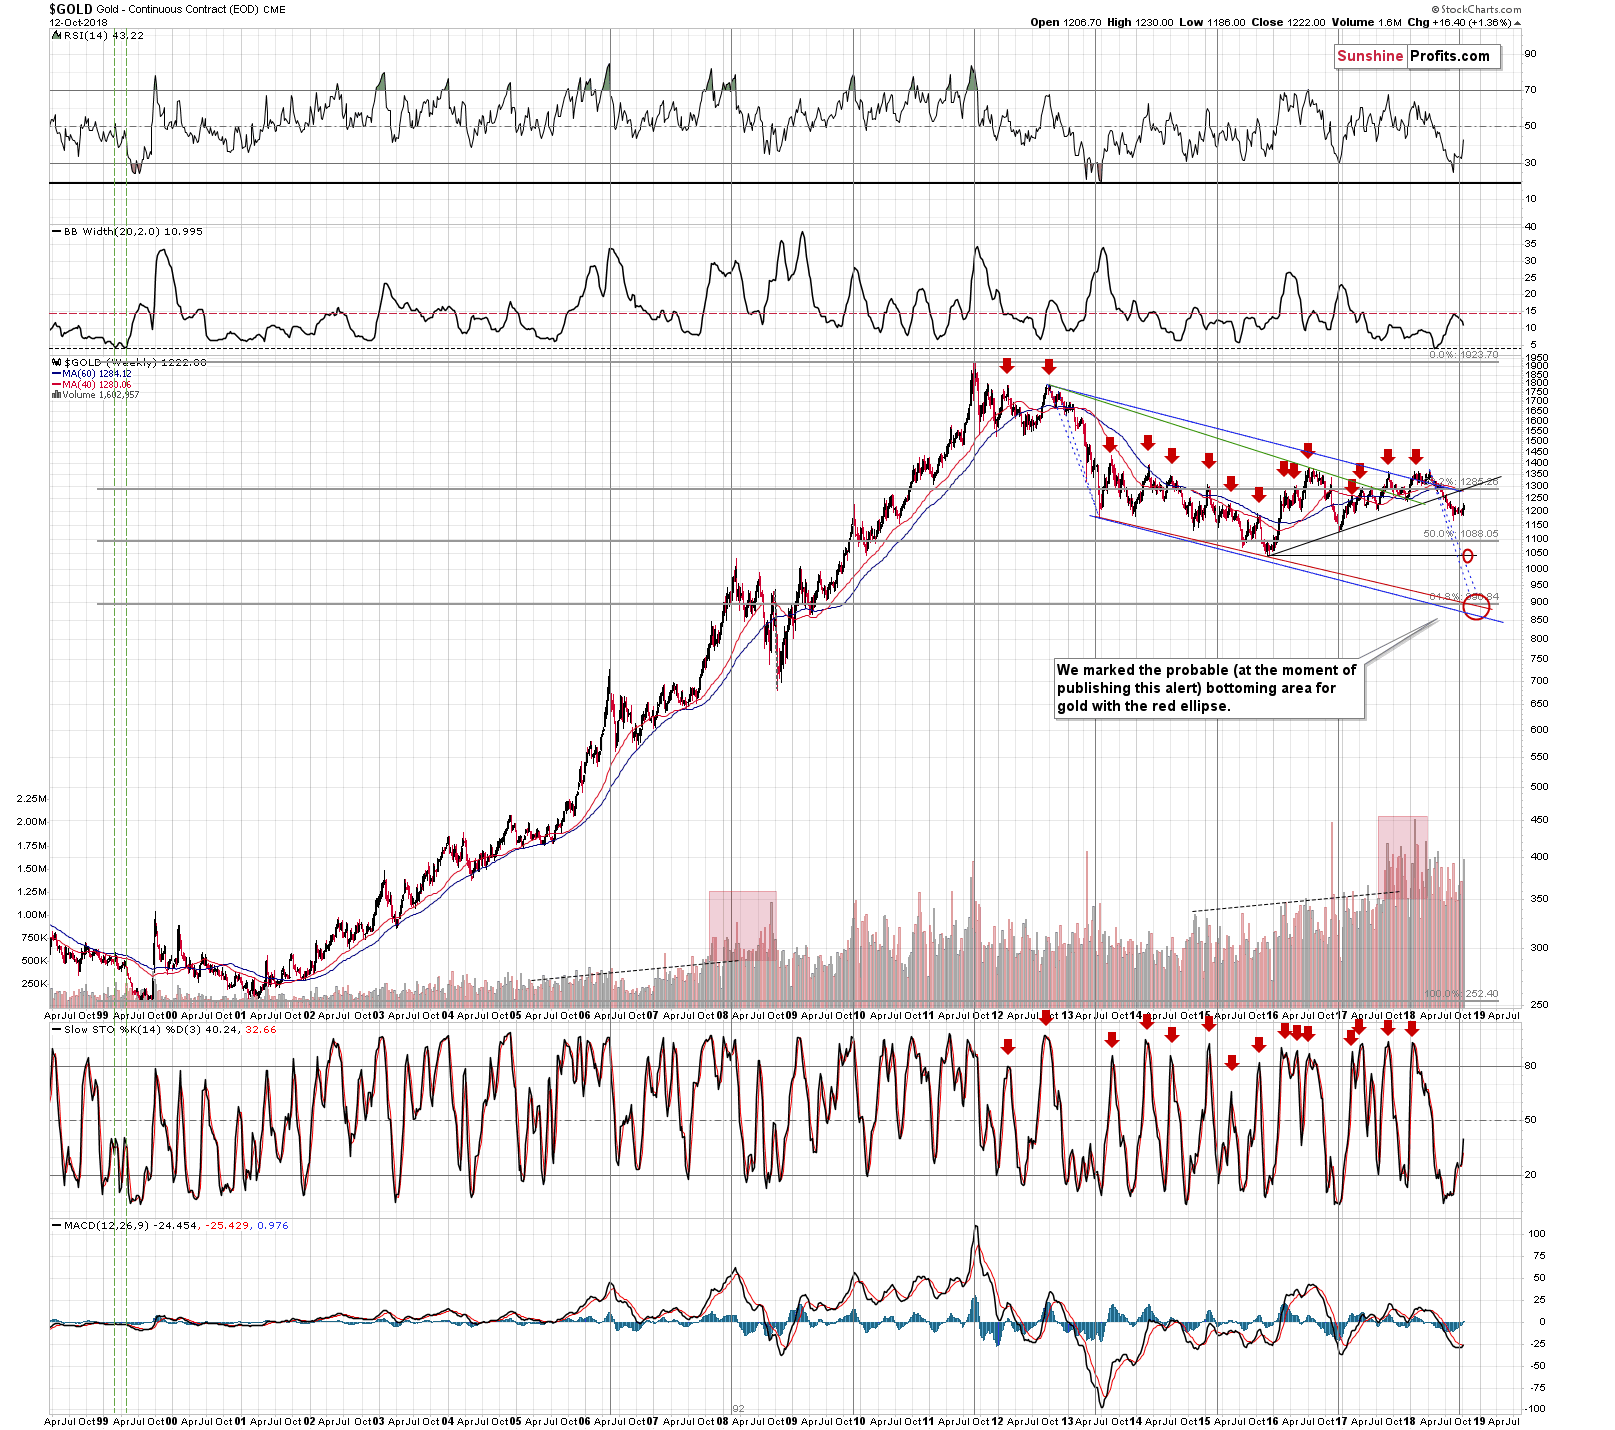
The main reason to expect new lows in gold, silver and mining stocks (below the 2015 and 2016 lows) is that the precious metals investors were not scared enough at those lows. We saw the surveys and we know what people were sending in the e-mails and writing on various forums. People didn’t hate gold, and they didn’t think that the bottom is nowhere in sight. That’s what they should be thinking at the true bottom. Can Trump’s quick remarks change the above? Not at all. Consequently, the PMs are still likely to slide to new lows and since they are – quite precisely, but not extremely so – repeating the performance of 2013, the decline is likely to be very volatile. This means that waiting on the sidelines for the decline’s start might mean that one would miss it.
Comments-based Rally as a Shorting Opportunity
Besides, if yesterday’s action was indeed caused by Trump’s comments (which may not really represent his true opinion on the matter), we have a guideline from the past on how temporary the effect might be. In January 2018 Treasury Secretary Steven Mnuchin said that the U.S. would welcome a weaker dollar, which was something that anyone in his position should have never said, so that surprised the market. The USD Index declined and gold soared based on these comments. The next day, January 25th, 2018, gold formed its 2018 top in terms of the closing prices. In other words, in terms of the closing prices, higher gold prices were never seen since that time. The volume in gold was huge at that time. In fact, that was the only time from the recent past when gold’s volume was comparable to what we saw yesterday.
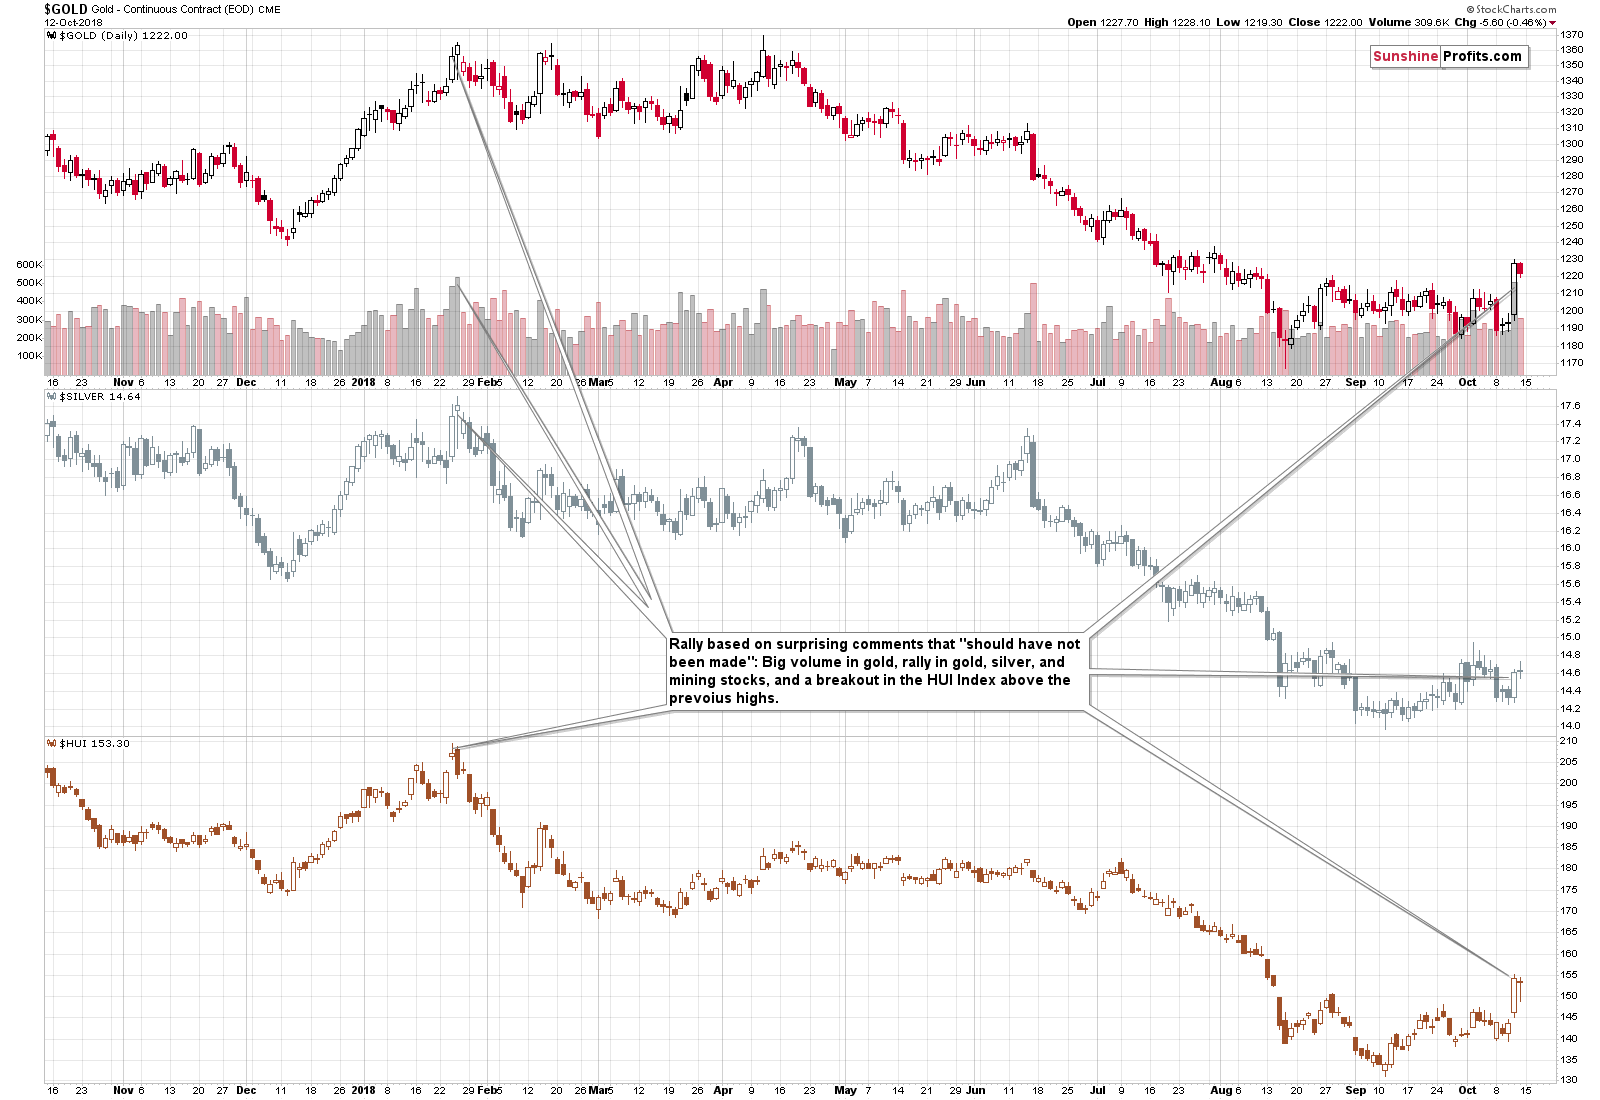
There are even more similarities. Gold stocks rallied above the previous highs just like they did yesterday. It all looked very bullish at the first sight and it generated a lot of feedback and questions. We received numerous questions recently as well, so the situation is similar also from this point of view.
The emotions were high in late January 2018 and they are high now. But, it’s our job to stick to the facts and logic and analyze the emotionality instead of being influenced by it. In the January 25th, 2018 regular Gold & Silver Trading Alert we wrote about 50% of the regular short position in gold, silver, and mining stocks, and in the intraday follow-up we increased this position to 150%. It was indeed an excellent time to enter, not exit a short position. And the same appears to be the case today. Surely, we may have temporarily (in the next several hours or so) higher prices, but the odds are that this is a shorting opportunity in disguise.
Now, keeping the above in mind, let’s take a look what happened in gold on Friday and what’s happening today.
Gold: Price Moves vs. Changes
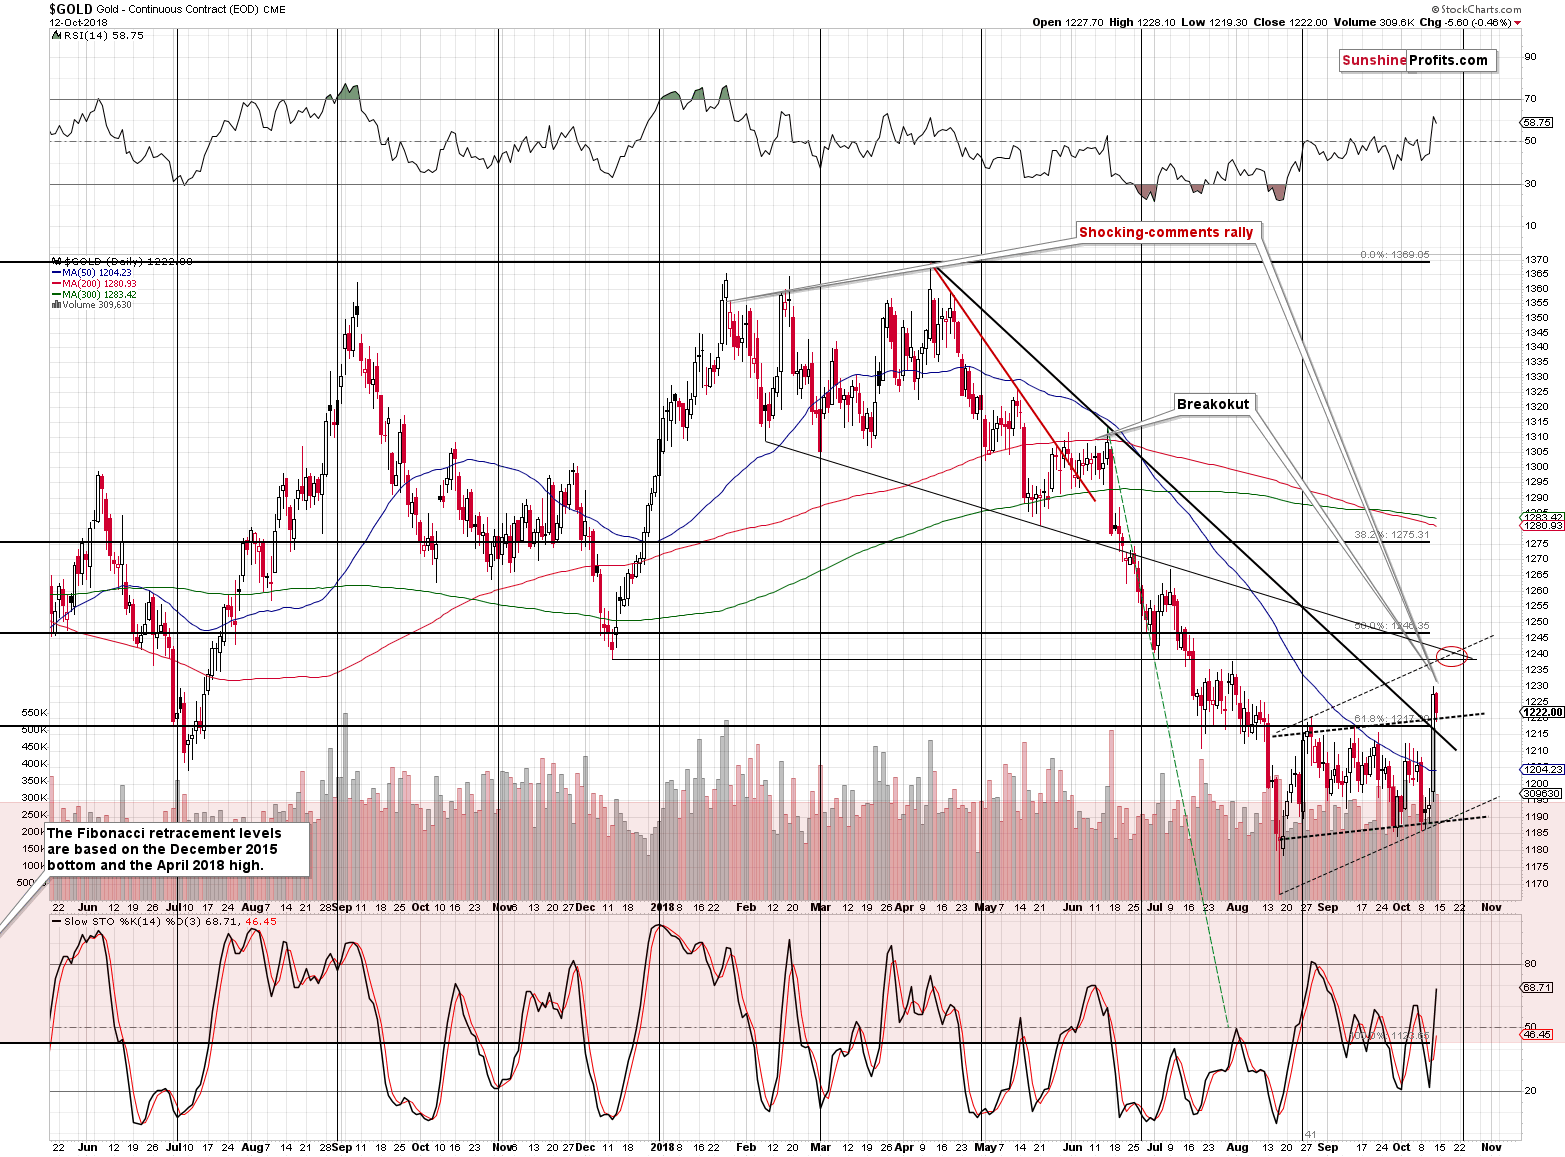
Gold moved lower on Friday, but it didn’t invalidate the previous breakout in terms of daily or weekly closing prices, so it was confirmed. The implications are bullish for the short term. The likely upside target is now close to the $1,240 level. This level is created by the December 2017 bottom ($1,238.30), the early July 2018 bottom and the late July 2018 high.
Now, today’s pre-market high for gold’s futures (as reported by finance.yahoo.com) was $1,236.90. That’s just $1.40 below the December 2017 bottom. Consequently, it seems quite likely that the bullish action that was likely to happen based on the previous breakout, has already happened.
Moving back to the context that we quoted above, please note that after the shocking January 2018 comments gold continued to move higher in a specific way. It first soared, then corrected and then rallied once again. You can see this correction on an intraday basis in the candlestick that marked the exact top – price moved lower first and rallied shortly thereafter. It’s not 100% like that in this case as gold closed lower on Friday, but taking intraday action into account (including what happened in today’s pre-market trading) we see that the action is indeed very similar. Based on both of the above factors: gold being just below the short-term upside target and based on the link to the previous post-shocking-comments performance, it seems that the top is already in, or that it is extremely close.
But, what if the market does the unlikely (after all, it’s called unlikely, not impossible, for a reason – it has to happen every now and then) and soars even higher?
Then it’s likely to rally to about $1,290 or so – to the rising long-term resistance line that it broke several months ago. And then gold would be likely to decline anyway.
But, that’s not the likely outcome at the moment. What would make the above more likely? A proof of additional strength in gold. Gold reacted to shocking news – that’s normal and doesn’t invalidate anything. But, if gold’s strength continued, it would cease to be normal and it would be come bullish (only for the short term, but still). That’s why we moved the stop-loss level above the $1,250. It’s above the above-mentioned $1,240 resistance, so that a temporary and small move above this level would not close the position.
But, if gold moved above it decisively, the $1,290 level would become the next likely price target for the short term (again, gold would not automatically change the medium-term trend, only the short-term one). So, we are keeping our position intact, but if gold shows strength, we are not going to hold onto the current position forever. It would be better to take our profits off the table at that time and to re-enter the short positions at higher price levels. At this time, however, keeping the position intact appears justified.
Here’s another reason for it:
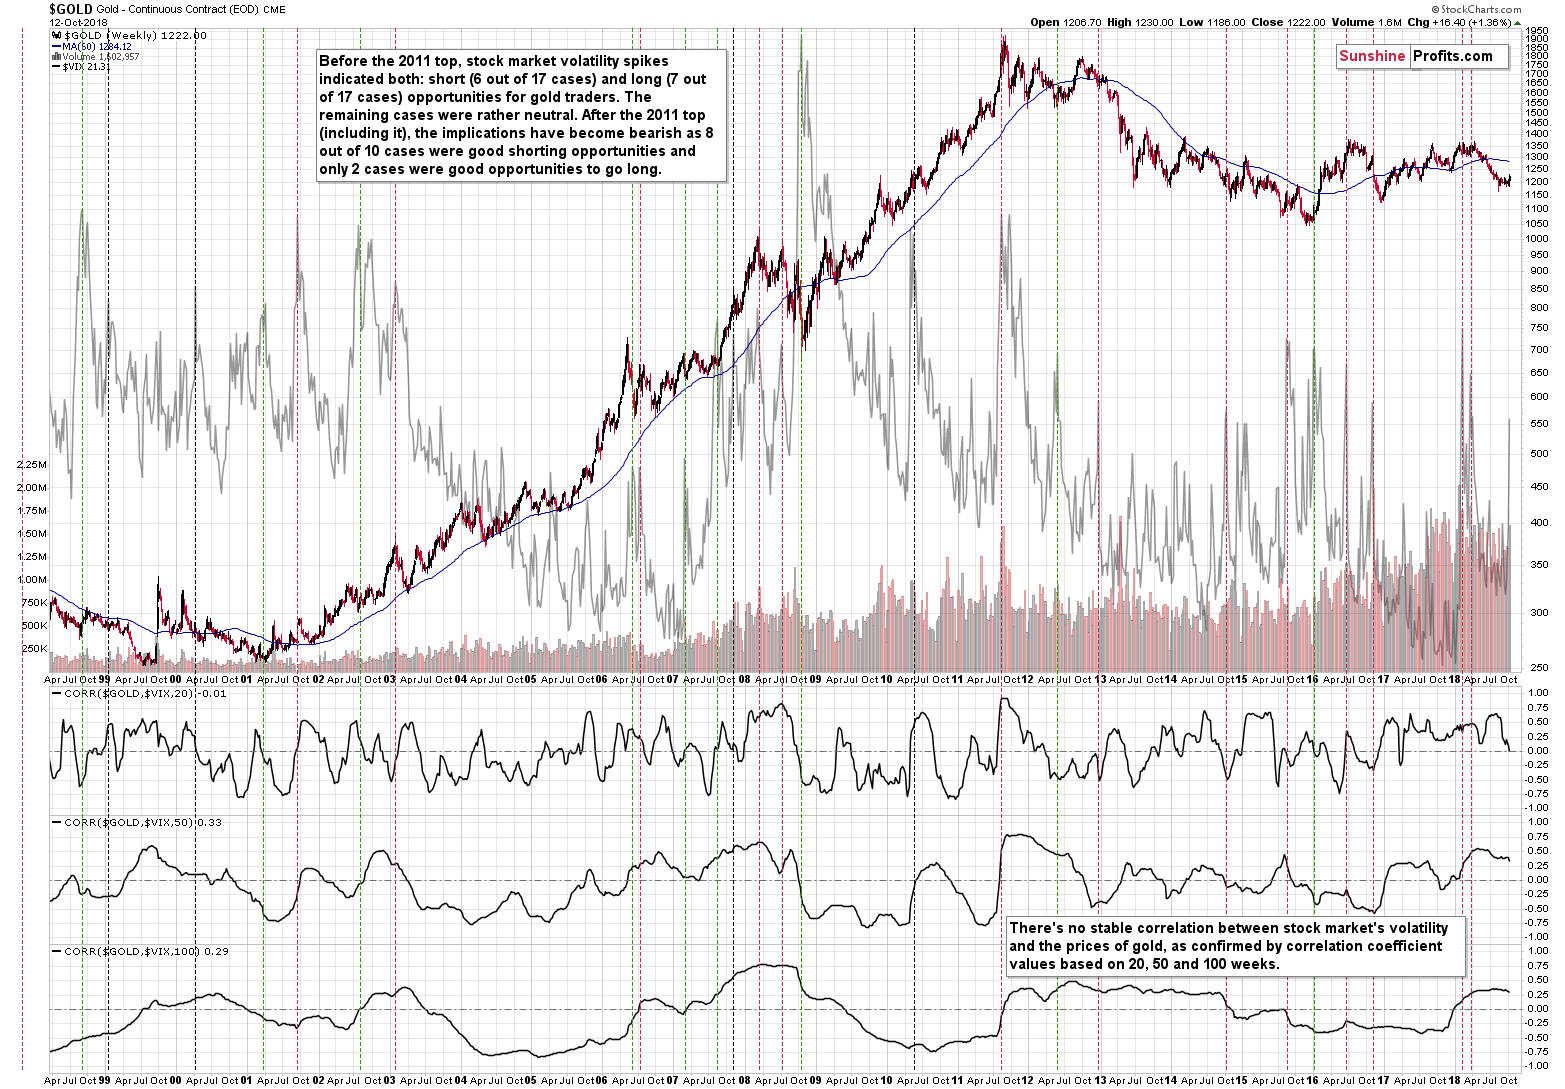
The spike in VIX, the volatility index, is something that in the vast majority of cases (8 out of 10 since the 2011 top) meant excellent shorting opportunities in gold. We previously reported 7 out of 9 efficiency, as we counted the two previous 2018 spikes as one. It seems that the tops were far apart by enough days for them to count as separate cases. What does the above imply for the gold market right now? That it’s likely to decline and that it’s likely to decline significantly.
The Silver Signs
The short-term spike in the silver to gold ratio and the RSI indicator confirms that we have just seen a major top and that this rally in gold (silver didn’t move higher in terms of weekly closing prices last week) is not to be trusted.
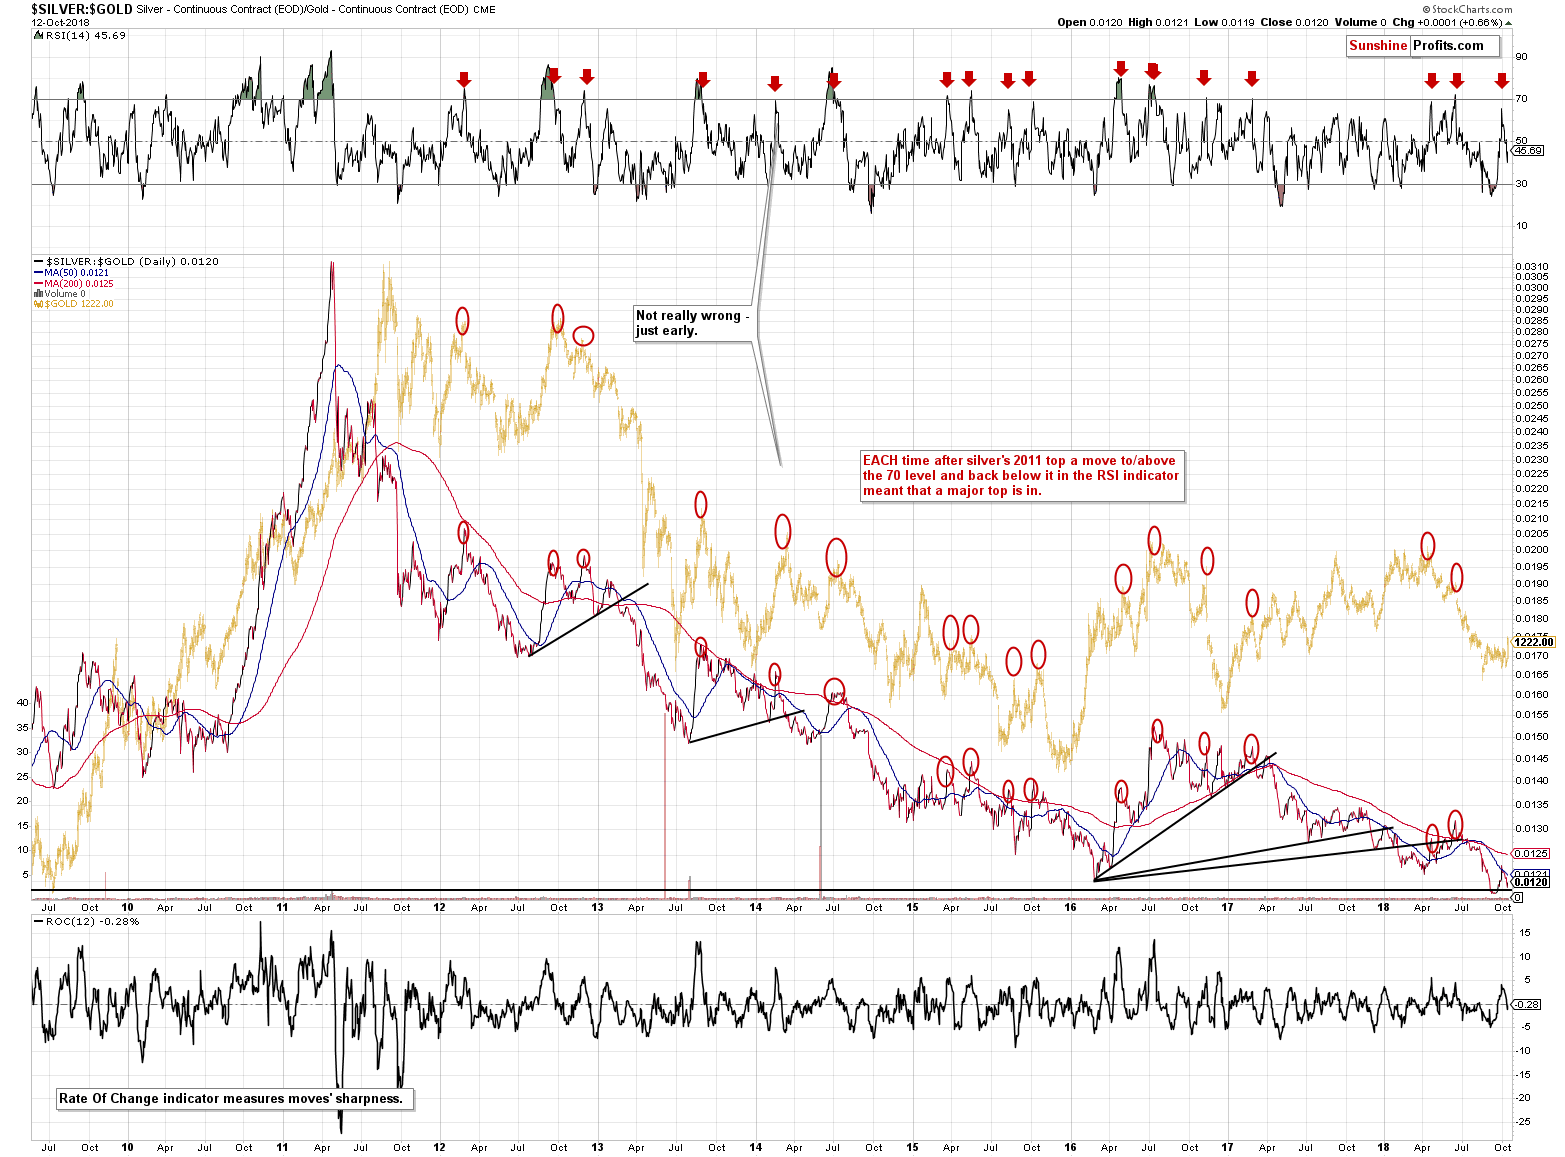
The red arrows mark cases when the RSI was above or very close to the 70 level and then declined. In practically all cases major declines followed, even if they didn’t start right away. This is a very strong indication that the next big move is going to be to the downside, not to the upside.
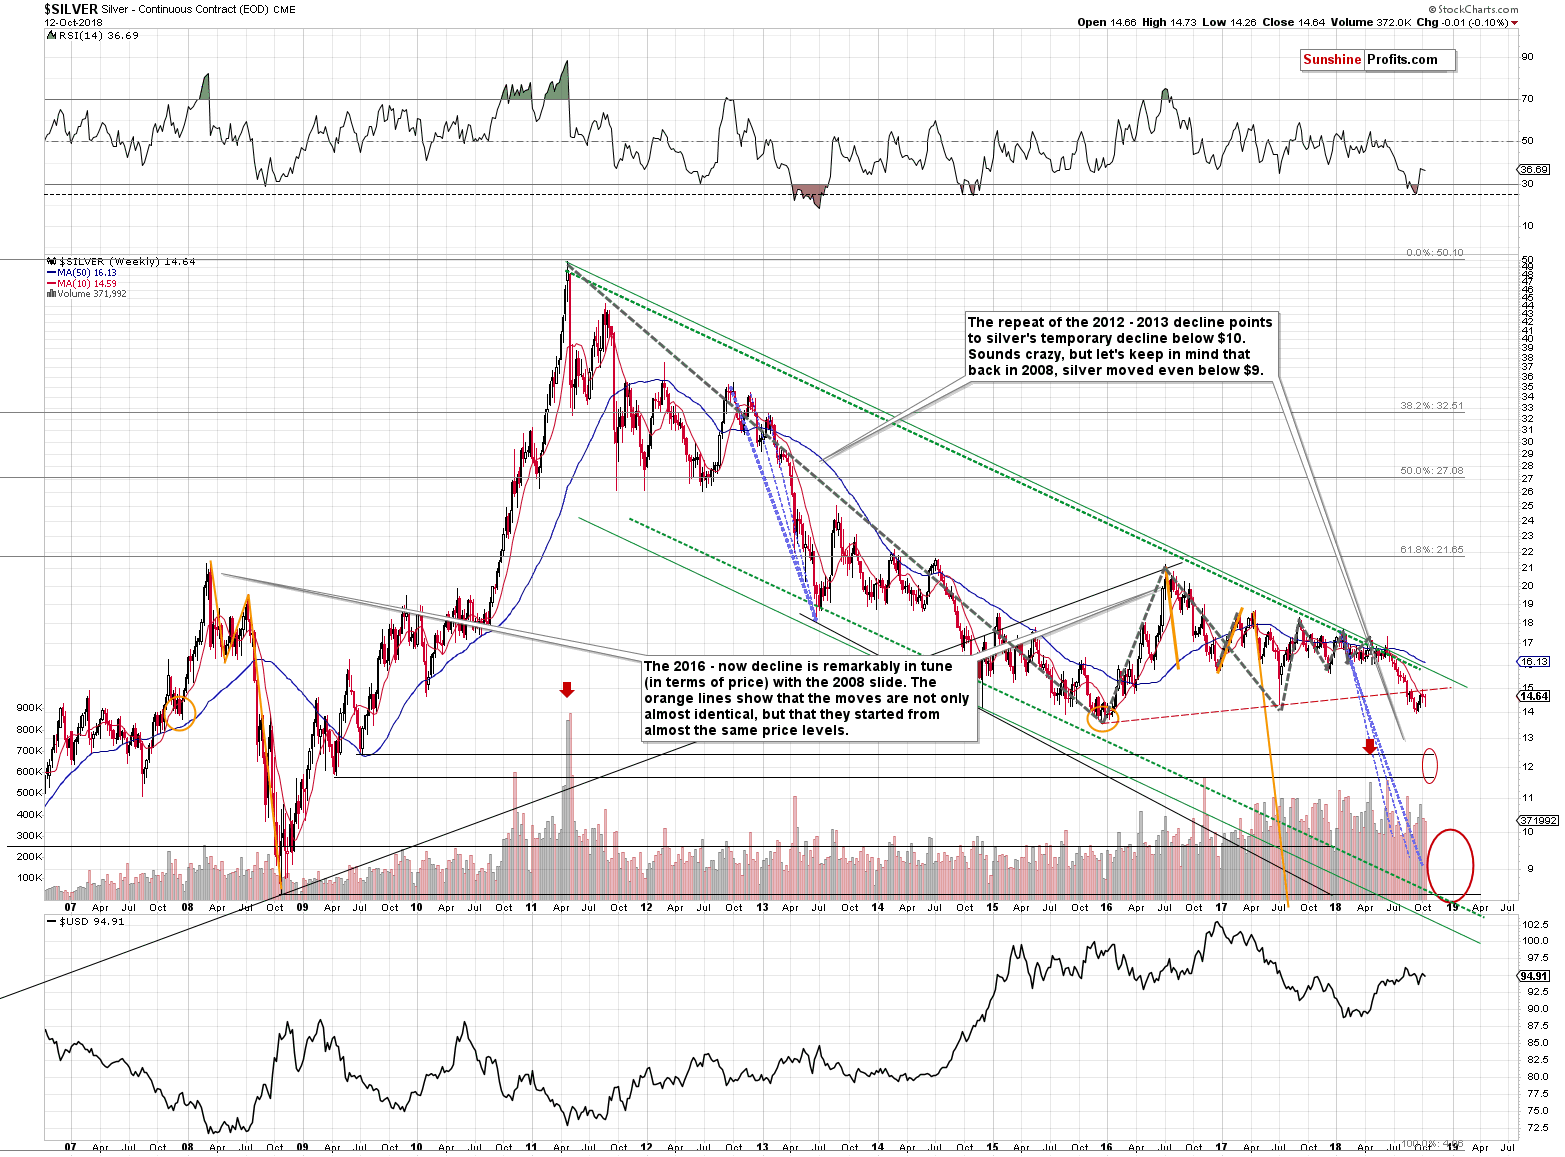
Since we are discussing silver, please note that the white metal didn’t end the week back above the rising red resistance line. Conversely, it remains below it even taking into account today’s pre-market upswing. The intraday high in silver futures is $14.81 so far, while the resistance is at about $15. The outlook remains bearish.
Having said the above, let’s take a look at the mining stocks.
Miners’ ABC Corrective Rally and the Inverse H&S Pattern
In Friday’s Alert, we wrote the following:
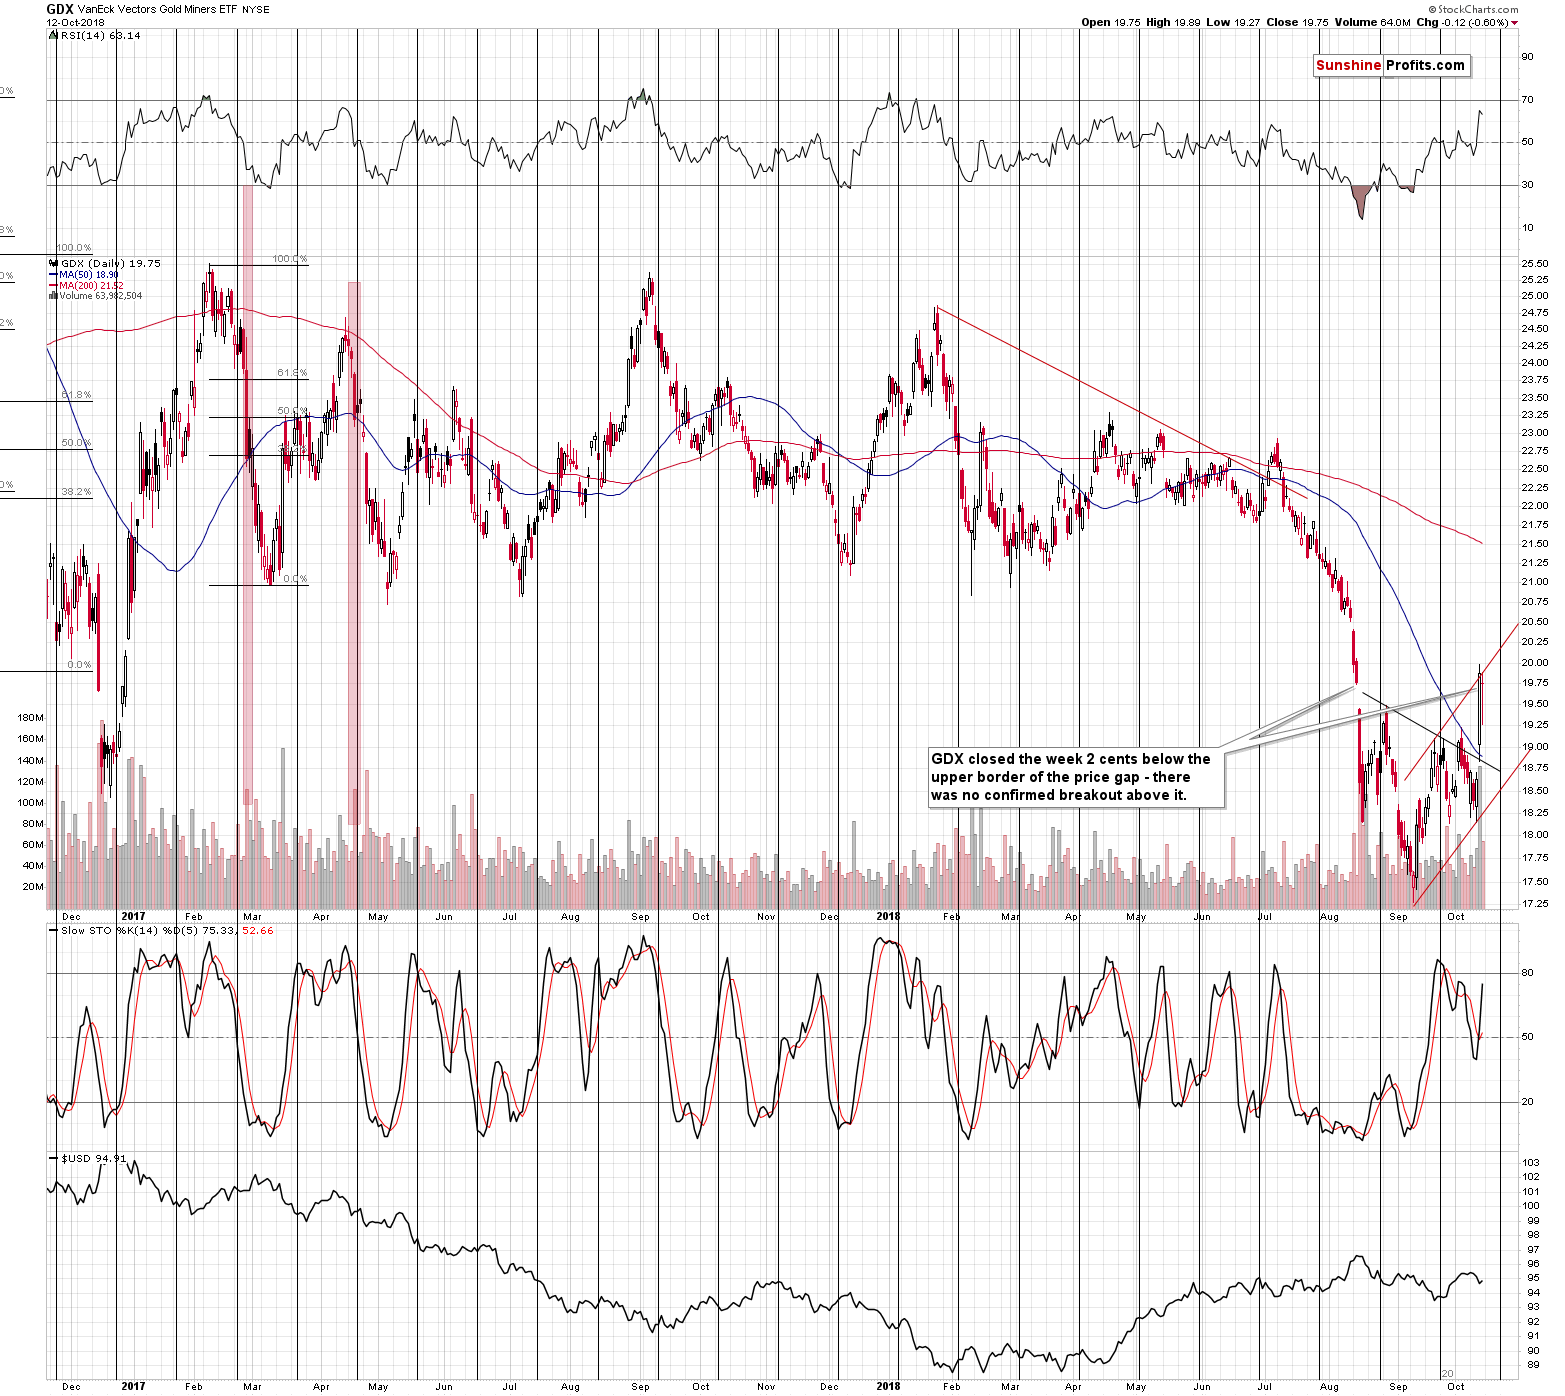
Miners rallied on huge volume and closed the session a bit above their previous price gap – practically right at the upper border of the flag pattern. The ABC (zigzag) flag pattern is based on the assumption that the initial rally of the correction will be similar in size to the final one.
At the same time, the miners broke above the neck level of the inverse head-and-shoulders pattern, which is a bullish development. This breakout was likely to be followed by a rally and we did see a rally. The price may have further to go based on this pattern, but since that was just one close after the breakout, and the rally had very volatile and news-based nature, it’s unclear if it’s sustainable, especially given the less visible, but not less important details.
The miners declined a bit on Friday (just like gold did) and they closed the week back below the upper border of the previous price gap. At the same time, they closed it within the rising flag pattern.
Technically, the situation is not as bullish as it appears at the first sight. The inverse head-and-shoulders formation was not completed in case of silver stocks and other resistance levels and techniques (price gap and the zigzag-shape corrective pattern) suggest lower, not higher prices.
Can one blindly trust the inverse H&S pattern in light of all that we wrote so far today?
Well… We don’t intend to be mean, but that’s not the first time when everyone gets excited about an inverse H&S in the mining stocks. One of the analysts who emphasize the bullish nature of the inverse H&S pattern is Jeff Clark. And here’s the link to Jeff Clark’s bullish description of the inverse H&S in the GDX ETF… From May.
In short, the inverse H&S at that time had the left shoulder in late April, 2018, head at the early May bottom, and the right shoulder in the first half of May, but closer to the middle of the month. The formation was completed and the bullish analysis that includes chart from May the 10th, 2018 that was posted on May the 11th, 2018. Mr. Clark stated that he was convinced that gold and silver stocks would be much higher later this year (GDX was at about $23 at that time and it closed below $20 on Friday) and he stated that while he was not yet totally in love with the way gold stocks looked, he was attracted enough to the sector to start adding a little exposure right there.
It turned out that May the 10th was the top in terms of the closing prices and May the 11th was the top in terms of the intraday highs in the GDX ETF. Higher prices were never seen since that time.
We would like to stress that it is not our aim to criticize other analysts. Everyone has the right to make incorrect market calls every now and then and perfection is not something that’s achievable in case of trading. Our aim is to show you that an inverse head-and-shoulders formation in mining stocks is not something that absolutely needs to be followed by much higher prices. It can easily be overcome by more important factors.
Platinum’s Strength
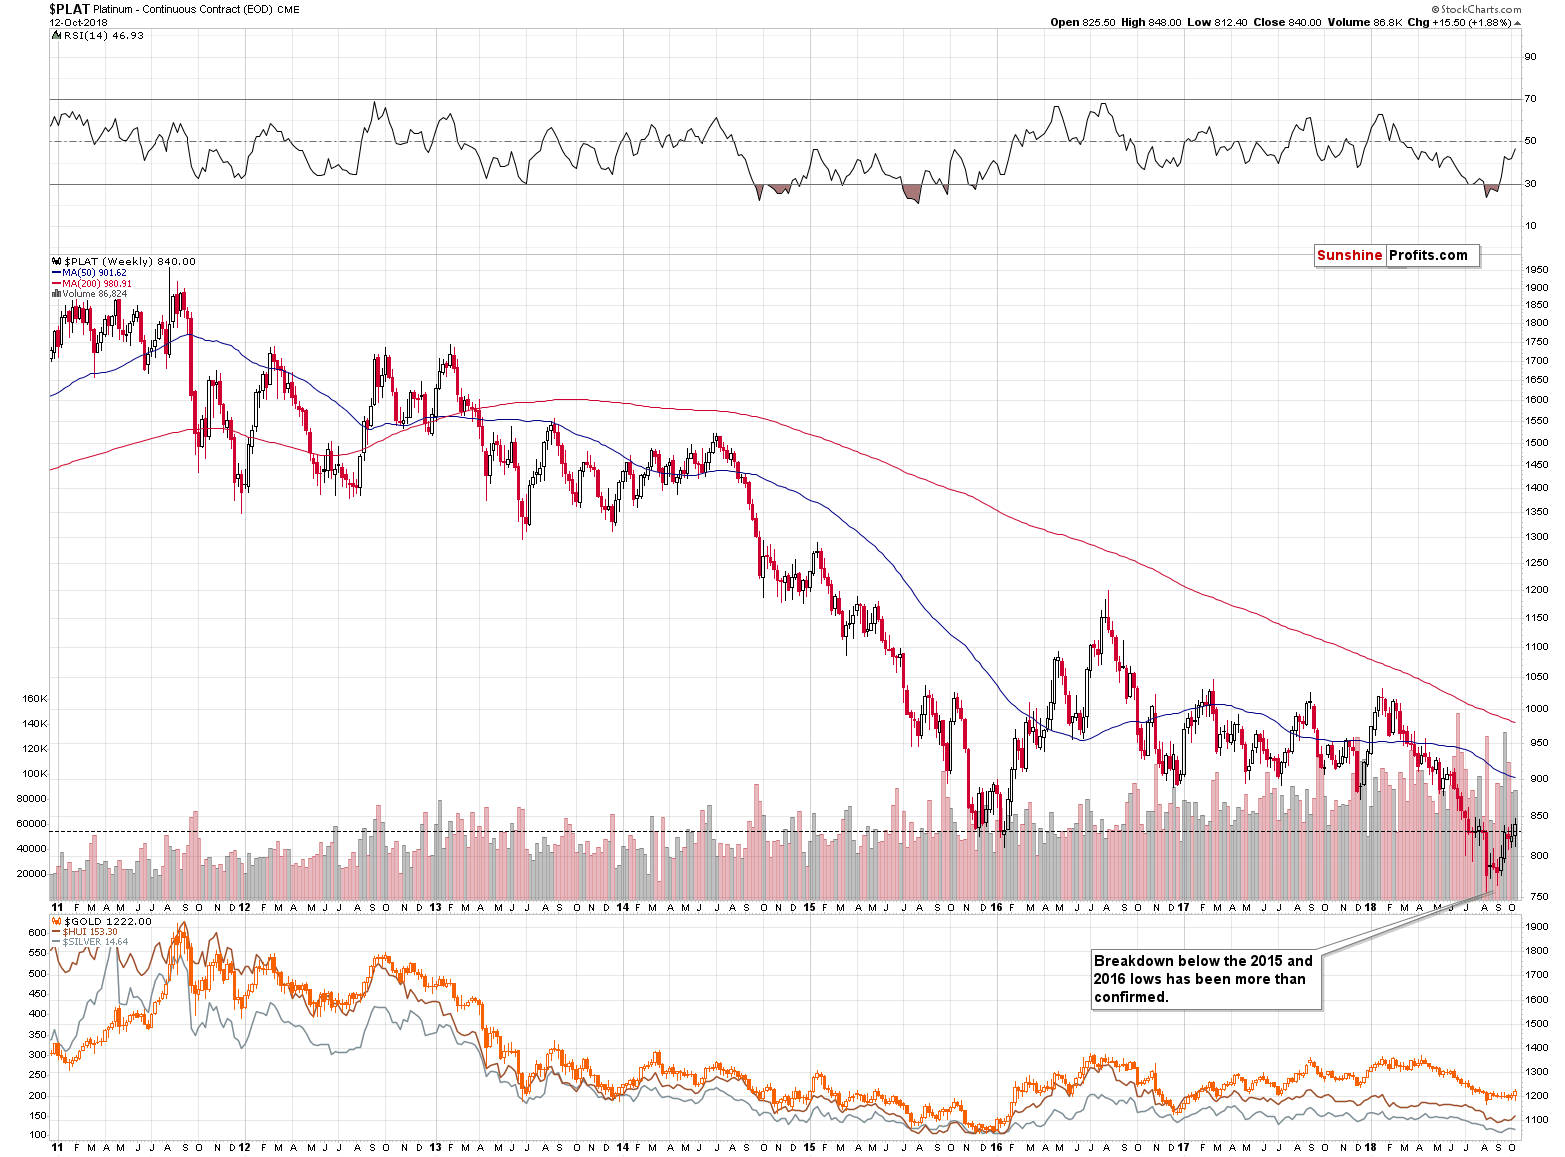
Platinum closed the week above the 2016 bottom, which means that the breakdown below this level was invalidated in terms of the weekly closing prices. This is a bullish factor of medium-term strength, which makes the overall outlook for the precious metals sector less bearish. As a consequence, we are lowering the size of the current position from 250% of the regular position to 200%.
Important Analyses
Before summarizing, we would like to emphasize that we have recently posted several analyses that are very important and that one should keep in mind, especially in the next several weeks. If you haven’t had the chance of reading them previously, we encourage you to do so today:
- Dear Gold Investor - Letters from 2013 - Analogy to 2013, which should make it easier to trade the upcoming sizable upswing (if enough factors point to it, that is) and to enter the market close to the final bottom.
- Gold to Soar Above $6,000 - discussion of gold’s long-term upside target of $6,000.
- Preparing for THE Bottom in Gold: Part 6 – What to Buy - extremely important analysis of the portfolio structure for the next huge, multi-year rally in the precious metals.
- Preparing for THE Bottom in Gold: Part 7 – Buy-and-hold on Steroids - description of a strategy dedicated to significantly boosting one’s long-term investment returns while staying invested in the PM sector.
- Gold’s Downside Target, Upcoming Rebound, and Miners’ Buy Plan - details regarding the shape of the following price moves, a buying plan for mining stocks, and a brief discussion of the final price targets for the current decline.
- Gold: What Happened vs. What Changed - discussion of the latest extreme readings from gold’s CoT report
- Key Factors for Gold & Silver Investors - discussion of key, long-term factors that support the bearish outlook for PMs. We are often asked what makes us so bearish – this article is a reply to this question.
- The Upcoming Silver Surprise - two sets of price targets for gold, silver and mining stocks: the initial and the final one.
- Precious Metals Sector: It’s 2013 All Over Again - comparison between 2013 and 2018 throughout the precious metals sector, the general stock market and the USD Index. Multiple similarities point to the repeat of a 2013-style volatile decline in the PMs.
- Changing One's Mind - Why, When, and How – discussing the way of analyzing the market that helps to stay focused on the growing one’s capital while not being influenced by the loss aversion bias. This essay might be particularly useful in light of the recent upswing in the PMs.
Summary
Summing up, the breakout in gold is a bullish development for the short term, but the rally that was likely to be seen based on it, could have already taken place. This, plus several other factors continue to make the outlook very bearish. To be precise, due to platinum’s weekly close back above the 2016 low, it’s not as bearish as it was previously so we are decreasing the size of our short positions, but we are keeping them in place. In late January 2018, somewhat similar comments resulted in gold forming the yearly top and an excellent shorting opportunity. It seems that we may be seeing something very similar right now, even despite the inverse head-and-shoulders pattern in the mining stocks. All in all, it seems that the huge profits on our short positions will soon become enormous, even if it takes a few more days before that happens.
As always, we’ll keep you – our subscribers – informed.
To summarize:
Trading capital (supplementary part of the portfolio; our opinion): Full short positions (200% of the full position) in gold, silver and mining stocks are justified from the risk/reward perspective with the following stop-loss orders and exit profit-take price levels:
- Gold: profit-take exit price: $1,062; stop-loss: $1,253; initial target price for the DGLD ETN: $82.96; stop-loss for the DGLD ETN $49.47
- Silver: profit-take exit price: $12.72; stop-loss: $15.76; initial target price for the DSLV ETN: $46.97; stop-loss for the DSLV ETN $27.37
- Mining stocks (price levels for the GDX ETF): profit-take exit price: $13.12; stop-loss: $20.83; initial target price for the DUST ETF: $80.97; stop-loss for the DUST ETF $27.67
Note: the above is a specific preparation for a possible sudden price drop, it does not reflect the most likely outcome. You will find a more detailed explanation in our August 1 Alert. In case one wants to bet on junior mining stocks’ prices (we do not suggest doing so – we think senior mining stocks are more predictable in the case of short-term trades – if one wants to do it anyway, we provide the details), here are the stop-loss details and target prices:
- GDXJ ETF: profit-take exit price: $17.52; stop-loss: $31.23
- JDST ETF: initial target price: $154.97 stop-loss: $51.78
Long-term capital (core part of the portfolio; our opinion): No positions (in other words: cash)
Insurance capital (core part of the portfolio; our opinion): Full position
Important Details for New Subscribers
Whether you already subscribed or not, we encourage you to find out how to make the most of our alerts and read our replies to the most common alert-and-gold-trading-related-questions.
Please note that the in the trading section we describe the situation for the day that the alert is posted. In other words, it we are writing about a speculative position, it means that it is up-to-date on the day it was posted. We are also featuring the initial target prices, so that you can decide whether keeping a position on a given day is something that is in tune with your approach (some moves are too small for medium-term traders and some might appear too big for day-traders).
Plus, you might want to read why our stop-loss orders are usually relatively far from the current price.
Please note that a full position doesn’t mean using all of the capital for a given trade. You will find details on our thoughts on gold portfolio structuring in the Key Insights section on our website.
As a reminder – “initial target price” means exactly that – an “initial” one, it’s not a price level at which we suggest closing positions. If this becomes the case (like it did in the previous trade) we will refer to these levels as levels of exit orders (exactly as we’ve done previously). Stop-loss levels, however, are naturally not “initial”, but something that, in our opinion, might be entered as an order.
Since it is impossible to synchronize target prices and stop-loss levels for all the ETFs and ETNs with the main markets that we provide these levels for (gold, silver and mining stocks – the GDX ETF), the stop-loss levels and target prices for other ETNs and ETF (among other: UGLD, DGLD, USLV, DSLV, NUGT, DUST, JNUG, JDST) are provided as supplementary, and not as “final”. This means that if a stop-loss or a target level is reached for any of the “additional instruments” (DGLD for instance), but not for the “main instrument” (gold in this case), we will view positions in both gold and DGLD as still open and the stop-loss for DGLD would have to be moved lower. On the other hand, if gold moves to a stop-loss level but DGLD doesn’t, then we will view both positions (in gold and DGLD) as closed. In other words, since it’s not possible to be 100% certain that each related instrument moves to a given level when the underlying instrument does, we can’t provide levels that would be binding. The levels that we do provide are our best estimate of the levels that will correspond to the levels in the underlying assets, but it will be the underlying assets that one will need to focus on regarding the signs pointing to closing a given position or keeping it open. We might adjust the levels in the “additional instruments” without adjusting the levels in the “main instruments”, which will simply mean that we have improved our estimation of these levels, not that we changed our outlook on the markets. We are already working on a tool that would update these levels on a daily basis for the most popular ETFs, ETNs and individual mining stocks.
Our preferred ways to invest in and to trade gold along with the reasoning can be found in the how to buy gold section. Additionally, our preferred ETFs and ETNs can be found in our Gold & Silver ETF Ranking.
As a reminder, Gold & Silver Trading Alerts are posted before or on each trading day (we usually post them before the opening bell, but we don't promise doing that each day). If there's anything urgent, we will send you an additional small alert before posting the main one.
=====
Latest Free Trading Alerts:
Stocks were retracing some of their recent sell-off on Friday, as investors' sentiment slightly improved following the quarterly corporate earnings releases, among other factors. The S&P 500 index bounced off its long-term upward trend line. But is this an upward reversal or just quick a dead-cat-bounce correction before another leg down?
Friday's Bounce, Trend Change?
Thanks to yesterday’s session crude oil lost 3% and approached the previously-broken barrier of $70. In this area oil bears met several other short-term supports, but are they stable enough to stop the sellers in the coming days?
=====
Thank you.
Sincerely,
Przemyslaw Radomski, CFA
Founder, Editor-in-chief, Gold & Silver Fund Manager
Gold & Silver Trading Alerts
Forex Trading Alerts
Oil Investment Updates
Oil Trading Alerts

