

Briefly: in our opinion, full (250% of the regular size of the position) speculative short positions in gold, silver and mining stocks are justified from the risk/reward perspective at the moment of publishing this alert.
History tends to repeat itself to a certain degree and consequently, if you know what part is being re-played, it gives you substantial power over those who don’t have such insight. That’s one of the most important foundations of technical analysis as human emotionality doesn’t change over time and people react to similar developments with similar emotions – thus creating similar price moves. All the patterns and indicators are just tools that aim to detect similar cases and to position one in tune with the previous outcomes. If a given signal was followed by the same outcome each time, then the odds are that the same signal will be followed by the same outcome also next time.
In many cases, a specific price pattern can be seen in many markets. For instance, the head and shoulders pattern – it’s present in practically all markets. It’s reliability and thus usability varies and before applying a certain pattern to a given market, one should check if it really works there. There’s also a different way to approach the above – instead of starting with an image of a pattern in mind and looking for it in a given market’s price performance, you could check directly for the price moves that are being repeated and see what happened next. You may not detect a universal pattern for all markets in this way, but you can detect a self-similar pattern in this specific market.
Of course, the key thing is to check whether the history that you’re comparing to the current case really is similar. There are many ways to do this. Beginning investors will not be aware of this technique at all, while advanced investors may sometimes utilize this technique in terms of price movement, sometimes also including the volume for confirmations. But it will be mostly professionals who will be able to take into account more factors than just price and volume coming from the specific market. Plus, the more specialized the professional, the more intricacies of a given market they will be aware of, and the more dimensions of similarities will they be able to detect.
We have already explained how many factors are pointing to lower precious metals values in the following weeks and a lot of these reasons are based on the similarities to the previous cases in the past. There are analogies in terms of interest rates increases, and there are similarities between the period from 2011 to today and the one that started in 1980. There are also similarities in the medium-term rallies in the USD Index. The most prominent and most important analogy, however, is the one that links the current price decline in gold, silver, and mining stocks with the one that we saw in 2013.
We wrote a lot in the previous days and weeks about why the situation is similar to the one in 2013 and we explained what kind of decline and follow-up rally we expect. But, what we haven’t discussed yet are the details that we will be looking for when determining the price targets for the rebounds and what things may happen that will likely prove to be false signals. Knowing this in advance should make it much easier to remain calm when things get very hot in the precious metals market and to make better trading and investment decisions overall.
Consequently, we decided to take a fresh look at gold’s price movement in 2013 and write short letters in the note-to-self format that should be extremely useful during times when gold performs similarly as it did 2013. For instance, now.
Without further introduction, let’s take a look at the gold chart along with special notes from the past (charts courtesy of http://stockcharts.com).
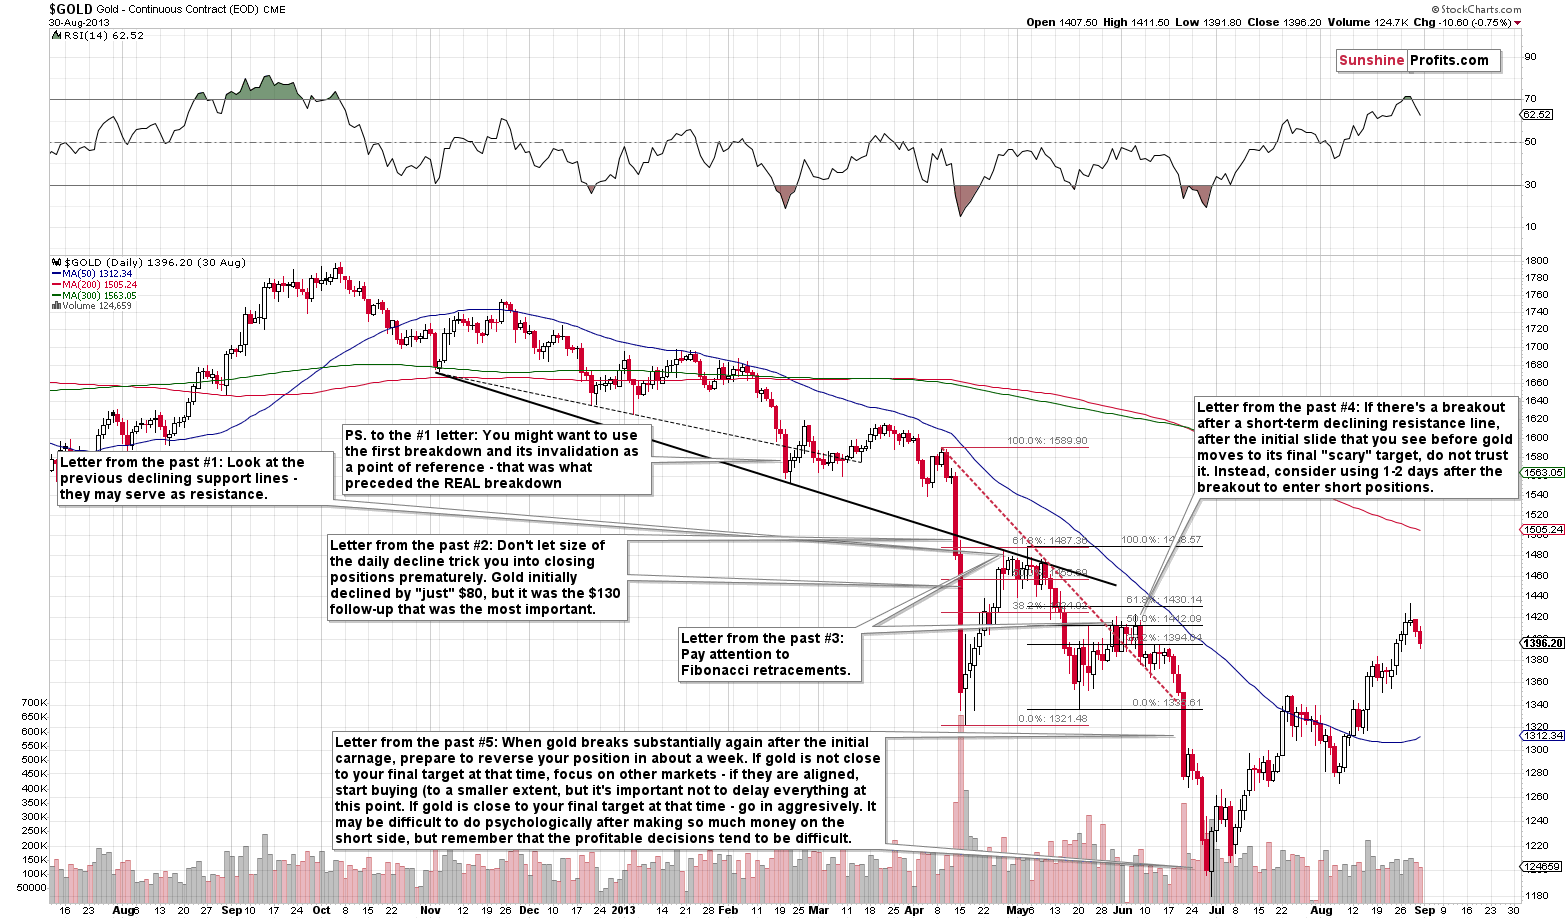
The first and the third letters are about the techniques that could help us detect the target for the most important corrective upswing of the decline. That’s very important because that may be the only corrective upswing that will be worth trading. The risk to reward ratio for trading very small moves is not favorable as the risk of missing profits on the decline is simply too big.
After the first major bottom (April 15 in terms of the daily closing prices and April 16 in terms of the intraday lows), the price started an approximately 2-week rally that took gold back to the previously broken declining support line and verified it as resistance. At the same time, it was also the 61.8% Fibonacci retracement level.
The Fibonacci retracement technique was useful also later on (June 2013) but in this case, it was the 50% retracement that stopped the upswing. History doesn’t have to repeat itself to the letter, so the lesson here is that all major Fibonacci retracements (38.2%, 50%, and 61.8%) should be taken into account while determining the possible target areas.
Another thing is checking the declining support lines and seeing if any of them cross the Fibonacci retracement levels. The important addition to this lesson is that the very initial breakdown (below the thin, dashed line) that’s not particularly big can be ignored. We should only pay attention to the crystal-clear breakdowns when estimating the upside target prices.
Finally, it might also be a good idea to remember the closing price before the final (and probably biggest) daily decline as it might serve as resistance later on. The April 12, 2013 closing price of $1,480 was what (approximately) stopped the rally in the following weeks.
The second letter is not about a specific price target. It’s more of a warning against getting scared or overly excited about the profits from one’s short position. The market doesn’t care about an individual investor’s profits or losses. It cares about strong support levels and is likely to decline to them regardless of how ridiculously big (and perhaps unrealistic at first sight) profits this is going to involve. In other words, one should remember that just because the price moved significantly doesn’t mean that the decline is over. Even if the move is huge, it could still get bigger and the difference could be really meaningful.
The fourth letter is about the possible shape of the corrective upswing or pause. It could involve a fake short-term breakout, but unless this move is confirmed by multiple other bullish signs, one should not automatically act on it. In particular, it seems that one should put more trust in the Fibonacci retracements than in the declining resistance lines and breakouts above them. Unless we have a confirmed breakout above the 61.8% Fibonacci retracement, the rally should not be trusted. Naturally, the exception is for the situation in which gold moves very close to its final downside target ($890).
The fifth and final letter deals with the final part of the decline. The final part of the entire decline could be quite quick. In 2013 it took just about a week after the breakdown below the previous major bottom for the decline to be over. It will be difficult to take action at that time as likely a lot of people will be giving up on the precious metals market and you will read in the mass media that gold lost its gleam, that it was one of the worst-performing assets and so on. Some people will be projecting gold at $600, $500, or perhaps even at $300. Our job as investors is to take advantage of this emotionality, not to be hurt by it. It will be precisely then, between hate and fear, that the greatest buying opportunity will present itself. And it will definitely not look like an opportunity at all. It will look like there’s no end to gold’s declines, that silver is worthless and that mining stocks will all go out of business. Again, that will be a buying opportunity. That’s how it’s supposed to look – invisible for those who are not prepared and scary for almost everyone. But not for you – you know what it will really be and we’ll be taking advantage of these extremely promotional buying prices together.
It seems that so far gold is still too early in its medium-term decline to utilize insights from all the above letters, but the lesson from the second letter is already up-to-date.
Namely, gold, silver and mining stocks declined substantially and only silver reached some kind of important support (it’s not very strong, though). Consequently, the decline is likely to continue. Once the first major bottom is in, thanks to the above letters, we’ll be able to say more about the possible upside for the short-term correction. It’s too early to do so now, but thanks to letting you know about the game plan before the biggest volatility, it should be easier for you to do the difficult trading decisions quickly, when the time comes, as our analyses will be less surprising.
Short-term Update
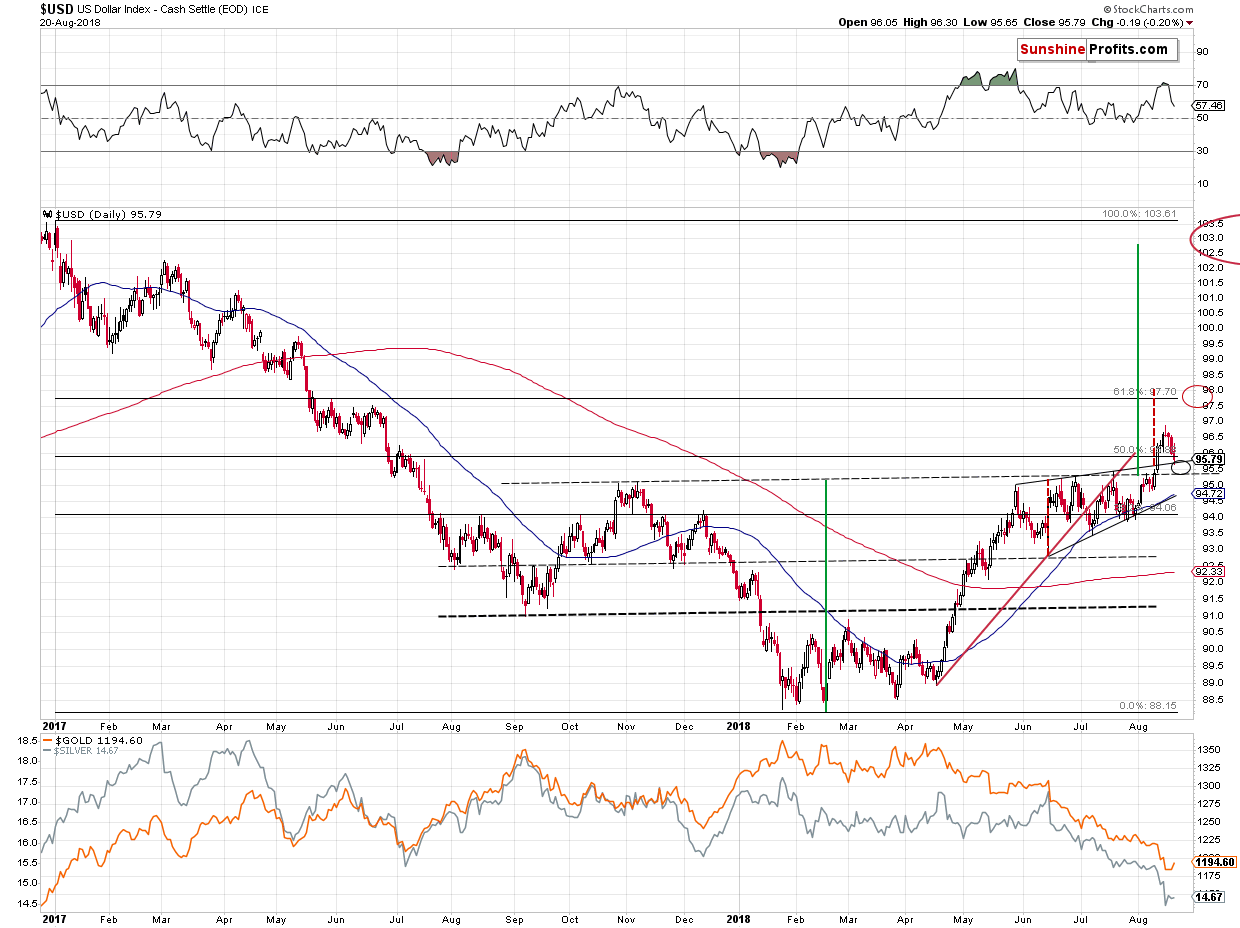
As far as this week’s price performance is concerned, we don’t have much to add to what we wrote yesterday. The key thing that we saw is the USDX’s move to its target area and yet another day during which mining stocks underperformed. Let’s take a look at the former.
In yesterday’s analysis, we wrote the following:
We may have indeed seen an important bearish indication based on the weekly price changes in the USD Index, but it has absolutely no implications for our trading positions in the precious metals sector. In fact, it barely changes the outlook for the USDX. The very short-term implications are bearish. But the above just isn’t the full truth. The full truth is that while we may see a move lower, it’s likely to be very small. Moreover, it’s something quite natural at this time.
The USD Index has recently broken above the rising wedge pattern and above the neck level of the reverse head-and-shoulders pattern. This means that one can expect the USDX to decline back to the previously broken levels and to verify them as support. And there will be nothing bearish about it.
These two levels create the near-term downside target area and is very close to where the USDX closed on Friday – between 95.4 and 95.7. Since the USDX just closed at about 96, the potential size of the downswing is between 0.3 and 0.6. In other words, the USDX is likely to at most repeat its Friday’s decline and perhaps it’s going to decline by only about half of its Friday’s decline.
Is this a substantial decline? No. Consequently, is it likely to trigger a substantial (!) rally in the precious metals or mining stocks? No.
To be clear, metals and miners are very oversold on a very short-term basis and are after a very volatile decline, so they could correct in a volatile manner as well, but even if this is the case, such a move would likely be very temporary and it might not be possible to trade this kind of a price swing, unless one is engaging in day-trading. The risk to reward ratio seems to favor sticking to the current short position even though we might have a temporary (probably 1-3 days at most) correction in profits.
What can we expect shortly if the USDX declines? Most likely the same thing we can expect for the U.S. currency. Something between a repeat of what we saw on Friday and half of that. Before assuming that in this case it’s a good idea to close the position and re-open it after seeing half of Friday’s move, please note that the possible (not imminent) move in the USDX could happen very quickly as both price targets are relatively close. It could just be a matter of hours or it could happen overnight. You could go to sleep with the USDX at 96 and you could wake up with it at 97 (and gold below $1,150) and already after an overnight drop to 95.5 or so. Is a chance of saving $5 - $10 on a trade in gold worth risking missing profits from a $60 - $135 decline? No, that’s not a good idea in our view. Consequently, we are not adjusting our positions in light of all the above. And in light of all that we wrote previously and what we’re about to write next today.
If you have just joined our service, be sure to read last Monday’s analysis with a list of long-term factors impacting the current move, and the analysis in which we discuss the short- and medium-term downside targets as well as the analysis in which we discuss the long-term upside potential of gold.
The USD Index indeed moved lower yesterday, closing the day at 95.79 and in today’s pre-market trading it temporarily moved to 95.44. That’s in perfect tune with what we wrote above and it likely means that the USDX’s small decline is already over or about to be over.
Did it trigger a substantially rally in the precious metals sector? No. Most importantly, it didn’t trigger any significant strength in mining stocks.
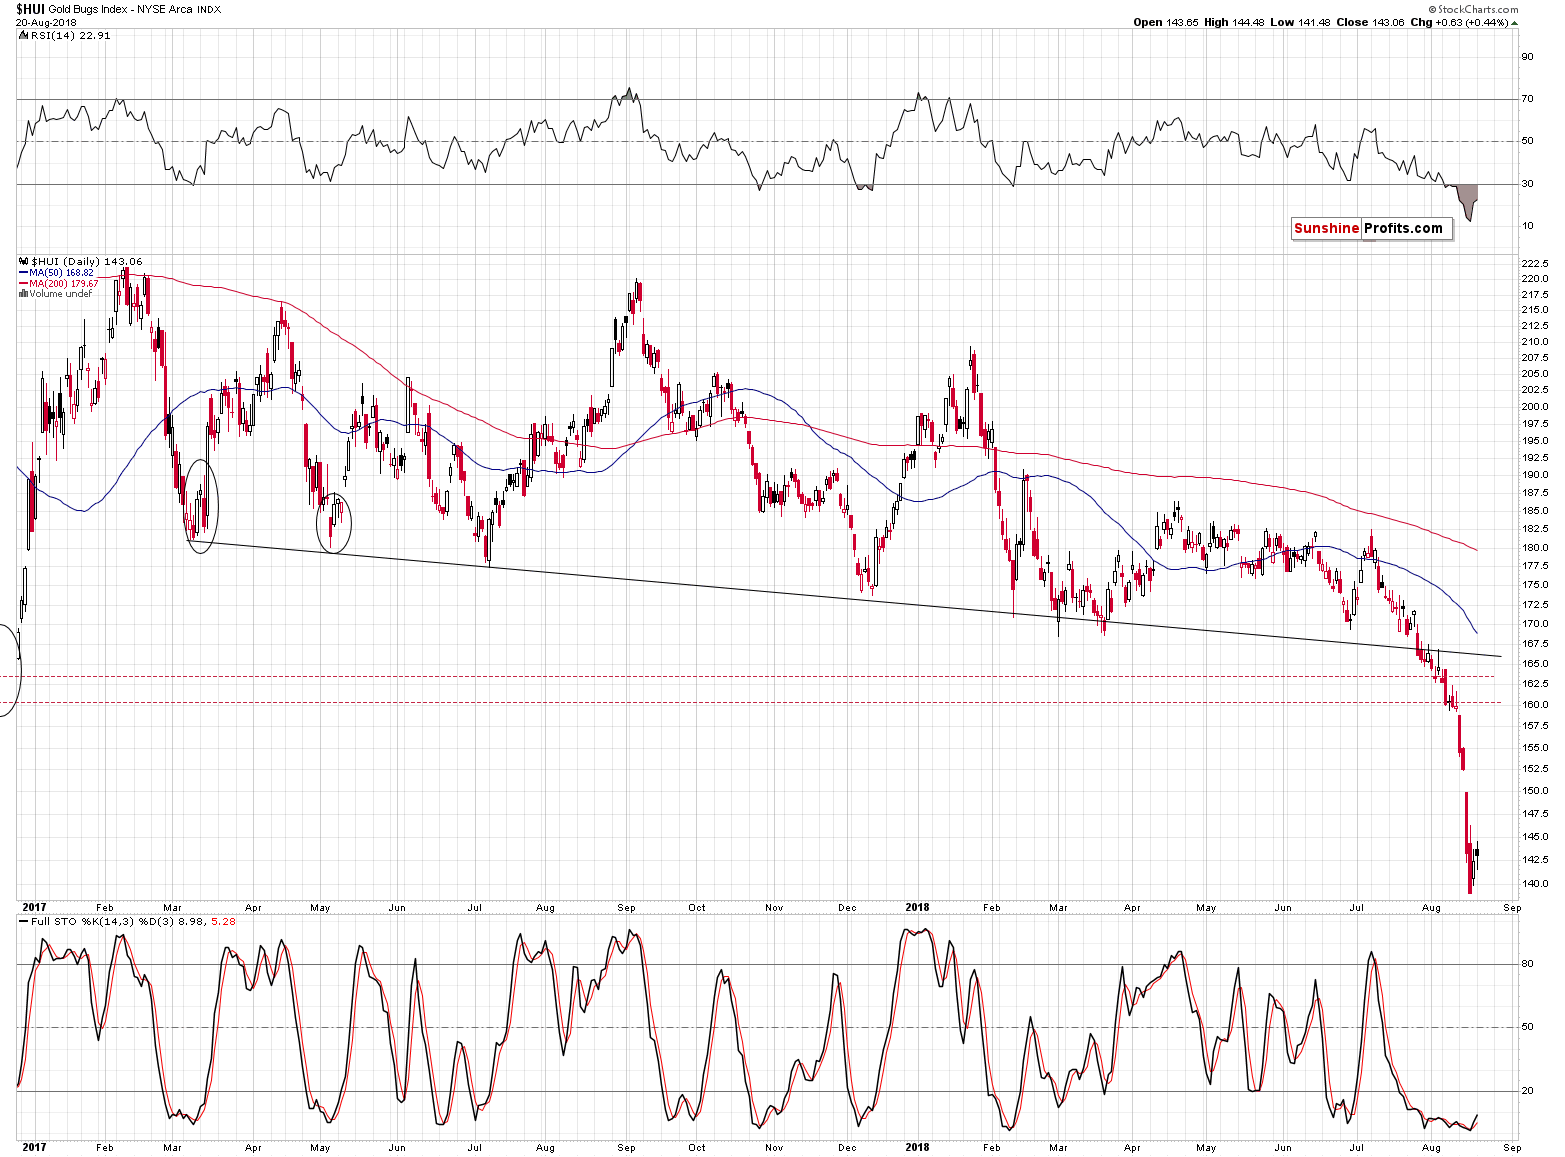
The entire short-term decline in the USD Index was able to generate a rally that only erased Thursday’s decline. That’s almost nothing compared to the size of this month’s decline so far. The mining stocks’ performance continues to be weak, which continues to support lower PM prices. The early parts of big upswings are usually characterized by strong performance of gold stocks – and we’re seeing the exact opposite.
Summing up, the USD Index seems to have verified its breakouts and can now rally much higher. This means that the pause in the precious metals and mining stocks is over or very close to being over and that another big slide is likely just ahead. Based on what we can infer from the 2013 decline, it is the time that we should pay extra attention to the PMs as their decline is likely not close to being over since no meaningful support was reached in the case of gold and mining stocks.
As always, we’ll keep you – our subscribers – informed.
To summarize:
Trading capital (supplementary part of the portfolio; our opinion): Full short positions (250% of the full position) in gold, silver and mining stocks are justified from the risk/reward perspective with the following stop-loss orders and exit profit-take price levels:
- Gold: profit-take exit price: $1,062; stop-loss: $1,221; initial target price for the DGLD ETN: $82.96; stop-loss for the DGLD ETN $54.27
- Silver: profit-take exit price: $12.72; stop-loss: $15.56; initial target price for the DSLV ETN: $46.97; stop-loss for the DSLV ETN $28.87
- Mining stocks (price levels for the GDX ETF): profit-take exit price: $13.12; stop-loss: $20.81; initial target price for the DUST ETF: $80.97; stop-loss for the DUST ETF $30.87
Note: the above is a specific preparation for a possible sudden price drop, it does not reflect the most likely outcome. You will find more detailed explanation in our August 1 Alert. In case one wants to bet on junior mining stocks’ prices (we do not suggest doing so – we think senior mining stocks are more predictable in the case of short-term trades – if one wants to do it anyway, we provide the details), here are the stop-loss details and target prices:
- GDXJ ETF: profit-take exit price: $17.52; stop-loss: $30.72
- JDST ETF: initial target price: $154.97 stop-loss: $62.78
Long-term capital (core part of the portfolio; our opinion): No positions (in other words: cash)
Insurance capital (core part of the portfolio; our opinion): Full position
Important Details for New Subscribers
Whether you already subscribed or not, we encourage you to find out how to make the most of our alerts and read our replies to the most common alert-and-gold-trading-related-questions.
Please note that the in the trading section we describe the situation for the day that the alert is posted. In other words, it we are writing about a speculative position, it means that it is up-to-date on the day it was posted. We are also featuring the initial target prices, so that you can decide whether keeping a position on a given day is something that is in tune with your approach (some moves are too small for medium-term traders and some might appear too big for day-traders).
Plus, you might want to read why our stop-loss orders are usually relatively far from the current price.
Please note that a full position doesn’t mean using all of the capital for a given trade. You will find details on our thoughts on gold portfolio structuring in the Key Insights section on our website.
As a reminder – “initial target price” means exactly that – an “initial” one, it’s not a price level at which we suggest closing positions. If this becomes the case (like it did in the previous trade) we will refer to these levels as levels of exit orders (exactly as we’ve done previously). Stop-loss levels, however, are naturally not “initial”, but something that, in our opinion, might be entered as an order.
Since it is impossible to synchronize target prices and stop-loss levels for all the ETFs and ETNs with the main markets that we provide these levels for (gold, silver and mining stocks – the GDX ETF), the stop-loss levels and target prices for other ETNs and ETF (among other: UGLD, DGLD, USLV, DSLV, NUGT, DUST, JNUG, JDST) are provided as supplementary, and not as “final”. This means that if a stop-loss or a target level is reached for any of the “additional instruments” (DGLD for instance), but not for the “main instrument” (gold in this case), we will view positions in both gold and DGLD as still open and the stop-loss for DGLD would have to be moved lower. On the other hand, if gold moves to a stop-loss level but DGLD doesn’t, then we will view both positions (in gold and DGLD) as closed. In other words, since it’s not possible to be 100% certain that each related instrument moves to a given level when the underlying instrument does, we can’t provide levels that would be binding. The levels that we do provide are our best estimate of the levels that will correspond to the levels in the underlying assets, but it will be the underlying assets that one will need to focus on regarding the signs pointing to closing a given position or keeping it open. We might adjust the levels in the “additional instruments” without adjusting the levels in the “main instruments”, which will simply mean that we have improved our estimation of these levels, not that we changed our outlook on the markets. We are already working on a tool that would update these levels on a daily basis for the most popular ETFs, ETNs and individual mining stocks.
Our preferred ways to invest in and to trade gold along with the reasoning can be found in the how to buy gold section. Additionally, our preferred ETFs and ETNs can be found in our Gold & Silver ETF Ranking.
As a reminder, Gold & Silver Trading Alerts are posted before or on each trading day (we usually post them before the opening bell, but we don't promise doing that each day). If there's anything urgent, we will send you an additional small alert before posting the main one.
=====
Latest Free Trading Alerts:
Some time ago, the newest edition of famous In Gold We Trust report was released. So, why should we trust in gold in 2018?
Gold and the Turning of Monetary Tides
=====
Hand-picked precious-metals-related links:
REFILE-PRECIOUS-Gold at 1-week high as Trump's Fed criticism weighs on dollar
Gold investors ‘give up hope’ as biggest short in history builds
Not feasible: Finance Ministry cold to slashing import duty, GST on gold
=====
In other news:
Exclusive: Trump demands Fed help on economy, complains about interest rate rises
Dollar Weakens on Trump Remarks; U.S. Futures Rise: Markets Wrap
It’s Too Early to Call an End to the Dollar Rally, JPMorgan Says
This is how China controls its currency
JPMorgan dramatically slashes Tesla's stock price forecast
14m bolivars for a chicken: Venezuela hyperinflation explained
=====
Thank you.
Sincerely,
Przemyslaw Radomski, CFA
Founder, Editor-in-chief, Gold & Silver Fund Manager
Gold & Silver Trading Alerts
Forex Trading Alerts
Oil Investment Updates
Oil Trading Alerts

