

Briefly: in our opinion, full (250% of the regular size of the position) speculative short positions in gold, silver and mining stocks are justified from the risk/reward perspective at the moment of publishing this alert.
Gold, silver, and mining stocks declined profoundly yesterday and in many cases the already-huge profits were likely doubled. After all, we had increased the size of the short position to the levels that we’d never increased it to before, precisely because of the odds of seeing this kind of decline that we have right now. The decline in gold was sizable, but the sizes of declines in silver and mining stocks were enormous. The HUI Index broke right through the 2008 low like a hot knife through butter, but silver stopped at the July 2017 intraday low. Did the latter just indicate a local bottom and a relief rally?
The answer depends on how one defines a local bottom and a relief rally. If a 20-30 cent move or so in silver falls into this definition, then yes, this might be the case. But, from the trading point of view, it doesn’t seem that we saw anything that would justify changing the current short positions.
Surely, the profits are already huge, but just as a loss on a position is not a reason to close it, a big profit isn’t. The market simply doesn’t care about any one individual’s loss or profit and will not use it as a factor in determining the next move. What the market will consider are support, resistance levels, some indicators, relative valuations, ratios, and so on. But not one’s profits or losses.
Before looking at the charts for details, we’d like to stress that the comments that we made on Monday regarding all the long-term factors pointing to lower PM prices remain up-to-date. Yesterday’s decline was not just some news-driven temporary decline that’s likely to be reversed immediately as it didn’t change the overall market trend. Conversely, it was something that happened in tune with the trend and something that is likely not ending very soon.
Let’s take a closer look at the charts for details (charts courtesy of http://stockcharts.com).
First of all, nothing changed in the case of the USD Index’s outlook and it continues to support lower precious metals values.
USDX Breakout
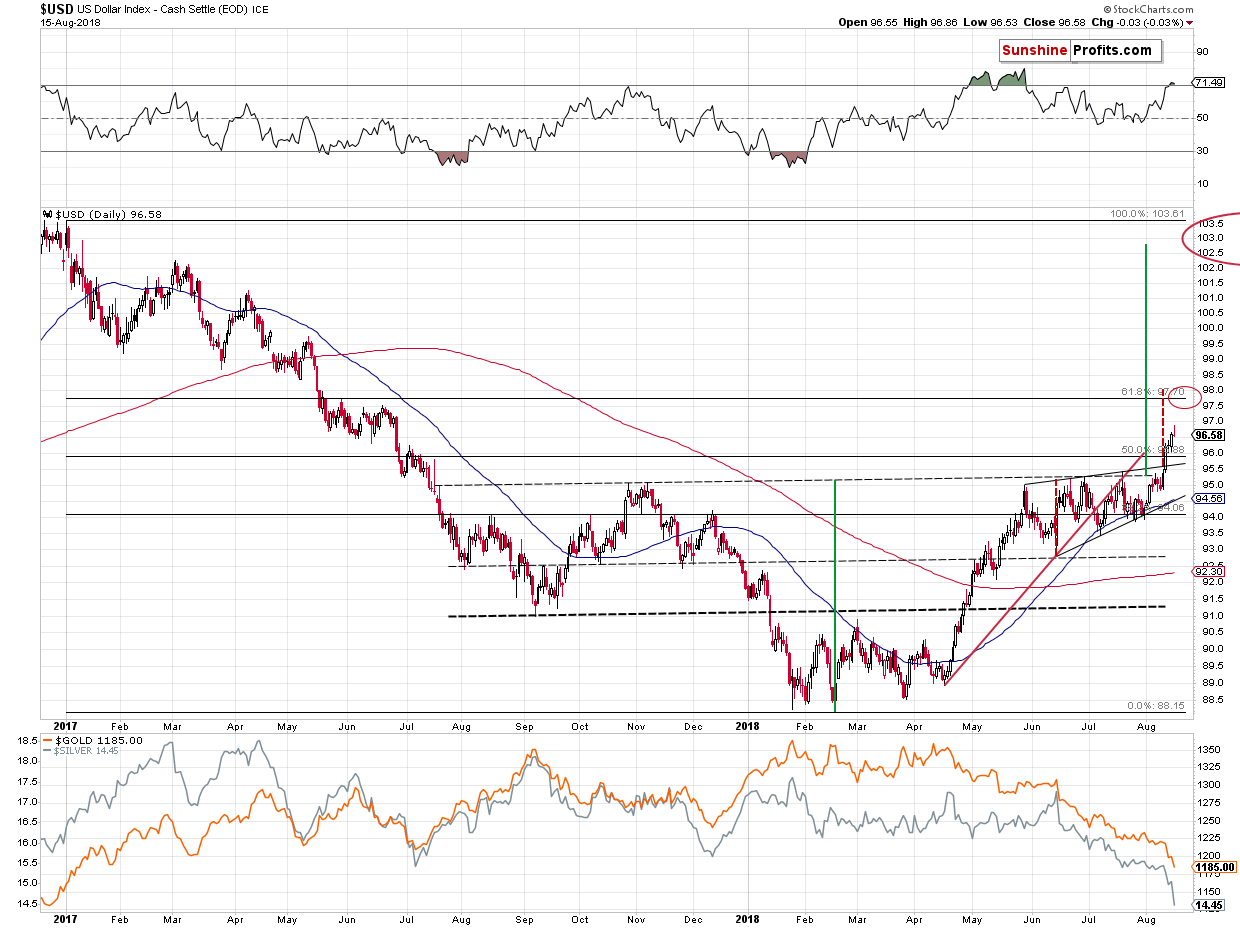
In the previous analyses, we wrote the following about the above USDX chart:
Nothing really happened yesterday and that was a very important nothing. This “nothing” means that there was no invalidation of the previous breakout and it’s becoming very likely that the breakout will be confirmed by yet another close today. This will confirm a breakout above both the rising wedge pattern and the big, medium-term, reverse head-and-shoulders pattern. The former suggests a move to about 98, and the latter suggest a move to about 103.
Both are very bullish for the USDX and bearish for the precious metals market. We might have a situation in which the USDX rallies to 98 first, then corrects and then moves up higher – to 103 or so. This could result in mirror moves in the precious metals market.
The breakouts were indeed confirmed. The implications are very bullish for the following weeks and months.
The rally may appear already too big from the short-term point of view, but it is not the short term that is most important. It is the long-term perspective that matters the most as it is a big medium-term rally that we are discussing here.
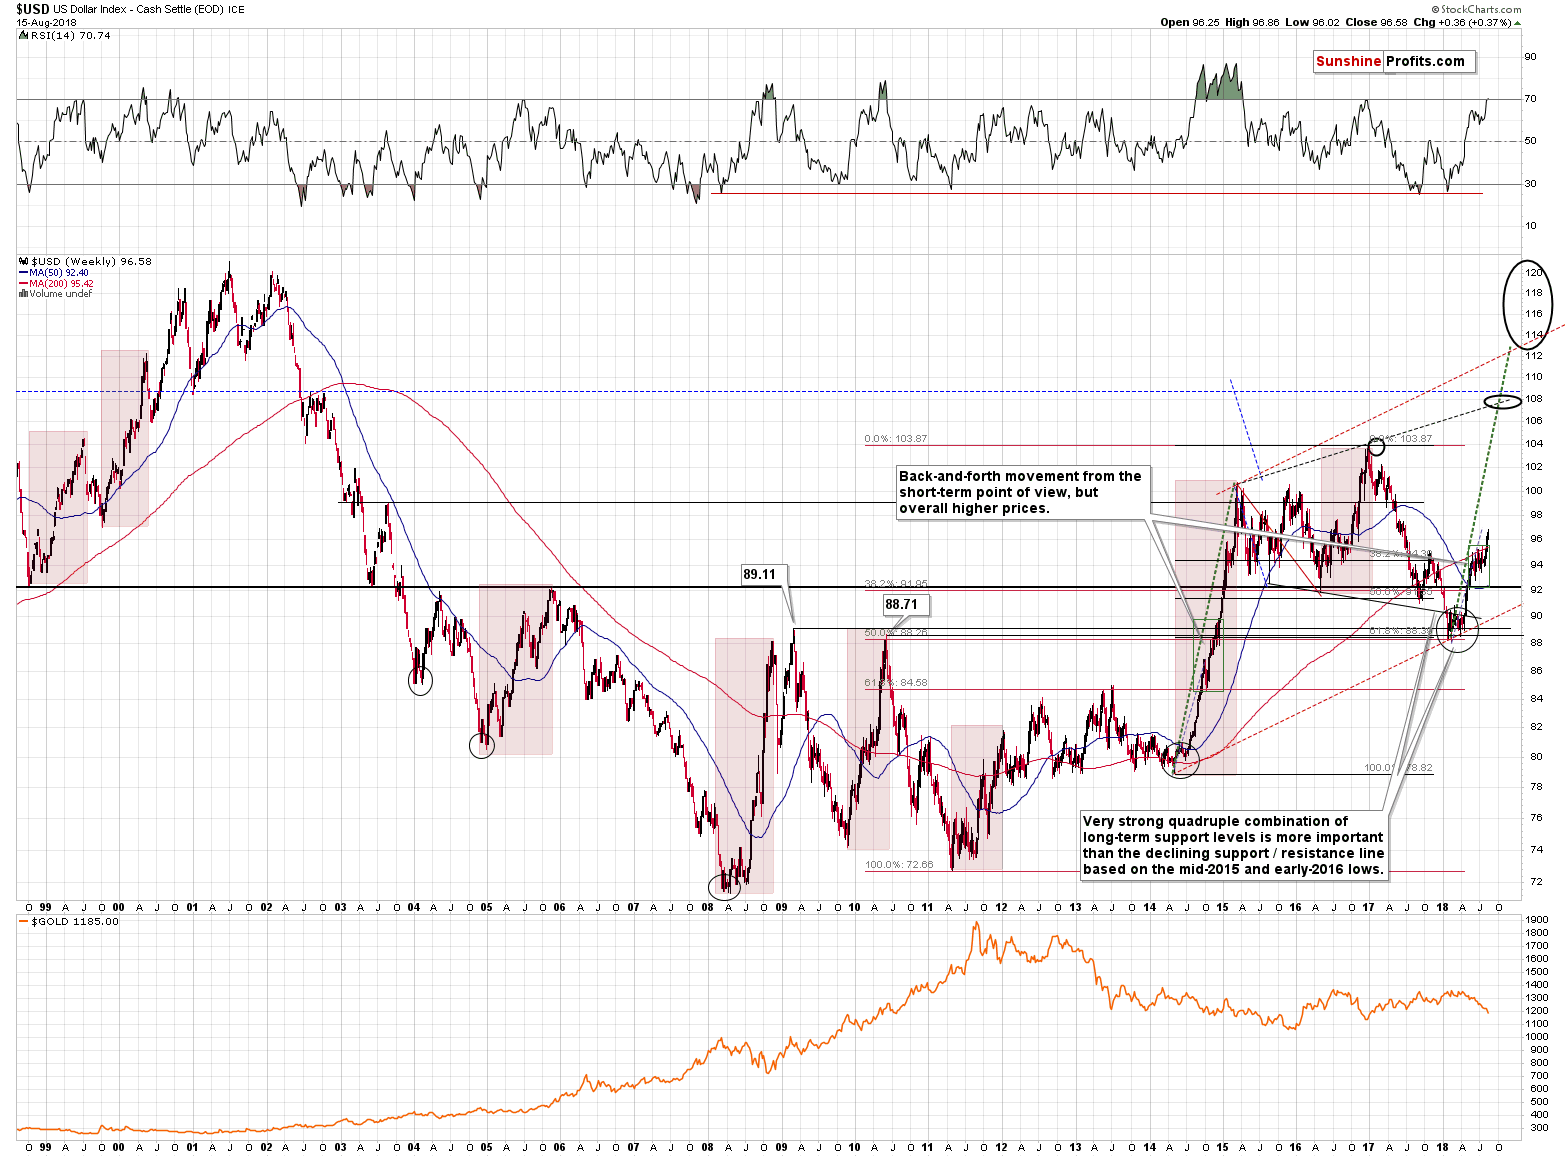
Based on the initial shape of the move, on the shape of the recent consolidation (higher lows) and on the size of the rally until the first pause took place, we can say that this is a big rally. Even if we take the entire 2018 rally into account, then the move is still only about halfway done if we compare it to the previous 3 big rallies: the 2008, 2010, and 2014-2015 ones. History tends to repeat itself, so we should be prepared for another big wave higher in the USDX.
We have intermediate resistance at about 98 (visible on the short-term chart), then at about 103 (the 2017 high) and then at about 108, and then finally at about 113.
Interestingly, if the USD Index is going to rally just like it did in 2014 and 2015, then we might see it at 108 in October. It seems unthinkable, we know, but that’s exactly how sharp the rally was just a few years ago and history does indeed like to repeat itself. And it’s been repeating itself so far.
The implications are extremely bearish for the precious metals market for the next several weeks – months.
Having said that, let’s take a look at what happened in gold, silver, and mining stocks.
Gold’s Near-Term Outlook
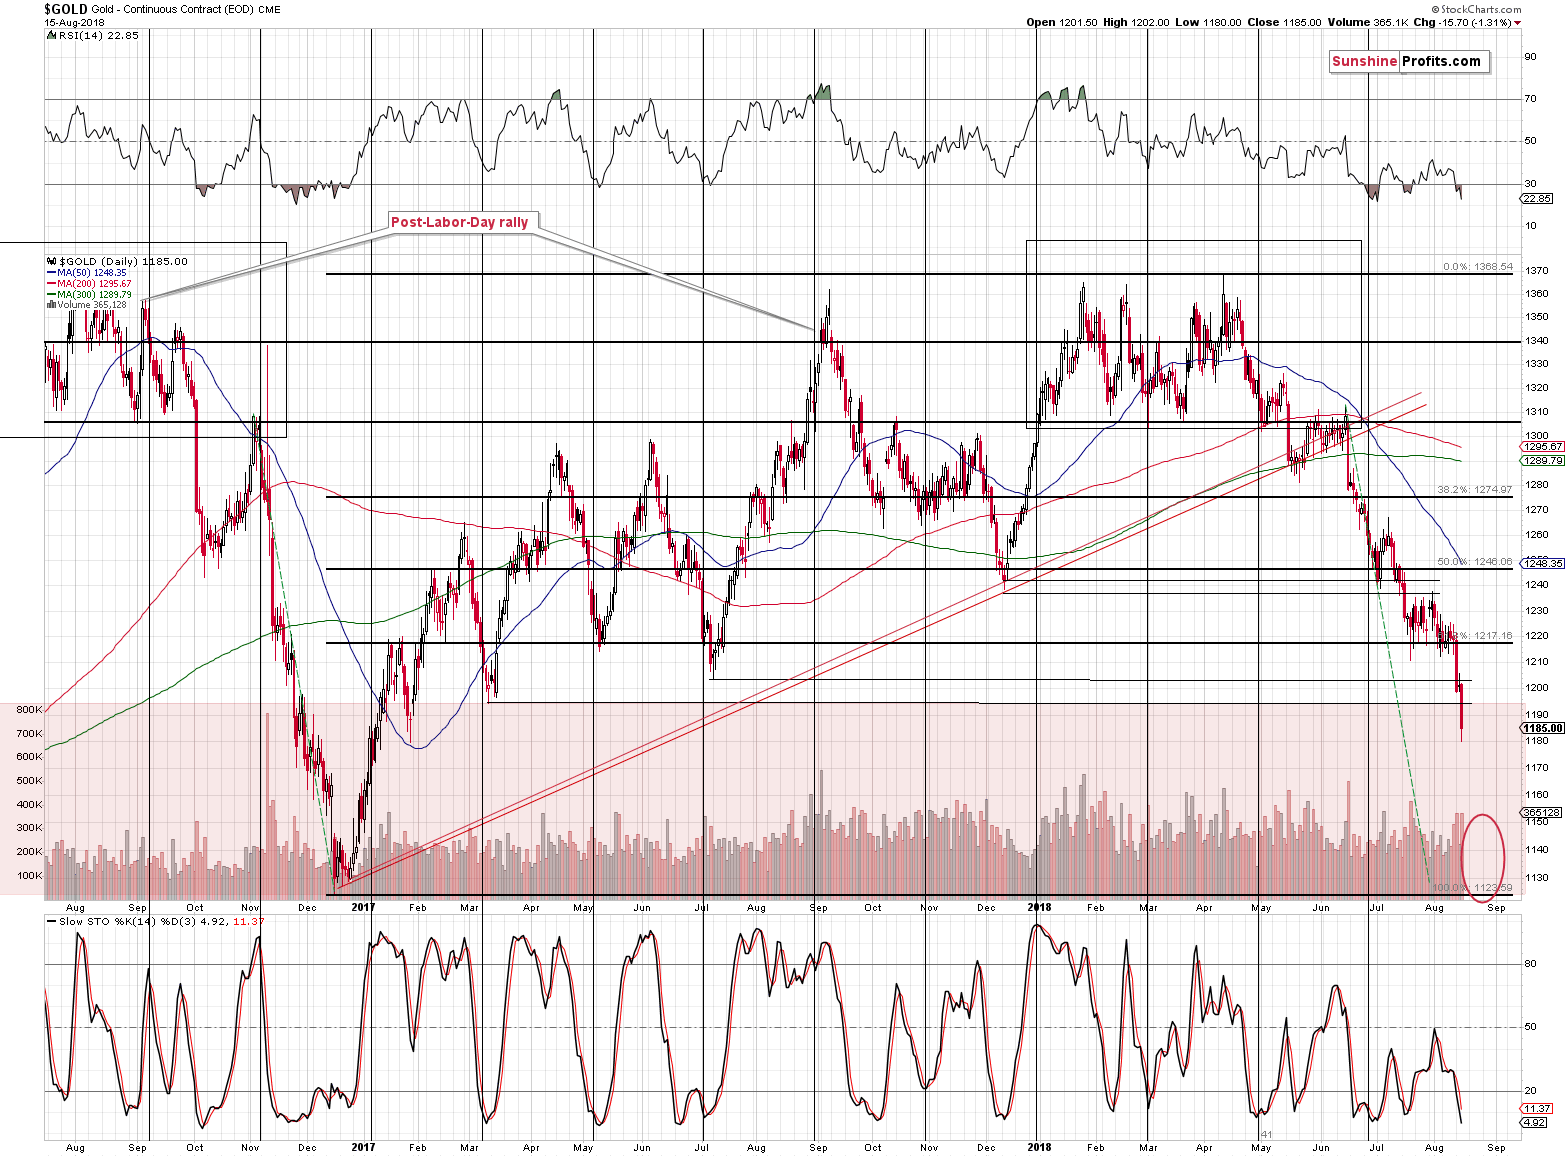
Gold broke below the March 2017 bottom and entered the red area. It’s not red because it’s critical or strong. It’s red, because the implications of gold going into it are bearish. There is not significant support all the way down to the December 2016 bottom and that’s what the red area represents.
To be clear, we do have the late January 2017 bottom and it even seems to have worked as support yesterday (taking intraday prices into account), but gold closed below that low in terms of the daily closing prices (yesterday’s close was visibly below the lowest close that we had seen in late January 2017), so we also saw a breakdown. The late-January bottom is not significant, so we don’t expect it to generate any sizable rally. Instead, we think that gold will decline to the December 2016 bottom (more likely), or (less likely but still possible) even lower – to the December 2015 bottom.
In other words, our yesterday’s comments on gold’s long-term chart remain up-to-date:
From the long-term point of view, it’s even clearer that the only nearby support level is provided by the December 2016 low. The higher local bottoms are not even visible from this perspective. The next key support is at the December 2015 low, but gold will need to get below the former support first. Naturally, it is possible for gold to slide through it without looking back and we are prepared for this scenario by having exit price orders below the December 2016 lows (closer to the December 2015 low in gold), but it’s more likely that we’ll see some kind of local bottom with gold at $1,120 - $1,130 or so.
On a side note, did you notice how gold declined overnight?
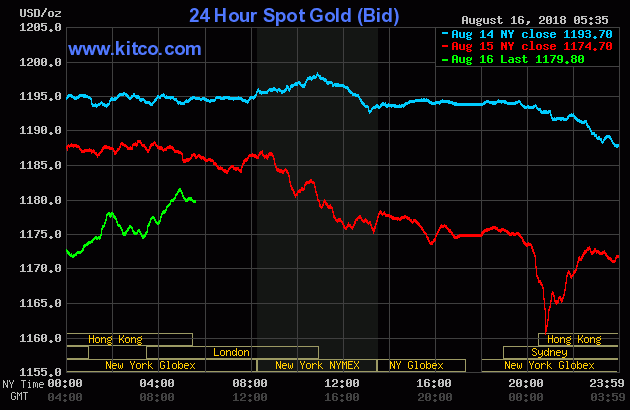
One might have not even noticed the move to about $1,160. It’s not a big deal, the move higher that we’re seeing is probably just a very brief correction, but the point is that this is exactly what could happen with gold and its December 2015 bottom. The final price drop might take place almost unnoticed from the U.S. perspective.
We have the profit-take exit orders in place in order to catch this kind of move if it happens while were not able to react. The size of the current overnight move was about $15 (approximately doubling the daily decline), but if gold declines to $1,120 shortly on significant volatility, then an additional overnight “drop” of $70 (which would be less than double the daily decline) is not unrealistic.
Silver’s Near-term Outlook
As far as silver is concerned, let’s start today’s discussion with saying that nothing changed from the long-term point of view and our previous comments remain up-to-date:
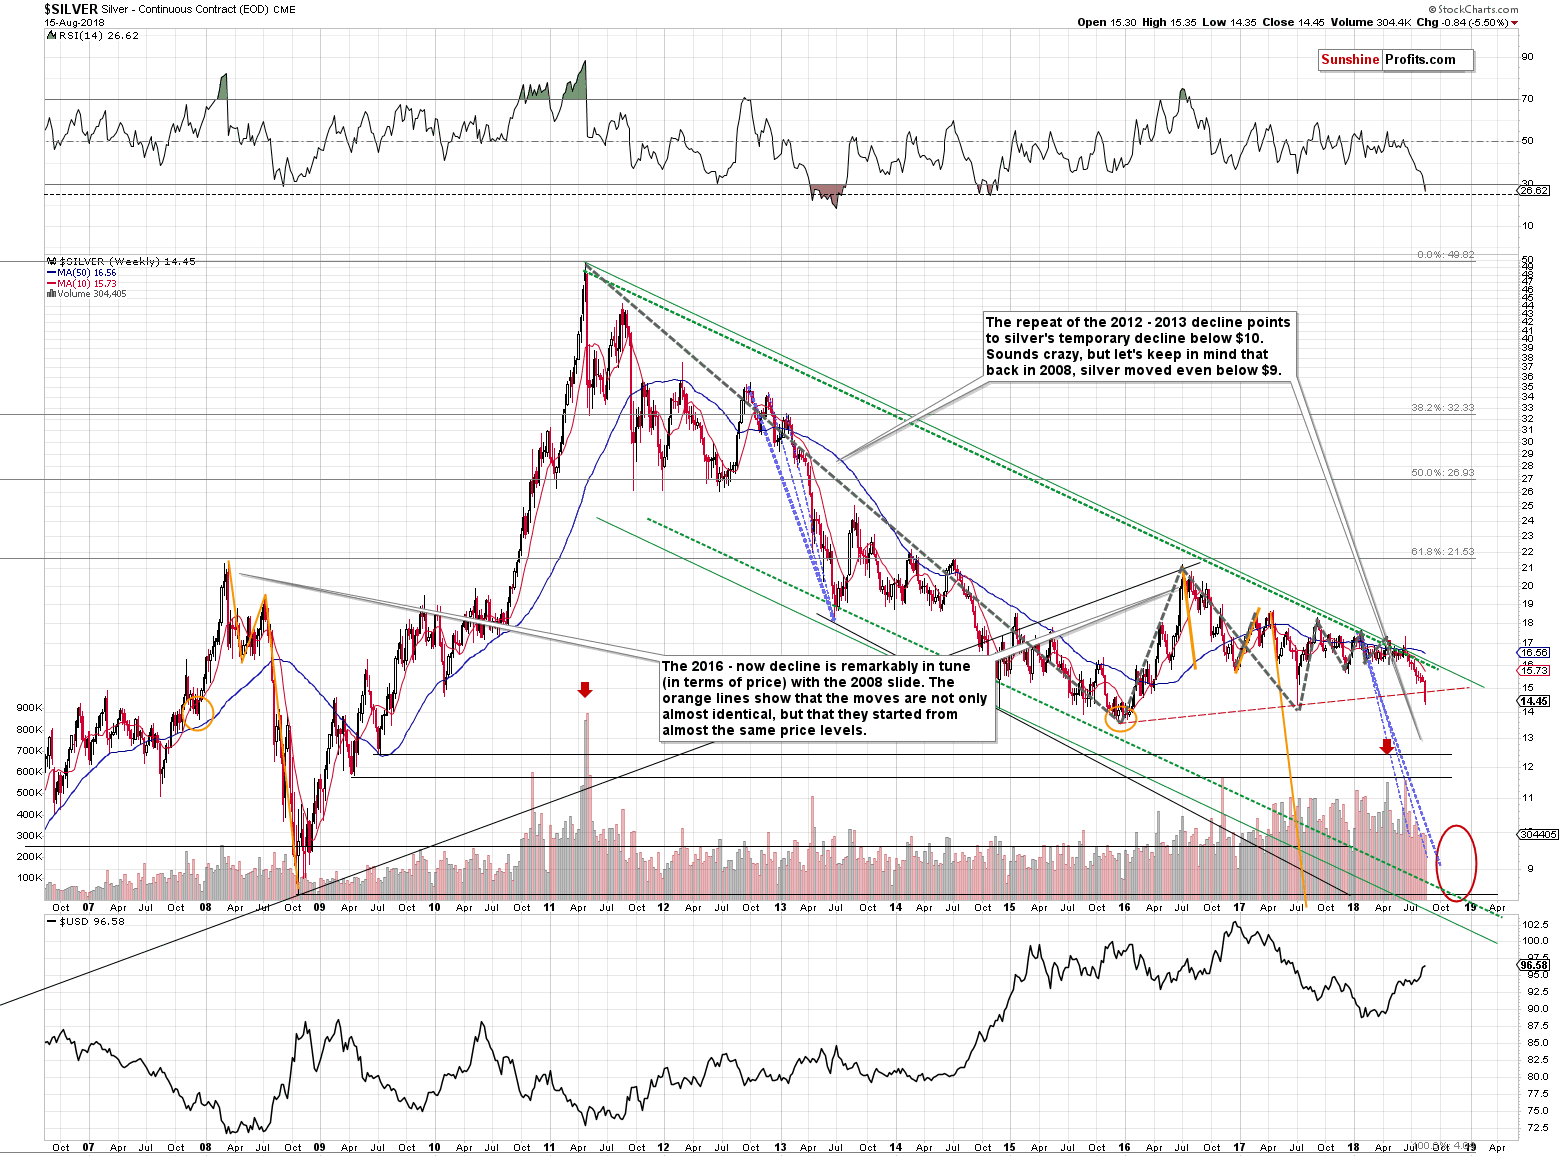
The rising, dashed, red line is too close to provide any reasonable support (assuming gold is going to move to $1,130 or so).
As we know today – it didn’t provide any support whatsoever.
The intraday 2017 bottom seems important, but the intraday / overnight extremes are often not as important as the daily closes.
That’s why we might see some corrective upswing from these levels, but with the USD and gold far from their targets, we don’t expect anything major. Perhaps the overnight move to $14.61 was all that this support level was able to generate.
The next support is provided by the December 2015 lows.
But, can silver really move that low shortly?
One of the ways to determine a near-term target in a market that’s connected to a market for which we already have a target, is to check the relative dynamics. That’s a fancy name for checking how a given market multiplied the other market’s moves during the most recent price swing. It’s important to use the “most recent” move because the dynamics change over time.
We’ll use the downswing that started in July and ended yesterday. We’ll use this particular move because that’s the most short-term move that seems similar in terms of strength of reaction in gold, silver and gold stocks (we’ll use the same technique to the latter in the next section).
Gold’s highest closing price of July was $1,259.60 and it closed at $1,198.90 yesterday.
Silver’s highest closing price of July was $16.14 and it closed at $14.98 yesterday.
Gold declined by 4.82%, while silver declined by 7.19%. This means that silver magnified gold’s decline by 1.49. In other words, silver declined approximately 50% more than gold.
If this remains in place and we expect gold to decline from $1,198.90 to $1,125 (by 6.16%), we can expect silver to decline by 50% more. This means a decline of 1.49 * 6.16% = 9.18%. Since silver closed at $14.98, this means a move to $13.60.
Silver’s 2015 low was $13.62, so the above is a clear indication that silver will indeed be likely to decline to its 2015 lows if gold moves to its late 2016 lows.
Naturally, silver may form a temporary bottom higher – perhaps at $13.85 or so, but it does look like we’re about to see another $1+ slide in the price of the white metal.
Silver is already much lower than it was when we wrote the above, so at this time we may simply see a $0.70 - $1 decline shortly. The corrective upswing would then start. Of course, unless we have a powerful slide even lower and a move to $1,050 or so in gold. If that happened, silver would likely move well below its 2015 bottom (which is why our binding profit take exit level is below $13).
From the short-term point of view, we see that the white metal has indeed moved much lower and that it stopped the decline at the July 2017 bottom. It appears very bullish from the short-term point of view, but since it’s a big, medium-term move (as indicated by the multiple factors discussed on Monday), then we shouldn’t put too much weight on the very short-term signals, unless they come in with many bullish confirmations. We don’t have them at this time.
Mining Stocks Near-term Outlook
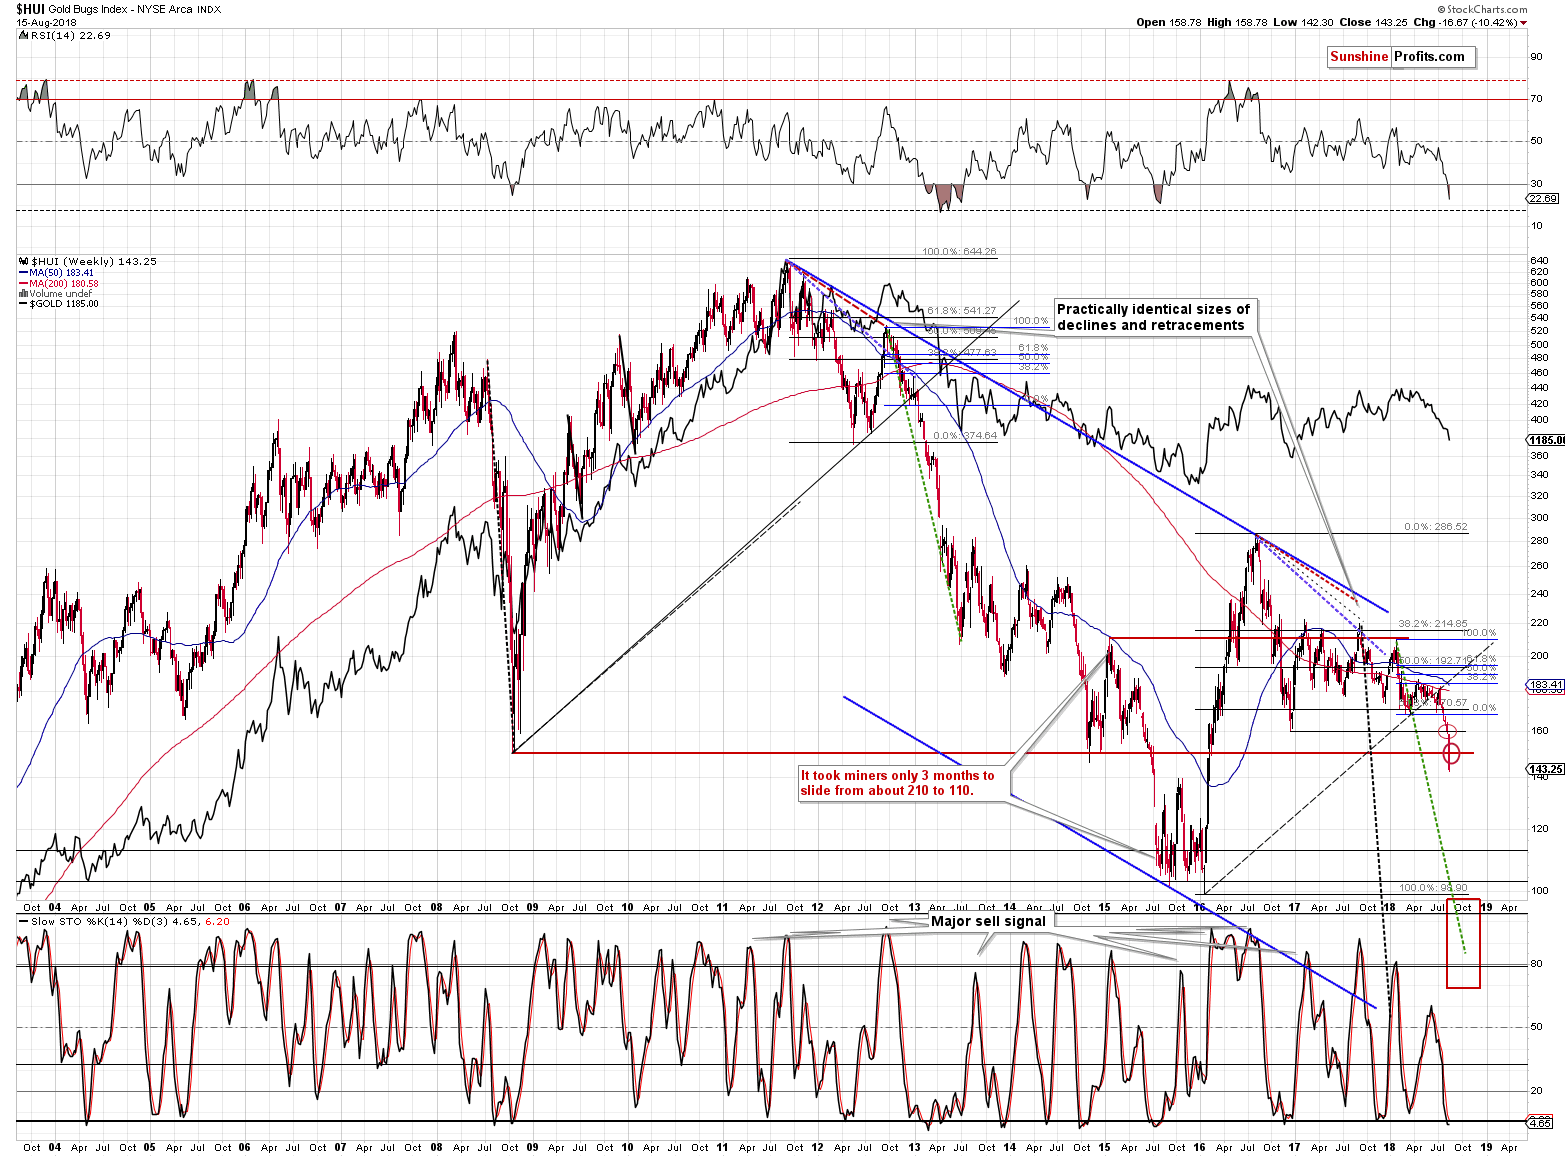
In the previous Alerts, we discussed the nearby targets for the HUI Index in the following way:
From the long-term point of view, we (…) have the 2008 bottom at 150, but it’s too close to be analogous to gold at $1,120 -$1,130 and we have the late 2015 top at about 140. There were also several local tops at about 120.
The HUI Index easily broke below 150, which shows just how weak this market is. The 2008 bottom stopped the decline twice in 2014, but it didn’t manage to do anything this time. Mining stocks are sliding dramatically, just like we described numerous times in the previous months. There is little support between the December 2016 low of 160 and the December 2015 support close to 100.
Let’s see what the relative dynamics tell us.
Gold’s highest closing price of July was $1,259.60, and it closed at $1,198.90 yesterday.
The HUI’s highest closing price of July was $179.70, and it closed at 154.52 yesterday.
Gold declined by 4.82%, while the HUI declined by 14.01%. This means that gold stocks magnified gold’s decline by 2.91. In other words, the HUI Index declined approximately 200% more than gold.
If this remains in place and we expect gold to decline from $1,198.90 to $1,125 (by 6.16%), we can expect HUI to decline by 200% more. This means a decline of 2.91 * 6.16% = 17.93%. Since HUI closed at 154.52, this means a move to 126.81.
This level doesn’t directly correspond to any other significant extreme, but it shows us more or less what to expect.
Based on our research (we will release a big research report on this in the following weeks), mining stocks tend to be the first to move in both directions, up or down, while silver tends to catch up in the final part of the move. This is more visible in the case of rallies, but this might also be useful during the current decline.
This is the early part of the decline, which suggests that mining stocks may get ahead of themselves and perhaps decline more than the relative dynamics suggest. This means that the next target would be between 100 and 120. That’s a rather wide target area but based on the details that we have right now we simply don’t have greater clarity.
As far as the GDX is concerned, this means a target between $13 and $15.
But, the most important signal will come from the gold market. If it moves below $1,150, we’ll check what nearby support levels we have for silver and mining stocks and these will become our target prices.
The above remains up-to-date with a slightly more bearish bias. If we consider only this month, we get the following relative dynamics:
Gold’s July 31st closing price was $1,233.60, and it closed at $1,185 yesterday.
The HUI’s July 31st closing price of July was 166.36, and it closed at 143.25 yesterday.
Gold declined by 3.94%, while the HUI declined by 13.89%. This means that gold stocks magnified gold’s decline by 3.53. In other words, the HUI Index declined approximately 250% more than gold.
If this remains in place and we expect gold to decline from $1,185 to $1,125 (by 5.06%), we can expect the HUI to decline by 250% more. This means a decline of 3.53 * 5.06% = 17.86%. Since the HUI closed at 143.25, this means a move to 117.67.
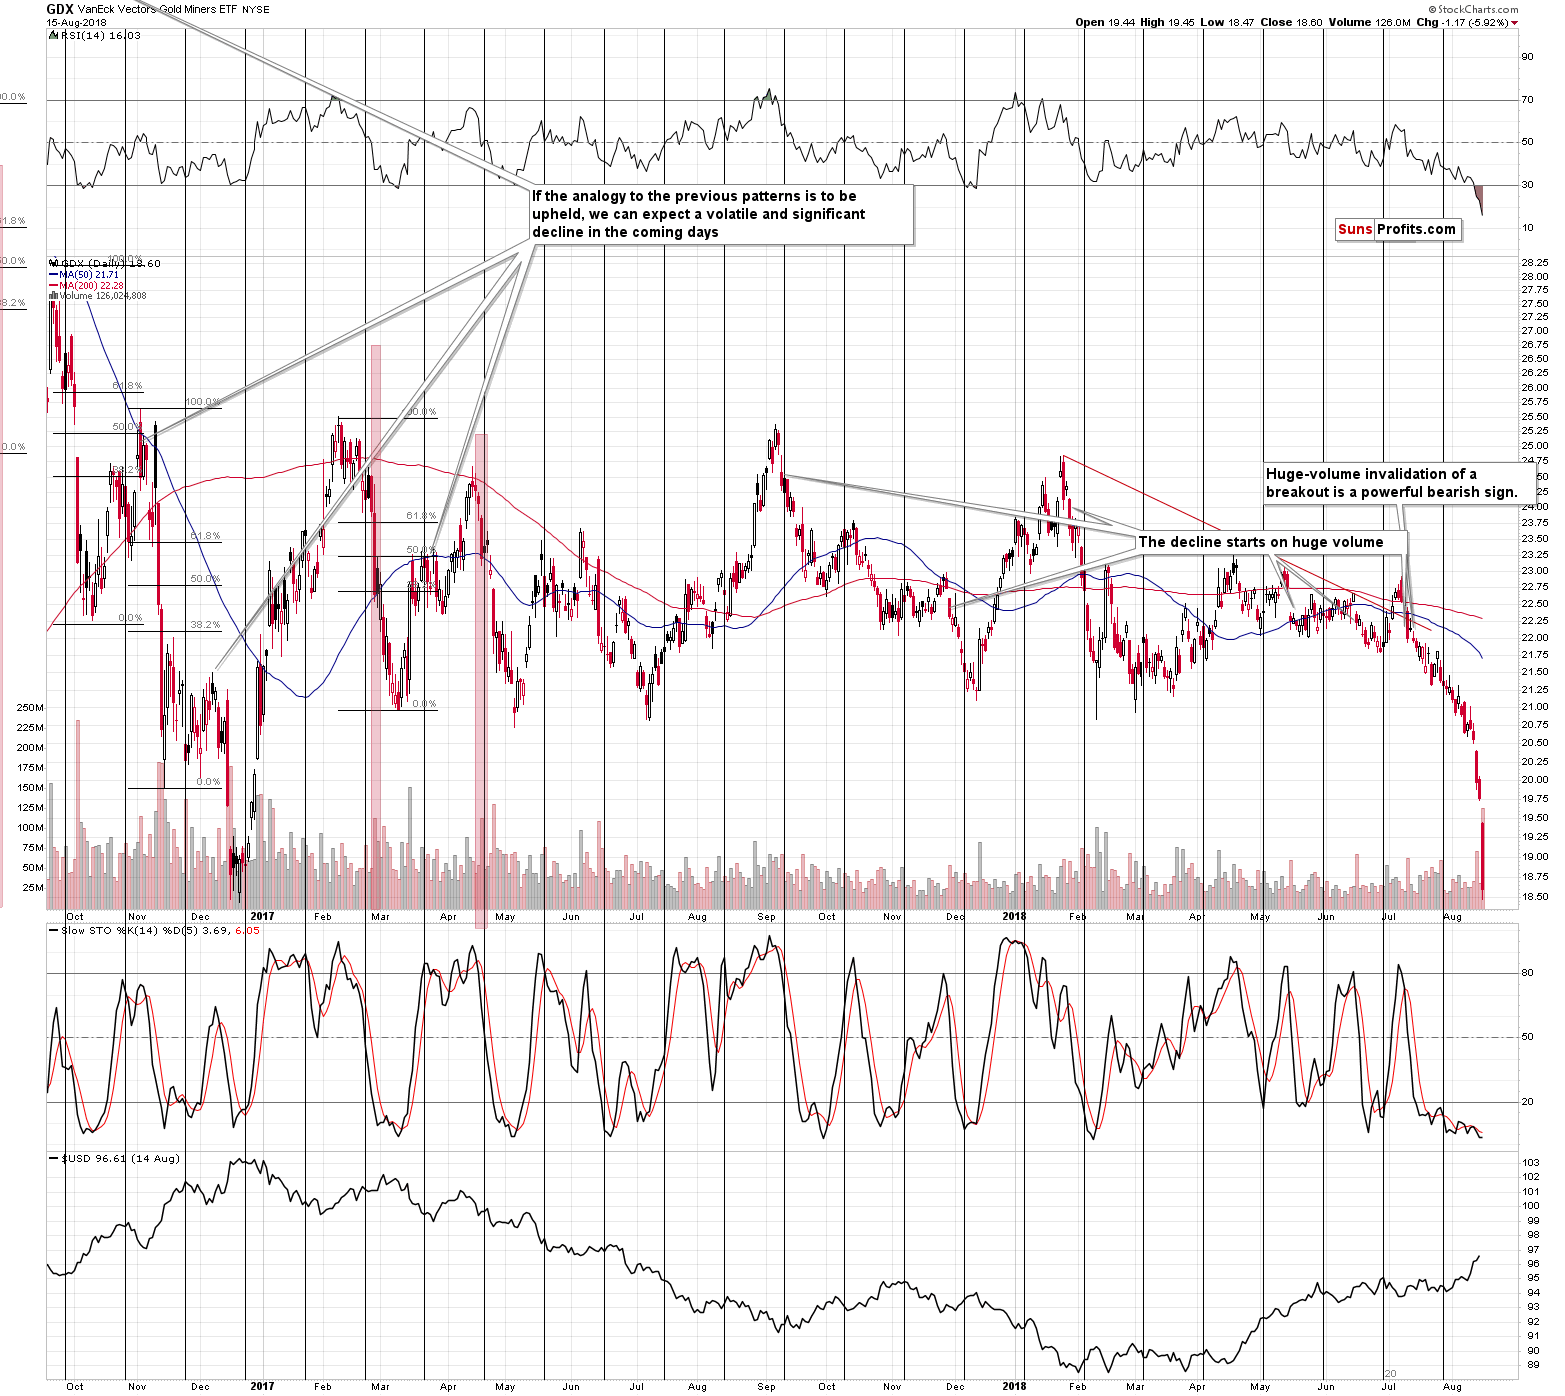
The GDX ETF is also after a breakdown. It just closed below the December 2016 low in terms of the daily closing prices and the breakdown took place on strong volume. The implications are clearly bearish, even though we might see a move back to the December 2016 low before the slide continues.
Final Price Targets
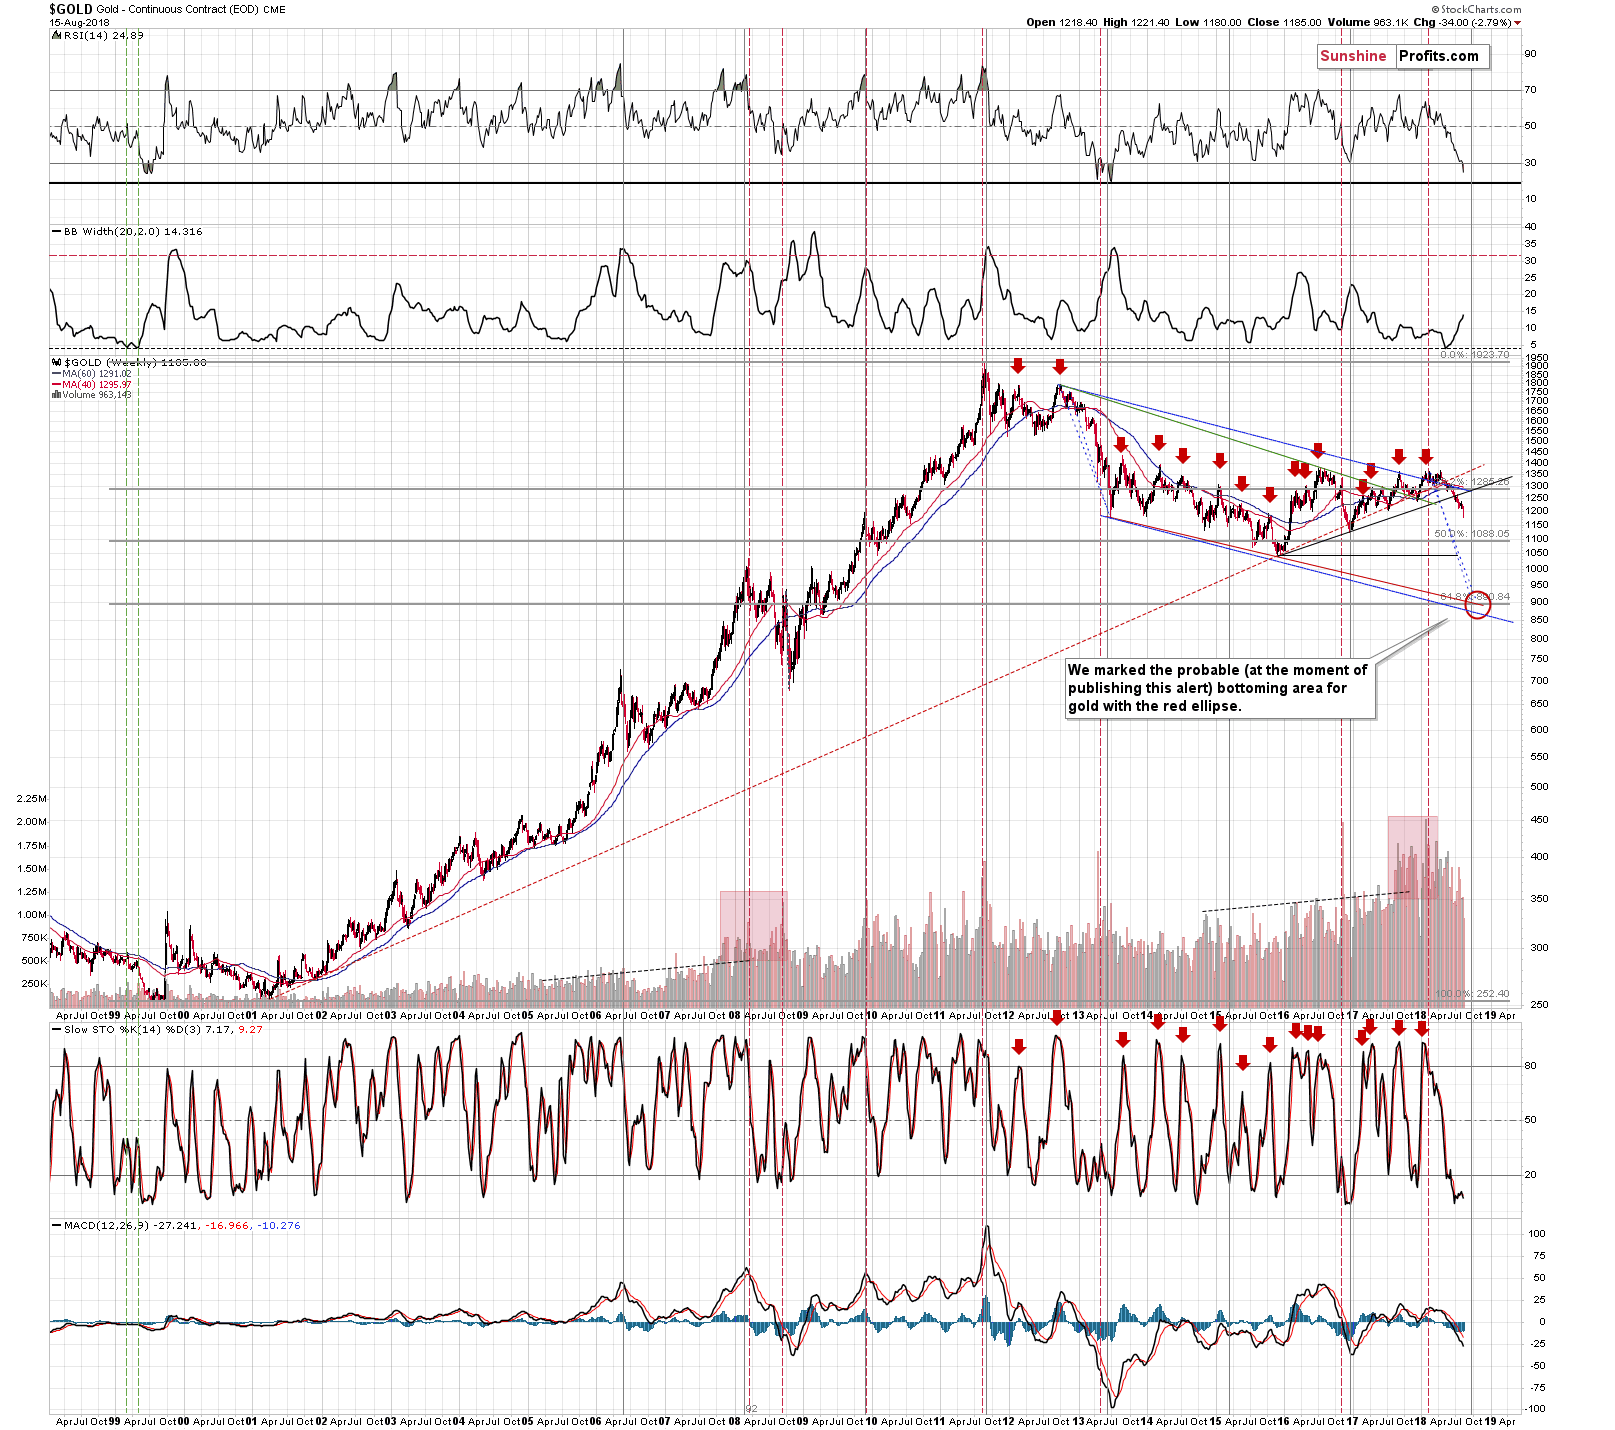
As you may recall, our final target for gold is at about $890 and the price target for silver is below $10, perhaps at $8.90 as that’s what the gold silver ratio at 100 would imply.
We haven’t recently discussed the price targets for the miners and the reason is the lack of clarity concerning them. We expect the miners to move below their 2015 and 2016 lows, but the extent of the breakdown is unclear.
The 80 level in the HUI Index is definitely possible and 60 is extremely oversold, but still possible. This means that GDX could decline to $10 or even $7. GDX has been holding up better than the HUI, so it might be the case that the actual bottom is formed at $10 - $12, instead of $7 - $10. The analogous price range for the GDXJ is $14 - $17.
As far as timing is concerned, the final bottom is likely to take place in late September - early October. Since it’s already mid-August and gold is still close to $1,200, the latter (early October) seems more realistic.
This brings us to the key part of today’s analysis – our reply to the question that we received about the likely shape of the upcoming major bottom and timing regarding mining stocks.
The Shape of the Bottom and the Road to It
Let’s start with quoting the question:
You stated its your belief golds bottom will be in late September/early October at $890 and silver will be below $10. Also, the USD index will possibly reach 103 and its turn around will not be until the final part of 2018.
What you have not mentioned, is what you believe gold and silver will do between the bottom in late September/early October and the USD index turning around in late November/early December? Will the final low be just a spike lower or will the gold/silver prices on a general basis stay low for a month afterwards?
Im a PM investor and Im trying to posture myself for the best time to start buying stocks. Based on your beliefs, I would think the best time to buy PM stocks would be late October/early November. Would you please elaborate further and share what you believe will be the most likely scenario?
Thanks!
Based on the data that we have right now, we think that gold, silver, and mining stocks are in the middle of the first of huge declines. We expect to see the first major bottom in the next 3 – 8 days (with gold either at $1,120 - $1,130 or at about $1,050). Then we expect some kind of a corrective upswing (perhaps made of two smaller upswings, like what we saw in 2013) and another wave down in September (it’s likely to start in the first half of September). Depending on the August bottoming price, the second big decline could be the final one, or it could be the middle of three big declines. If gold goes to $1,050 now, it will be more likely for gold to slide just one more time to its final low at about $890 in late September or (more likely) in early October. If gold doesn’t go to $1,050 now, but bottoms close to $1,125, then we might see an initial slide (in September) to $1,050, then a brief corrective upswing, and then a move to the final low close to $890.
After the final bottom is in, we expect gold to rally back up with a vengeance. It will not be a bottom that is formed out of boredom. Far from it – it will be the bottom that is formed out of fear and hate. It will be emotional. And when investors get emotional, the price gets volatile. This means that timing the final bottom will be something important and something one should prepare for in advance (just like we are currently prepared for an intraday / overnight drop to $1,050 in gold). In other words, the odds are that there will not be a lot of time to take advantage of the promotional gold prices. Once investors realize that “hey, gold’s fundamentals are solid, and we shouldn’t be selling like crazy”, they will move quickly back into the market.
Volatility will likely make buying silver even more difficult, as the white metal tends to catch up with gold close to the end of a given move. So, silver is likely to be particularly volatile close to the end of the decline. Can silver decline $2 in a day? Sure it can – it’s silver, it can do all sorts of crazy things in short periods of time and it has proved this multiple times in the past years.
In the case of mining stocks, we could be lucky and might get more time to react. The reason is that mining stocks tend to be quick to start a given move and then stagnate (relative to gold) before reversing. So, miners could decline sharply sooner and then move sideways for some time (perhaps for a week or so, but that’s very unclear) or decline at a relatively slow pace compared to gold and (in particular) to silver.
The 2015 performance of mining stocks and gold serves as an example – miners declined strongly first, but then held up quite well for many weeks and didn’t decline significantly when gold moved to $1,050. This might be the case, but we can’t promise that it will indeed happen.
The important thing about mining stocks is that it might be better to be a bit too early than a bit too soon, because – as we wrote above – miners tend to be early and this means that they may also rally, while outperforming gold and silver in the initial part of the rebound. We will provide you with a very detailed analysis of this phenomenon in the upcoming weeks.
In our view – and that’s what I will be doing in my private investment fund – it’s best to time the final bottom, but instead of focusing on catching just one single entry moment, spread the purchase around the final bottom and add one’s long-term investments as more bullish confirmations become visible. It might be best to start with the mining stocks and end the purchases with silver, but this could be very difficult to do unless one has a lot of experience in trading.
We wanted you to be prepare in advance, so we already wrote about the way in which to make the purchases at the final bottom… over a year ago (seemed early enough…). If you recall, we had a “Preparing for the Bottom” series of articles and we stopped publishing new issues because gold was not declining in a strong way and very few people were interested in preparing under such conditions. We will provide you with more articles from this series shortly.
All in all, it might be best to plan purchasing precious metals and mining stocks close to the final bottom in late September or (more likely) early October. It doesn’t seem justified to plan on waiting until November or December as at that time both the metals and miners could already be much higher.
Summary
Summing up, there are multiple very meaningful reasons due to which the precious metals sector is likely to move lower in the following weeks and months and this week’s declines show that the slide has already begun. In other words, it seems that our sizable profits on the short positions are going to become even bigger shortly. We may have a local bottom later this month, though, and we’ll keep you informed regarding the possibility of seeing a bigger turnaround.
Also, last but not the least, we have a surprise for you. While everyone is wondering how low gold can slide, it’s also important to keep in mind how high gold could soar once it finally bottoms. We have just published our report on this matter and it will surely surprise those who still thought that we were long-term gold bears. You can read more about our long-term upside target for gold here.
On a different note, we would like to remind you that it is still possible to subscribe to our services using the lifetime subscription type. This means no more price increases, no hassle with updating card details and no risk of disrupting the access to our service. And it’s cheaper over the very long run. The profits on the current position (and in this year overall) are likely huge and the above might be a very good way to re-invest the gains in the signals that contributed to them. If you’re interested, please contact us for details.
As always, we’ll keep you – our subscribers – informed.
To summarize:
Trading capital (supplementary part of the portfolio; our opinion): Full short positions (250% of the full position) in gold, silver and mining stocks are justified from the risk/reward perspective with the following stop-loss orders and exit profit-take price levels:
- Gold: profit-take exit price: $1,062; stop-loss: $1,221; initial target price for the DGLD ETN: $82.96; stop-loss for the DGLD ETN $54.27
- Silver: profit-take exit price: $12.72; stop-loss: $15.56; initial target price for the DSLV ETN: $46.97; stop-loss for the DSLV ETN $28.87
- Mining stocks (price levels for the GDX ETF): profit-take exit price: $13.12; stop-loss: $20.81; initial target price for the DUST ETF: $80.97; stop-loss for the DUST ETF $30.87
Note: the above is a specific preparation for a possible sudden price drop, it does not reflect the most likely outcome. You will find more detailed explanation in our August 1 Alert. In case one wants to bet on junior mining stocks’ prices (we do not suggest doing so – we think senior mining stocks are more predictable in the case of short-term trades – if one wants to do it anyway, we provide the details), here are the stop-loss details and target prices:
- GDXJ ETF: profit-take exit price: $17.52; stop-loss: $30.72
- JDST ETF: initial target price: $154.97 stop-loss: $62.78
Long-term capital (core part of the portfolio; our opinion): No positions (in other words: cash)
Insurance capital (core part of the portfolio; our opinion): Full position
Important Details for New Subscribers
Whether you already subscribed or not, we encourage you to find out how to make the most of our alerts and read our replies to the most common alert-and-gold-trading-related-questions.
Please note that the in the trading section we describe the situation for the day that the alert is posted. In other words, it we are writing about a speculative position, it means that it is up-to-date on the day it was posted. We are also featuring the initial target prices, so that you can decide whether keeping a position on a given day is something that is in tune with your approach (some moves are too small for medium-term traders and some might appear too big for day-traders).
Plus, you might want to read why our stop-loss orders are usually relatively far from the current price.
Please note that a full position doesn’t mean using all of the capital for a given trade. You will find details on our thoughts on gold portfolio structuring in the Key Insights section on our website.
As a reminder – “initial target price” means exactly that – an “initial” one, it’s not a price level at which we suggest closing positions. If this becomes the case (like it did in the previous trade) we will refer to these levels as levels of exit orders (exactly as we’ve done previously). Stop-loss levels, however, are naturally not “initial”, but something that, in our opinion, might be entered as an order.
Since it is impossible to synchronize target prices and stop-loss levels for all the ETFs and ETNs with the main markets that we provide these levels for (gold, silver and mining stocks – the GDX ETF), the stop-loss levels and target prices for other ETNs and ETF (among other: UGLD, DGLD, USLV, DSLV, NUGT, DUST, JNUG, JDST) are provided as supplementary, and not as “final”. This means that if a stop-loss or a target level is reached for any of the “additional instruments” (DGLD for instance), but not for the “main instrument” (gold in this case), we will view positions in both gold and DGLD as still open and the stop-loss for DGLD would have to be moved lower. On the other hand, if gold moves to a stop-loss level but DGLD doesn’t, then we will view both positions (in gold and DGLD) as closed. In other words, since it’s not possible to be 100% certain that each related instrument moves to a given level when the underlying instrument does, we can’t provide levels that would be binding. The levels that we do provide are our best estimate of the levels that will correspond to the levels in the underlying assets, but it will be the underlying assets that one will need to focus on regarding the signs pointing to closing a given position or keeping it open. We might adjust the levels in the “additional instruments” without adjusting the levels in the “main instruments”, which will simply mean that we have improved our estimation of these levels, not that we changed our outlook on the markets. We are already working on a tool that would update these levels on a daily basis for the most popular ETFs, ETNs and individual mining stocks.
Our preferred ways to invest in and to trade gold along with the reasoning can be found in the how to buy gold section. Additionally, our preferred ETFs and ETNs can be found in our Gold & Silver ETF Ranking.
As a reminder, Gold & Silver Trading Alerts are posted before or on each trading day (we usually post them before the opening bell, but we don't promise doing that each day). If there's anything urgent, we will send you an additional small alert before posting the main one.
=====
Latest Free Trading Alerts:
Stocks continued lower yesterday, as investors' sentiment worsened following Turkey crisis, trade war fears, U.S. dollar rally. Will the S&P 500 index break below 2,800 mark? Or is this some bottoming pattern before an upward reversal?
Higher Again, Correction Over?
=====
Hand-picked precious-metals-related links:
PRECIOUS-Gold recovers from 19-month low as U.S. dollar softens
Global Gold Investment Demand Plunged 9% in Q2 2018
Perth Mint Launches First Government-Backed Gold ETF
=====
In other news:
Trump's latest boost to the dollar: U.S.-Turkey spat
China, U.S. to hold lower-level trade talks in late August
Turkish lira recovers as finance chief bids to calm investors
If rupee slump persists, it can hurt India's Modi
RBS bankers joked about destroying the US housing market
The Dow just registered its longest stint in correction territory in nearly 60 years
=====
Thank you.
Sincerely,
Przemyslaw Radomski, CFA
Founder, Editor-in-chief, Gold & Silver Fund Manager
Gold & Silver Trading Alerts
Forex Trading Alerts
Oil Investment Updates
Oil Trading Alerts

