

Briefly: In our opinion, small (50% of the regular size of the position) speculative short positions in gold, silver and mining stocks are justified from the risk/reward perspective at the moment of publishing this alert. We plan to increase the size of the position shortly, but we are not doing so at this time.
The USD Index’s breakdown was as severe as we had expected it to be and it managed to reach its critical support - the 2009 high. Gold also reacted as we expected – closing at $1,356.30, while we pointed to $1,357 as a likely target if the USD reached its 2009 high. This means that the gold-USD link is very much intact and the possible price performance – and preferred action regarding it – remain in place.
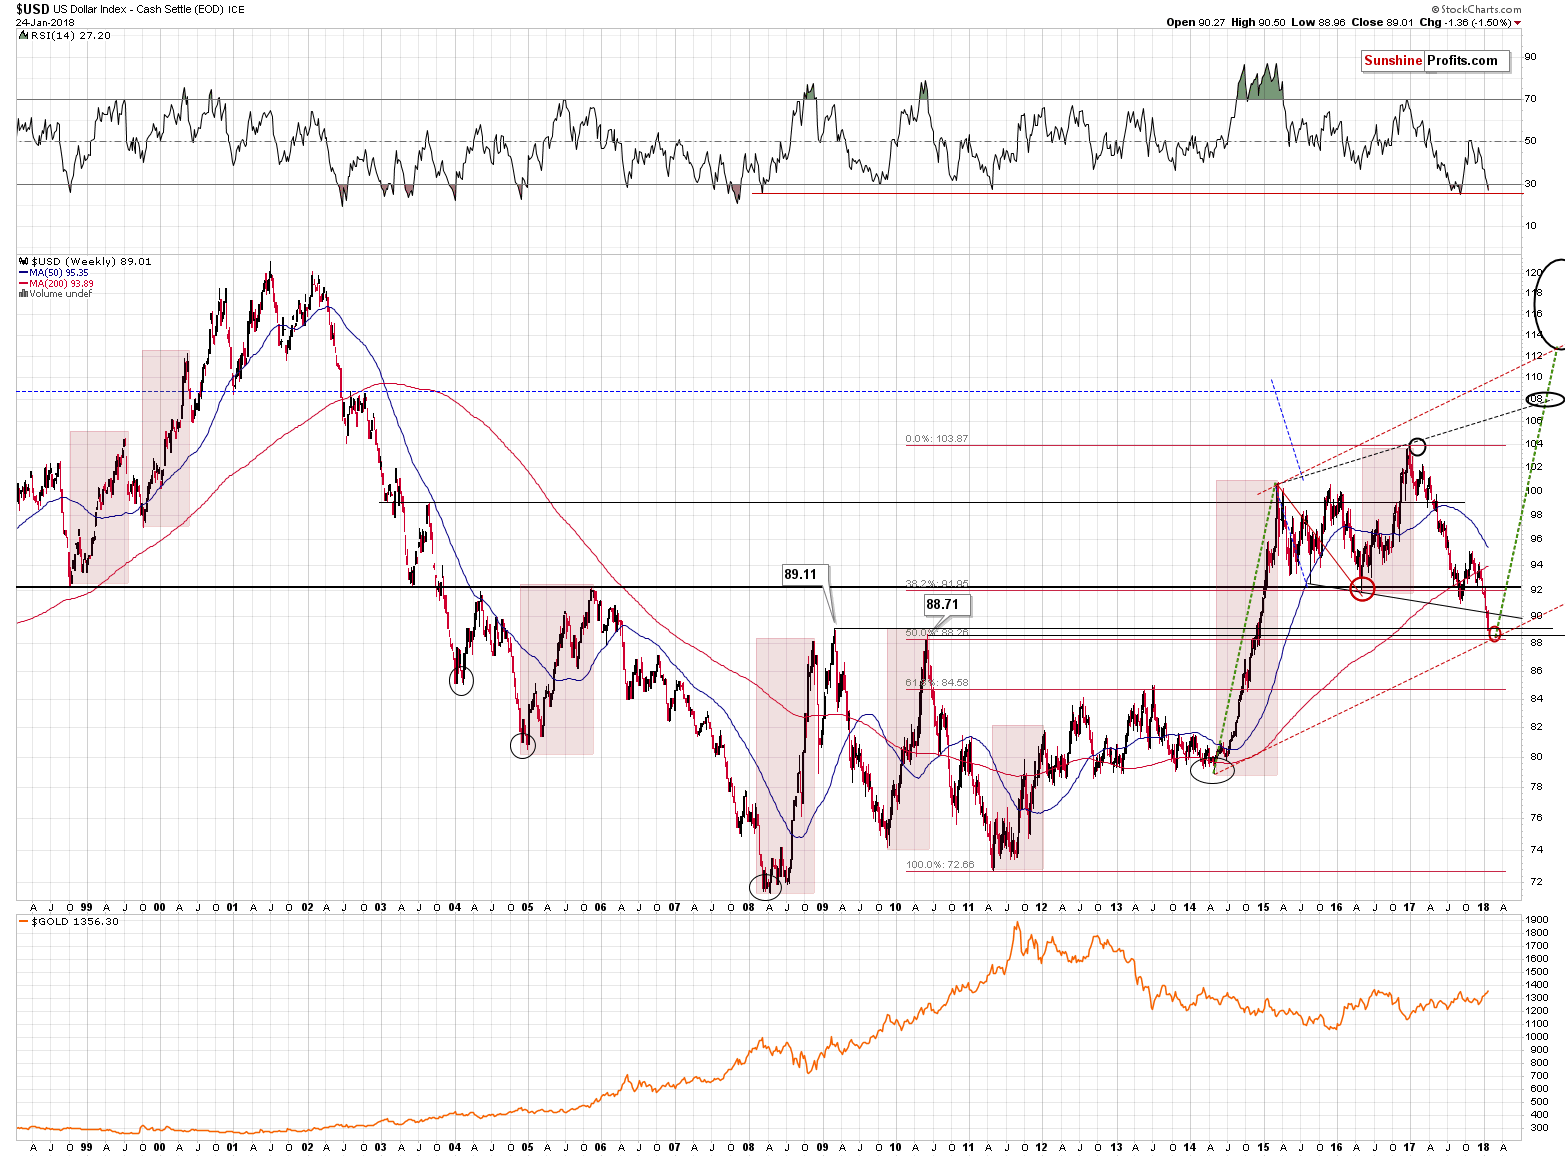
Let’s take a closer look at the USD Index chart (chart courtesy of http://stockcharts.com).
In yesterday’s alert, we wrote the following:
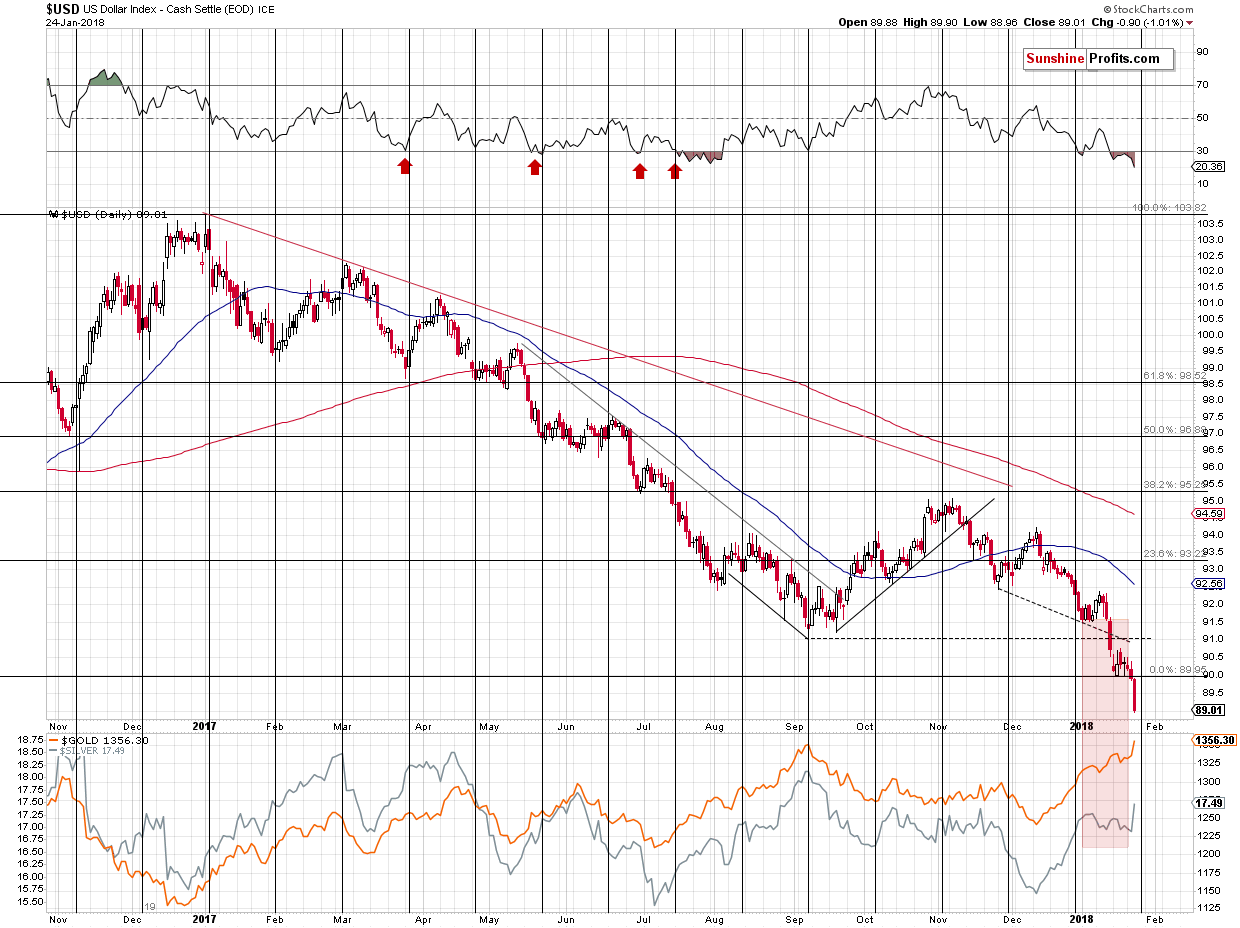
The USD Index moved to about 89.6 in today’s pre-market trading. The breakdown below the psychologically important 90 level and the declining black support line (currently at about 90.2) is a fact. It’s not confirmed, but it’s already quite substantial (0.4 below the lower of them), so it should already be taken into account as something important.
Indeed, the USD Index continued to decline and the breakdown was definitely something important – it still is.
Assuming (it doesn’t have to be the case) that the breakdown will be confirmed and that the USD Index moves lower, the key question becomes: “How low is the USD likely to move?”
In the opening paragraphs of today’s analysis, we wrote that the USD Index was close to an extremely strong support. This is actually a combination of very important support levels. The first two are created based on the 2009 and 2010 tops and the final one is the 50% Fibonacci retracement level. The previous Fibonacci retracement worked very well, stopping USD declines in 2015 and 2016, so the 50% retracement is something very significant.
These support levels are at 89.11, 88.71 and 88.26. In other words, the highest thereof is just 0.49 below today’s pre-market low. Furthermore, it means that a major support will be reached if the USD only – approximately – repeats today’s decline. Reaching lower support levels would mean doubling or tripling today’s decline, respectively – again, approximately.
With gold up about $8 at the moment of writing these words, this means another $8 - $24 rally before the top is in. In other words, all the above makes likely is a move in gold to $1,357 - $1,373.
On the above short-term chart, you can see how gold and silver reacted to the USD’s 2-index-point decline that we’ve seen this year – gold rallied about $25. Keeping this way of reacting to the USD’s weakness, gold could simply move to $1,360 or so (the September high). Is this really a significant move higher?
Before translating the above (we’ll use the more bullish analogy of $1,357 - $1,373 as the target area) into an actionable suggestion, let’s consider a very important factor. It took a few hours of overnight trading for gold to move $8 higher and after the top gold could easily decline as fast or twice as fast. Consequently, by exiting the price now, we may not be able to get back on the short side of the market at better prices.
If gold already moves higher by $8 before this message reaches you and you are able to act on it and it’s at $1,357 at that time, then exiting the position means the possibility of “saving” on the additional $0 - $16 rally, but only if you assume that you’re able to get back into the short position right at the top. Realistically, if you wait for at least another $8 decline to be more certain that the reversal has taken place, you’d be re-entering the short position between $8 lower and $8 higher than the exit price. So, on average, you’d gain nothing from all the hassle of exiting and entering the position. Naturally, your broker will be very happy to charge you a commission for both trades, which makes it even worse on your end.
So, taking the above realistic scenario into account, is it prudent for one to close their position? The more short-term oriented you are and the more time you have to watch the market, the more sense it makes. Adjusting the position significantly makes sense for day-traders, but for those who want to catch the big fish, it’s not necessarily the case.
The above possibility turned out to be a reality – gold has indeed moved about $8 higher since we wrote the above, while the USD Index moved to the first of its very strong, long-term support levels. This means that the maximum of the potential upside is an additional $16 or so and it seems that the values between $0 and $8 are more probable (more on that later). Of course, the above is based on a huge IF. If the USD Index declines at all. It just reached a very important support, it’s very oversold and it’s just before a cyclical turning point. That’s a bullish combination and the USD could rally right away, triggering powerful declines in metals and miners.
This means that it doesn’t seem to be worth it to further adjust the position – it’s ready to take advantage of lower PM prices and at the same time it’s small enough for the entire portfolio not to be overly impacted by the additional upswing.
In yesterday’s alert, we also noted the following:
There is also an additional factor that’s worth considering that’s not visible on the charts. The ECB interest rate decision and the following press conference are scheduled for tomorrow morning. This means that during the next 24 hours or so, the tensions and uncertainty will be very high. Regardless of the decision and the announcement, the uncertainty will drop in the near future. This, in turn, means that any temporary or artificial move is likely to be reversed.
Yes, regardless of what’s going to happen, we simply could see the “buy the rumor, sell the fact” kind of reaction. We saw it many times in the past, for instance in the form of a declining USD right after the interest rate hike or a plunge in the price of silver after the introduction of the SLV ETF, which was supposed to be positive news for the silver market.
So, all that happened yesterday and what is happening today, and what might happen in the next 24 hours could be reversed in a flash after tomorrow’s European news.
We are writing this alert before the ECB interest rate decision and the press conference, but you will probably read it after it. This makes it difficult to decide whether to publish the alert as soon as possible or to wait for the ECB comments that could shake the market. Since the markets are relatively calm so far today, we decided to send this alert as quickly as possible, but we are keeping our eyes on the market and we’ll be ready to provide you with an intraday update if anything changes. This is quite likely – we expect to be back on the short side of the market with a larger position and we could make this decision based on the developments that take place before the closing bell.
By the way, since we are discussing the USD Index, let’s also take a look at its two biggest components.
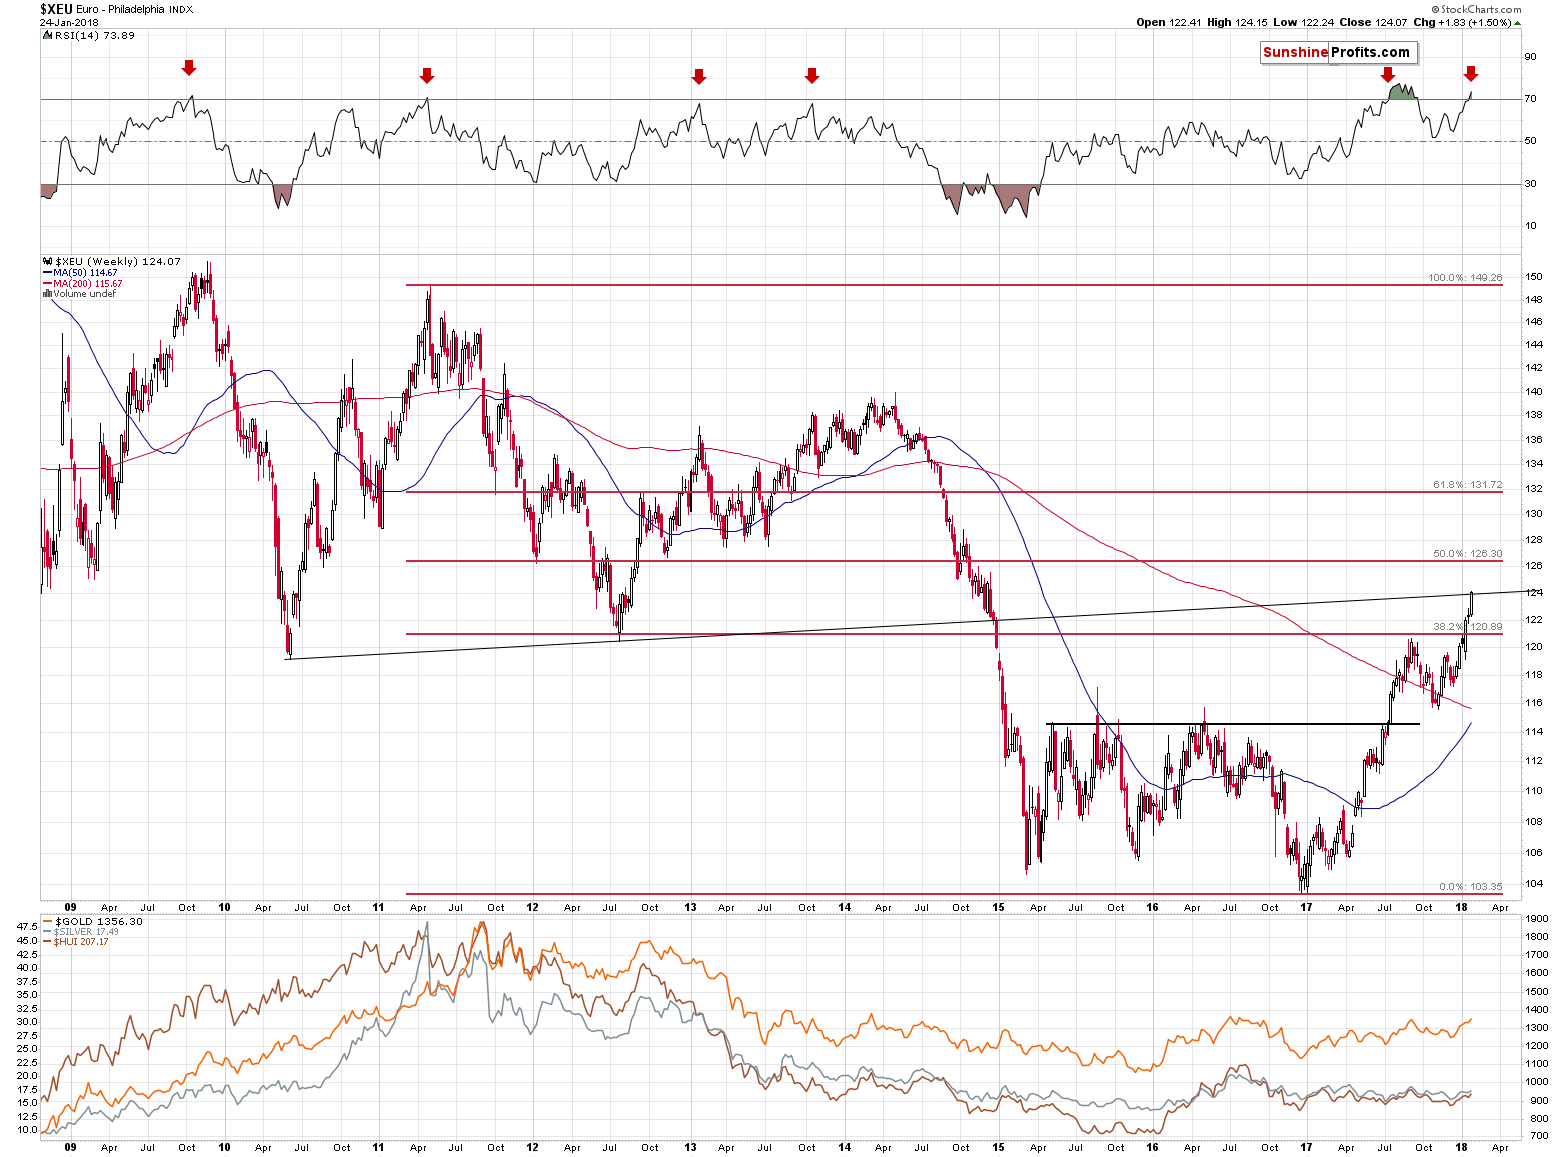
The Euro Index broke above the 38.2% Fibonacci retracement level and it just reached another resistance level. This one is created based on the 2010 and 2012 bottoms. It seems important, because its proximity stopped the decline in late 2014. It stopped it for just a while, but still, it showed that this line is indeed important.
Let’s not forget that the RSI is above the 70 level and the proximity of this level triggered bearish reversals several times in the past.
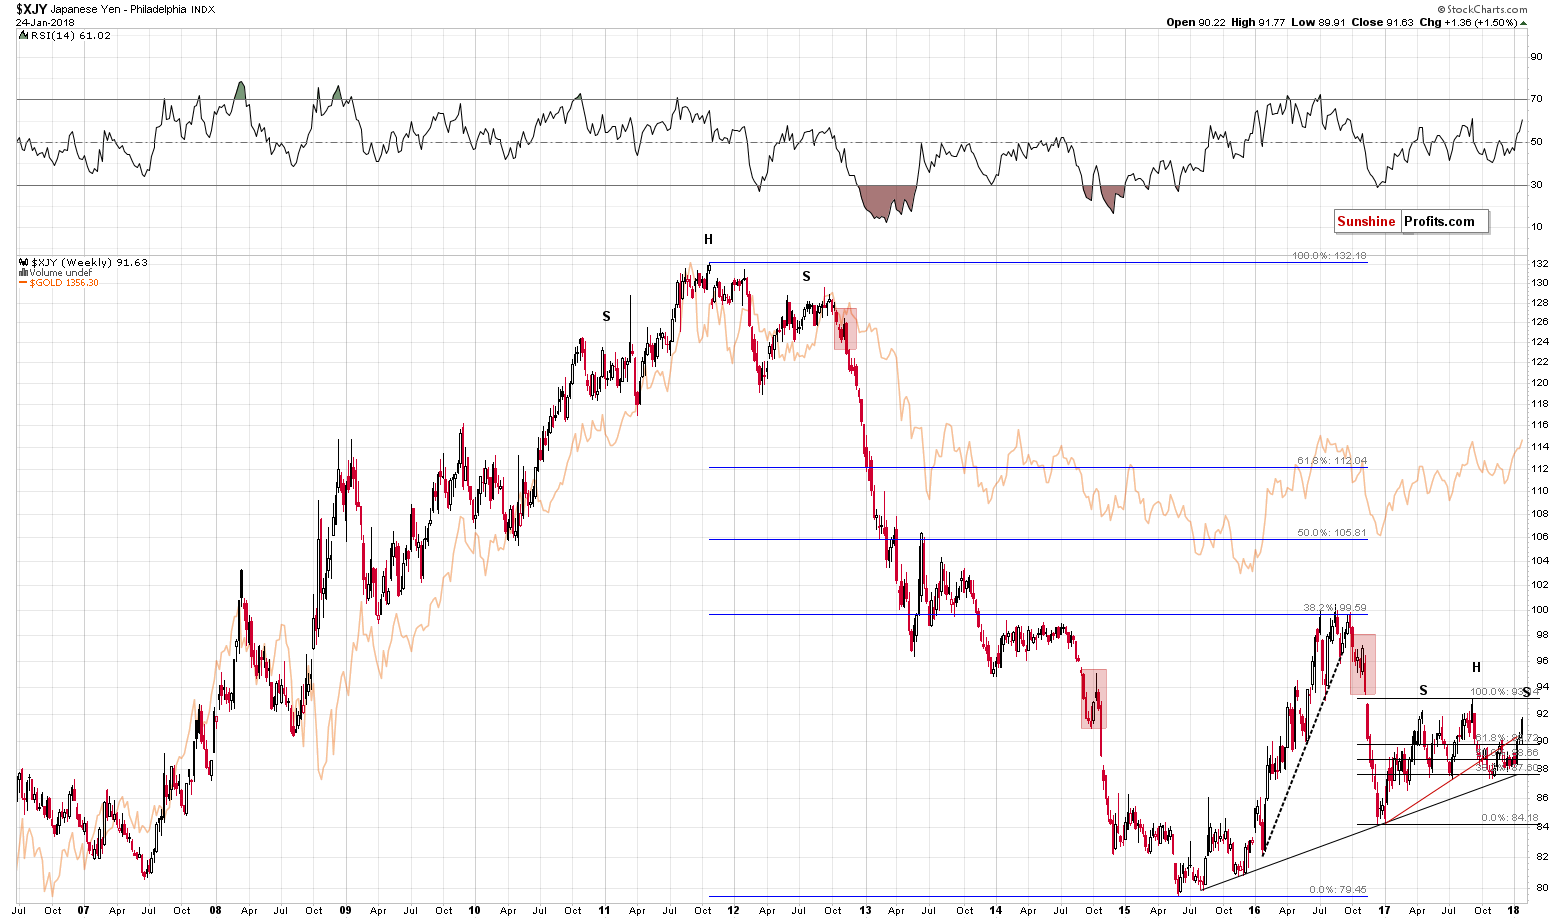
The Japanese yen moved above the rising red support / resistance line. This move could still be invalidated, but it’s not that clear anymore – the yen is too much above the line for the reversal to be imminent.
So, while the short-term situation for the yen is unclear based on the long-term picture (you’ll find more short-term details in our Forex Trading Alerts), there is a – potentially – interesting development that we would like to mention. The formation is far from being complete, but it’s possible that a decline from here would result in a quite clear head-and-shoulders pattern.
What’s so interesting about it? The 2011 tops in the yen and gold as well as the 2016 tops in yen and gold all took shape of this pattern. Again, that’s just a possibility at this time, but something that’s worth keeping in mind.
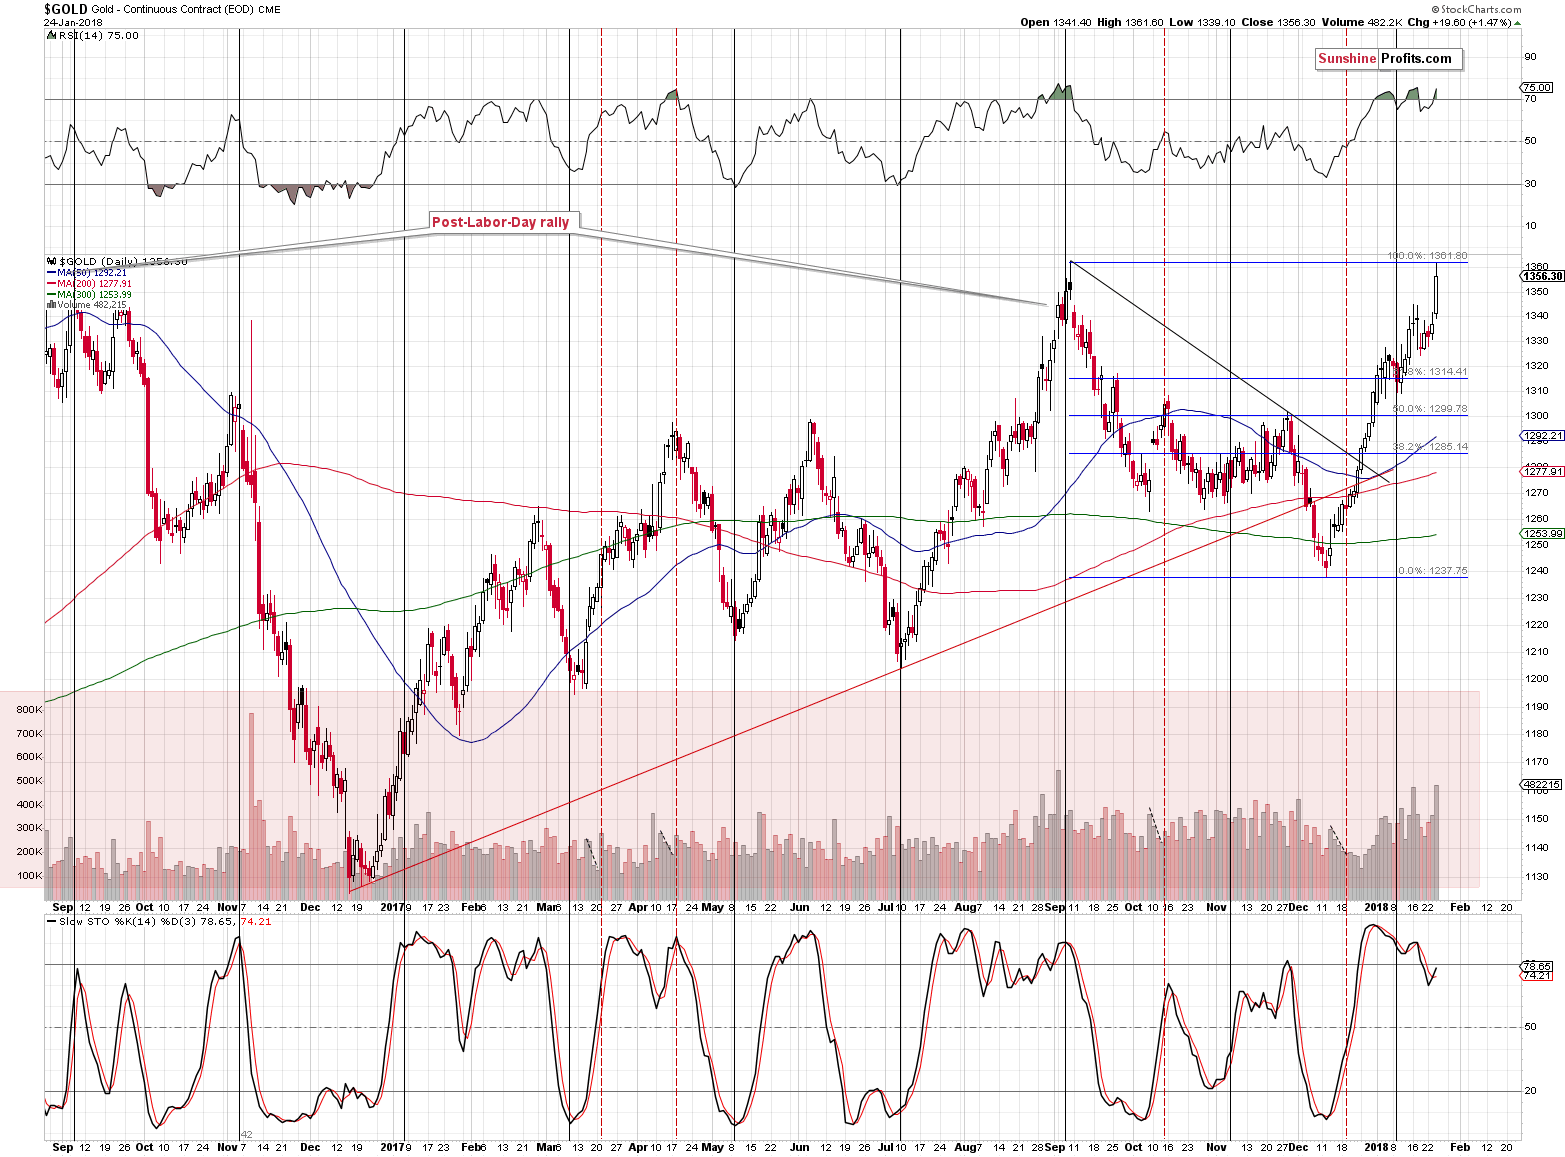
Moving to gold, we see that even though the USD Index declined visibly and significantly before its previous lows, gold wasn’t able to break above its September 2017 high. This, along with the overbought status of the RSI, paints a bearish picture for the following weeks.
However, gold moved higher on significant volume and we saw a small buy signal from the Stochastic indicator, so the overall implications (taking also the previous paragraph into account) of the above chart are rather neutral for the short term.
While describing the situation in the USD Index we wrote that the potential size of an additional rally (again, based on the huge IF) in gold is more likely to be $0 - $8 than $16. The above chart shows why.
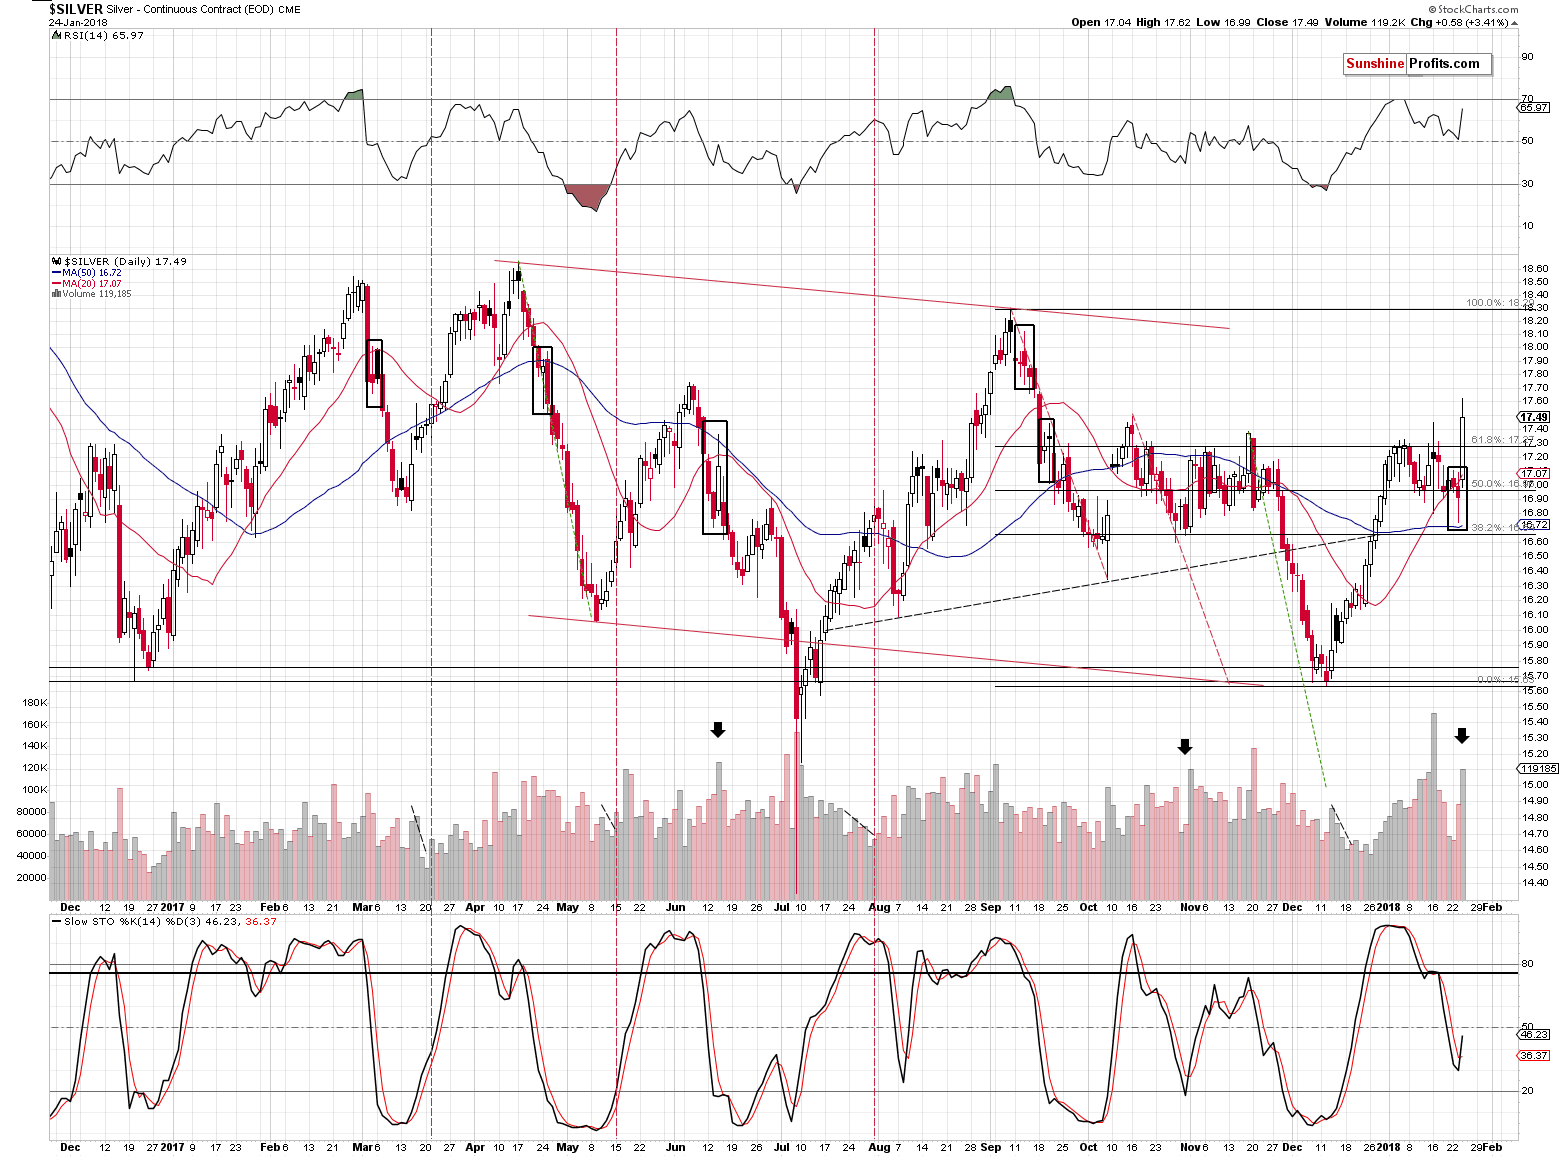
Silver soared, outperforming gold on a very short-term basis. This is exactly what we see as a topping confirmation. We wrote about it numerous times in the past and we have just seen the signal in all its glory. The implications of a big rally appear bullish for those who are new to this market, but knowing silver’s performance over the years, we realize that it’s very likely a bearish trap.
Moreover, please note that silver’s big one-session rallies on big volume didn’t necessarily result in higher prices. In fact, we marked two analogous cases with black arrows on the above chart. In one case that was just a pause before the decline resumed and in the second case we saw silver consolidating and finally declining anyway. The implications of yesterday’s spike in volume are not bullish, but bearish.
By the way, we published yesterday’s alert at 9:06 AM EST, so significantly lowering the exposure for the remaining part of the session seems to have been a good strategy.
Wait a minute, didn’t you guys just write about a spike in the volume that was supposed to be followed by a decline in the upcoming weeks?
We did. And these comments remain up-to-date:
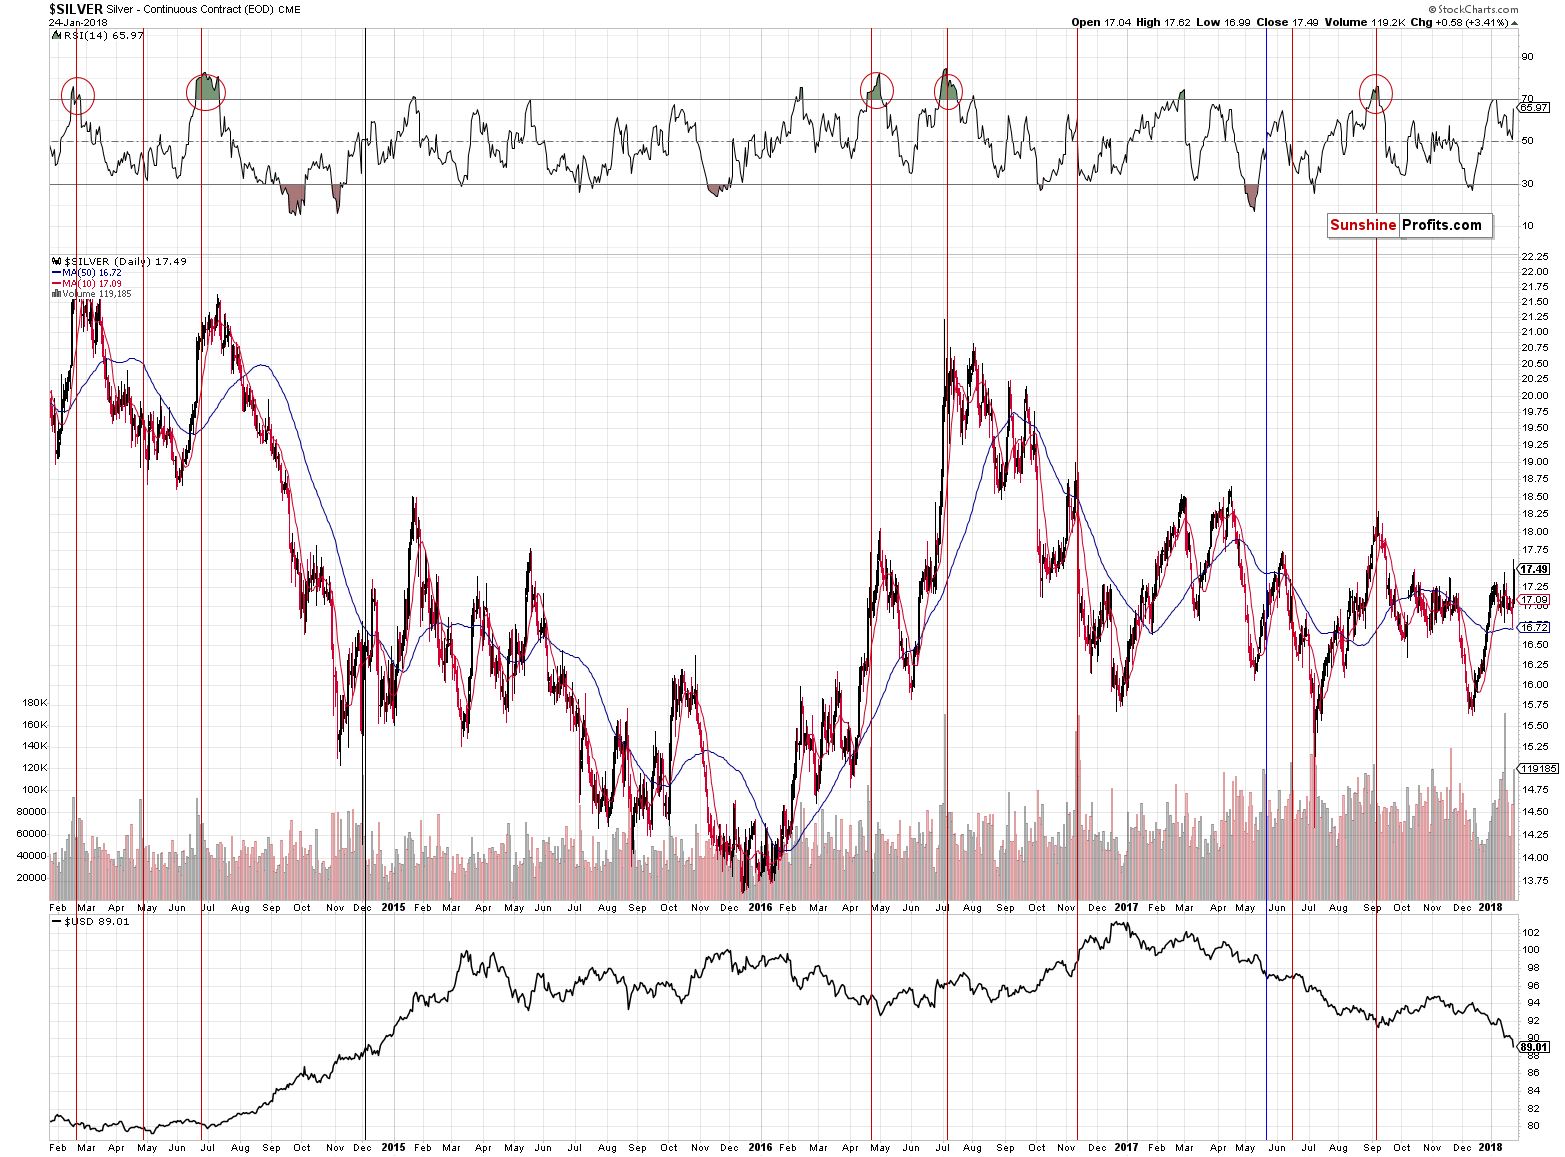
However, it is most important that the volume was extremely big – not that it broke a few records. History tends to repeat itself, so the key question is what silver did after previous sessions when it traded on huge volume.
It usually declined. We marked the similar sessions with vertical lines and we used the red color for the cases when a bigger decline followed either immediately or shortly. The black line represents the session that was not followed by anything specific and the blue session was followed by higher silver prices in the short term.
The red sessions dominate, which makes the current session bearish. However, what makes it very bearish is considering the above together with the RSI indicator. The latter shows the status of the market when the huge-volume upswing was seen.
Whenever silver moved higher on huge volume when the RSI was above 60, it meant that a top was in or at hand. We marked those situations with red ellipses. The RSI closed at 62 yesterday, which makes the current combination of signals very bearish.
Has silver topped based the extreme volume reading? It could be the case, but this is not what the above chart is saying. It’s saying that a big decline is just around the corner and paying a lot of attention to bullish signs might be misleading.
The fact that silver moved higher yesterday didn’t invalidate the previous bearish signal for two reasons. Firstly, silver virtually had to react somehow to the USD’s huge slide and if the rally just ended, then the very short-term outperformance is rather natural, not surprising or invalidating anything. Secondly, the previous signal was not saying that the top had to be in at the moment when it was seen. We emphasized that it meant that the big decline was just around the corner – and this continues to be the case. It seems that we are now very close to this moment – also based on the huge-volume signal that we saw about a week ago.
Moving on to mining stocks, let’s take a look at their performance form the long-term point of view before moving on to the shape of yesterday’s session.
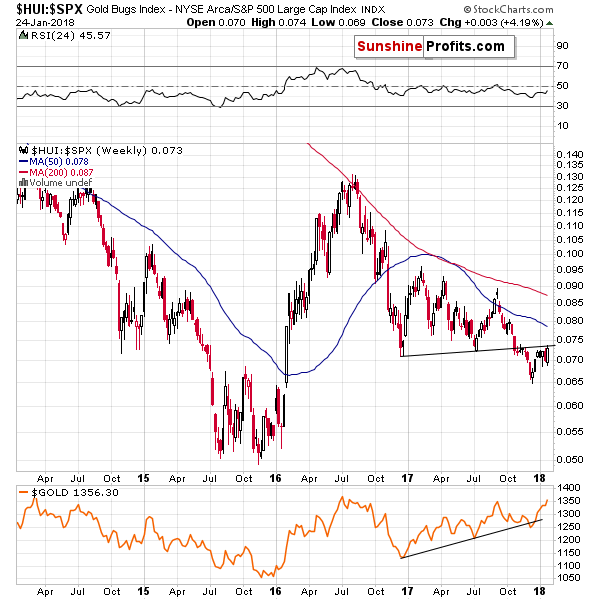
Unsurprisingly, from the long-term perspective and when taking into account the miners’ performance in comparison to other stocks, nothing changed. The breakdown was not invalidated and the implications remain clearly bearish.
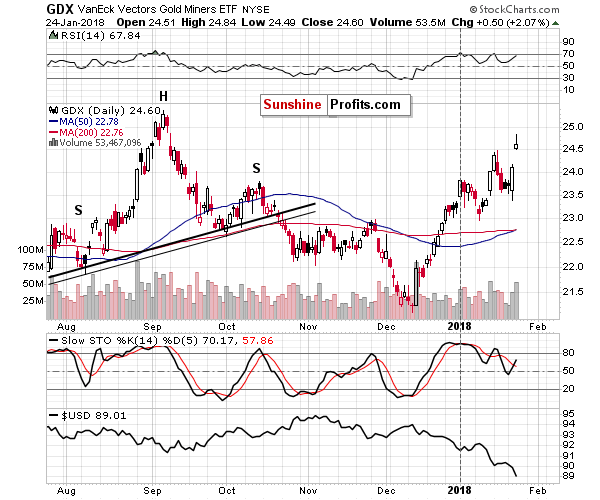
On the short-term chart, we see that miners rallied and… That they reversed by forming a reversal shooting star candlestick. Such patterns are valid if they are confirmed by big volume. That’s exactly what we saw.
The RSI indicator is very close to the 70 level, suggesting a good possibility of a move lower either from the current price levels or from slightly higher ones. Still, the shape of yesterday’s session suggests that the bottom is already in.
Before summarizing, let’s take a look at gold from the long-term perspective. The question that we would like to address is if anything changed regarding the estimate for the upcoming bottom given what happened this week.
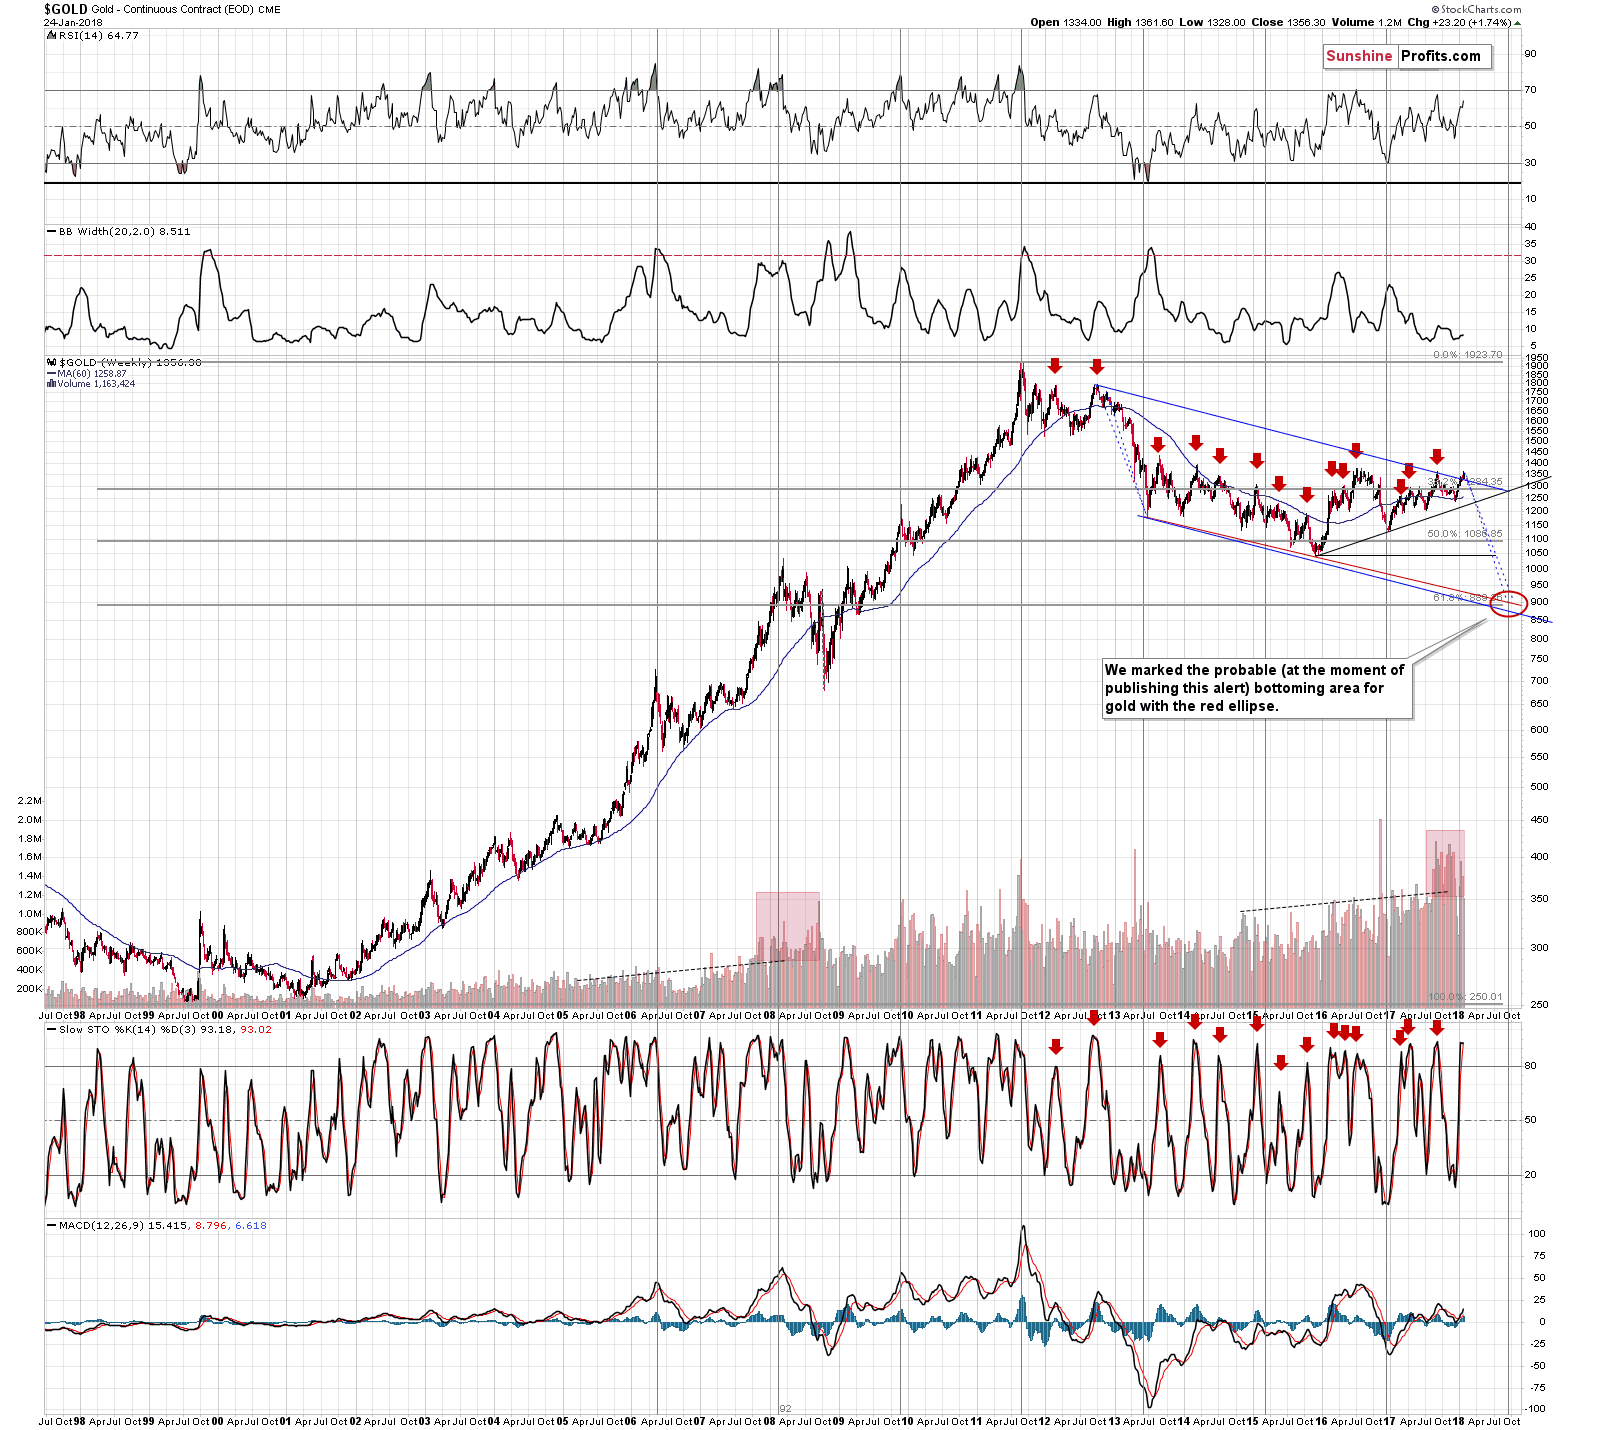
In short, no, nothing changed. The bottoming price-time target is based on several factors and the only one that could have been affected is the analogy to the 2012 – 2013 decline. Instead of applying it to the September top, we will now be applying it to the current / upcoming (if we didn’t see one yesterday) top.
Doing so, provides us with the time target of early October and a price target of $889. This is remarkable, because we already featured the late September and early October as the likely time target for the turnaround and we’ve been featuring the $889 level (sometimes rounding it to $890 or $900) for some time. What happened this week doesn’t invalidate anything of the above – it fits in an almost perfect manner.
Summing up, based on the USD’s visible breakdown below 90, we have just seen lower USD values and higher precious metals values, however, based on the strength of the metals’ reaction to the USD’s movement, it’s probable that gold will not rally very far. In fact, based on the level that was reached in the USD and gold, on silver’s short-term outperformance of gold, and on the mining stocks’ shooting start reversal candlestick, it could be the case that the top is already in.
Thank you.
As always, we will keep you – our subscribers – informed.
To summarize:
Trading capital (supplementary part of the portfolio; our opinion): Small short positions (50% of the full position) in gold, silver and mining stocks are justified from the risk/reward perspective with the following stop-loss orders and initial target price levels:
- Gold: initial target price: $1,218; stop-loss: $1,382; initial target price for the DGLD ETN: $53.98; stop-loss for the DGLD ETN $37.68
- Silver: initial target price: $14.63; stop-loss: $17.82; initial target price for the DSLV ETN: $33.88; stop-loss for the DSLV ETN $20.88
- Mining stocks (price levels for the GDX ETF): initial target price: $19.22; stop-loss: $26.14; initial target price for the DUST ETF: $39.88; stop-loss for the DUST ETF $15.78
In case one wants to bet on junior mining stocks' prices (we do not suggest doing so – we think senior mining stocks are more predictable in the case of short-term trades – if one wants to do it anyway, we provide the details), here are the stop-loss details and initial target prices:
- GDXJ ETF: initial target price: $27.82; stop-loss: $38.22
- JDST ETF: initial target price: $94.88 stop-loss: $37.78
Long-term capital (core part of the portfolio; our opinion): No positions (in other words: cash)
Insurance capital (core part of the portfolio; our opinion): Full position
Important Details for New Subscribers
Whether you already subscribed or not, we encourage you to find out how to make the most of our alerts and read our replies to the most common alert-and-gold-trading-related-questions.
Please note that the in the trading section we describe the situation for the day that the alert is posted. In other words, it we are writing about a speculative position, it means that it is up-to-date on the day it was posted. We are also featuring the initial target prices, so that you can decide whether keeping a position on a given day is something that is in tune with your approach (some moves are too small for medium-term traders and some might appear too big for day-traders).
Plus, you might want to read why our stop-loss orders are usually relatively far from the current price.
Please note that a full position doesn’t mean using all of the capital for a given trade. You will find details on our thoughts on gold portfolio structuring in the Key Insights section on our website.
As a reminder – “initial target price” means exactly that – an “initial” one, it’s not a price level at which we suggest closing positions. If this becomes the case (like it did in the previous trade) we will refer to these levels as levels of exit orders (exactly as we’ve done previously). Stop-loss levels, however, are naturally not “initial”, but something that, in our opinion, might be entered as an order.
Since it is impossible to synchronize target prices and stop-loss levels for all the ETFs and ETNs with the main markets that we provide these levels for (gold, silver and mining stocks – the GDX ETF), the stop-loss levels and target prices for other ETNs and ETF (among other: UGLD, DGLD, USLV, DSLV, NUGT, DUST, JNUG, JDST) are provided as supplementary, and not as “final”. This means that if a stop-loss or a target level is reached for any of the “additional instruments” (DGLD for instance), but not for the “main instrument” (gold in this case), we will view positions in both gold and DGLD as still open and the stop-loss for DGLD would have to be moved lower. On the other hand, if gold moves to a stop-loss level but DGLD doesn’t, then we will view both positions (in gold and DGLD) as closed. In other words, since it’s not possible to be 100% certain that each related instrument moves to a given level when the underlying instrument does, we can’t provide levels that would be binding. The levels that we do provide are our best estimate of the levels that will correspond to the levels in the underlying assets, but it will be the underlying assets that one will need to focus on regarding the signs pointing to closing a given position or keeping it open. We might adjust the levels in the “additional instruments” without adjusting the levels in the “main instruments”, which will simply mean that we have improved our estimation of these levels, not that we changed our outlook on the markets. We are already working on a tool that would update these levels on a daily basis for the most popular ETFs, ETNs and individual mining stocks.
Our preferred ways to invest in and to trade gold along with the reasoning can be found in the how to buy gold section. Additionally, our preferred ETFs and ETNs can be found in our Gold & Silver ETF Ranking.
As a reminder, Gold & Silver Trading Alerts are posted before or on each trading day (we usually post them before the opening bell, but we don't promise doing that each day). If there's anything urgent, we will send you an additional small alert before posting the main one.
=====
Latest Free Trading Alerts:
Yesterday, gold won an influential supporter in the White House. Who is he?
S&P 500 index lost 0.1% on Wednesday, as it continued to fluctuate along its record highs. Is this a topping pattern or just another consolidation within an uptrend?
More Volatility And Profit Taking But Still No Fear
The depreciation of the greenback supported the yellow metal in 2017. Will the downward trend in the U.S. dollar continue in 2018? We invite you to read our today’s article about the prospects of the greenback and learn about the implications for the price of gold.
Dollar Will be Key to Gold Sesame
=====
Hand-picked precious-metals-related links:
PRECIOUS-Dollar slump drives gold to highest since August 2016
Gold Is Heading Towards a Four-Year High
=====
In other news:
Dollar Extends Drop; Euro Steady as ECB Holds Rate: Markets Wrap
=====
Thank you.
Sincerely,
Przemyslaw Radomski, CFA
Founder, Editor-in-chief, Gold & Silver Fund Manager
Gold & Silver Trading Alerts
Forex Trading Alerts
Oil Investment Updates
Oil Trading Alerts

