

Briefly: in our opinion, full (250% of the regular size of the position) speculative short positions in gold, silver and mining stocks are justified from the risk/reward perspective at the moment of publishing this alert. We are moving the stop-loss levels higher for gold, silver, and mining stocks.
The general stock market declined yesterday, but this time the session was far from being boring in the case of the precious metals sector. Silver moved higher in a moderate way, but gold and gold stocks soared. The President of the most powerful country on Earth called the decisions of the most important monetary official “crazy”. That’s definitely enough to shock the markets and to trigger a substantial move. Definitely a lot happened, but did as much change?
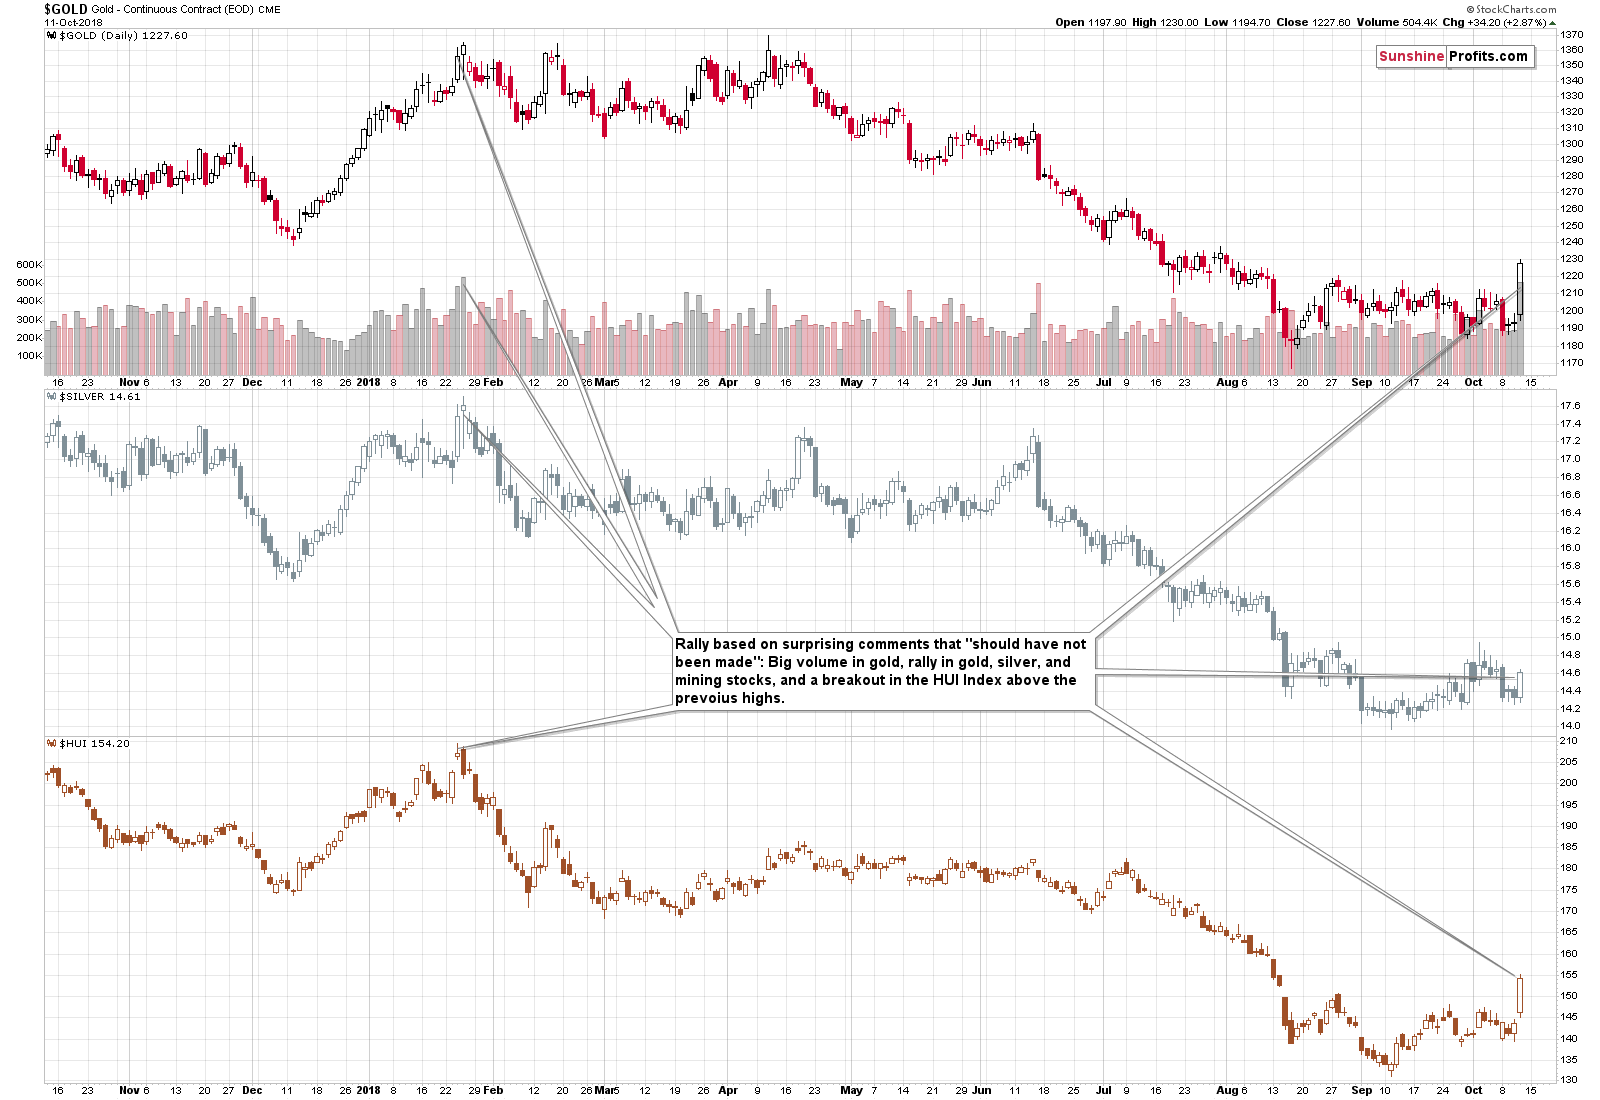
Let’s start with the chart that features all three key components of the mining stock sector: gold, silver, and mining stocks. We’ll use the GDX ETF as a proxy for the latter.
Simultaneous Rally
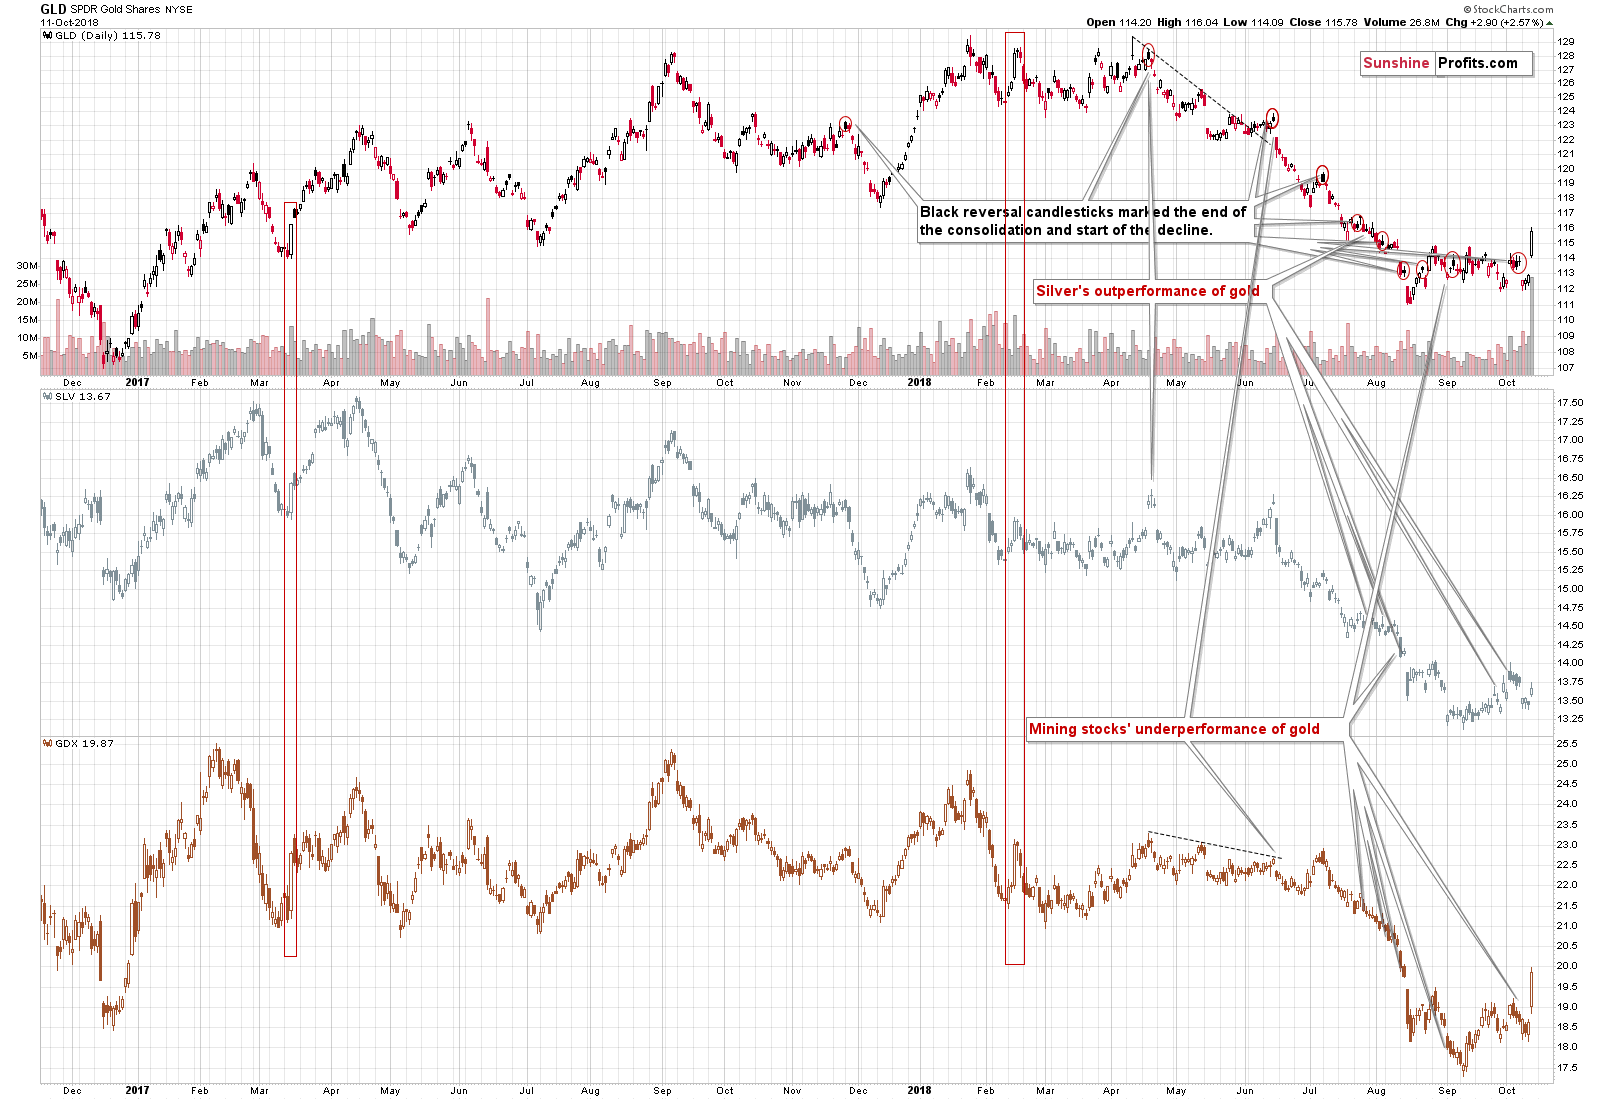
Gold rallied on huge volume and in the recent past huge volume rallies were usually seen at the tops, so that’s not a bullish sign, even though it appears to be. But, gold rallied along with silver and – most importantly – mining stocks, which makes the situation quite different. Different, however, doesn’t mean that it was something that we didn’t see previously. We did, and we marked those cases with red rectangles. In the recent past, there were 2 such cases. One of them was at the beginning of a rally, and the other was at the end of the counter-trend upswing. Overall, the implications of the rally – by itself – are therefore minimal as implications of both cases cancel each other out.
Let’s take a look at individual parts of the PM market in greater detail.
Gold’s Significant Rally
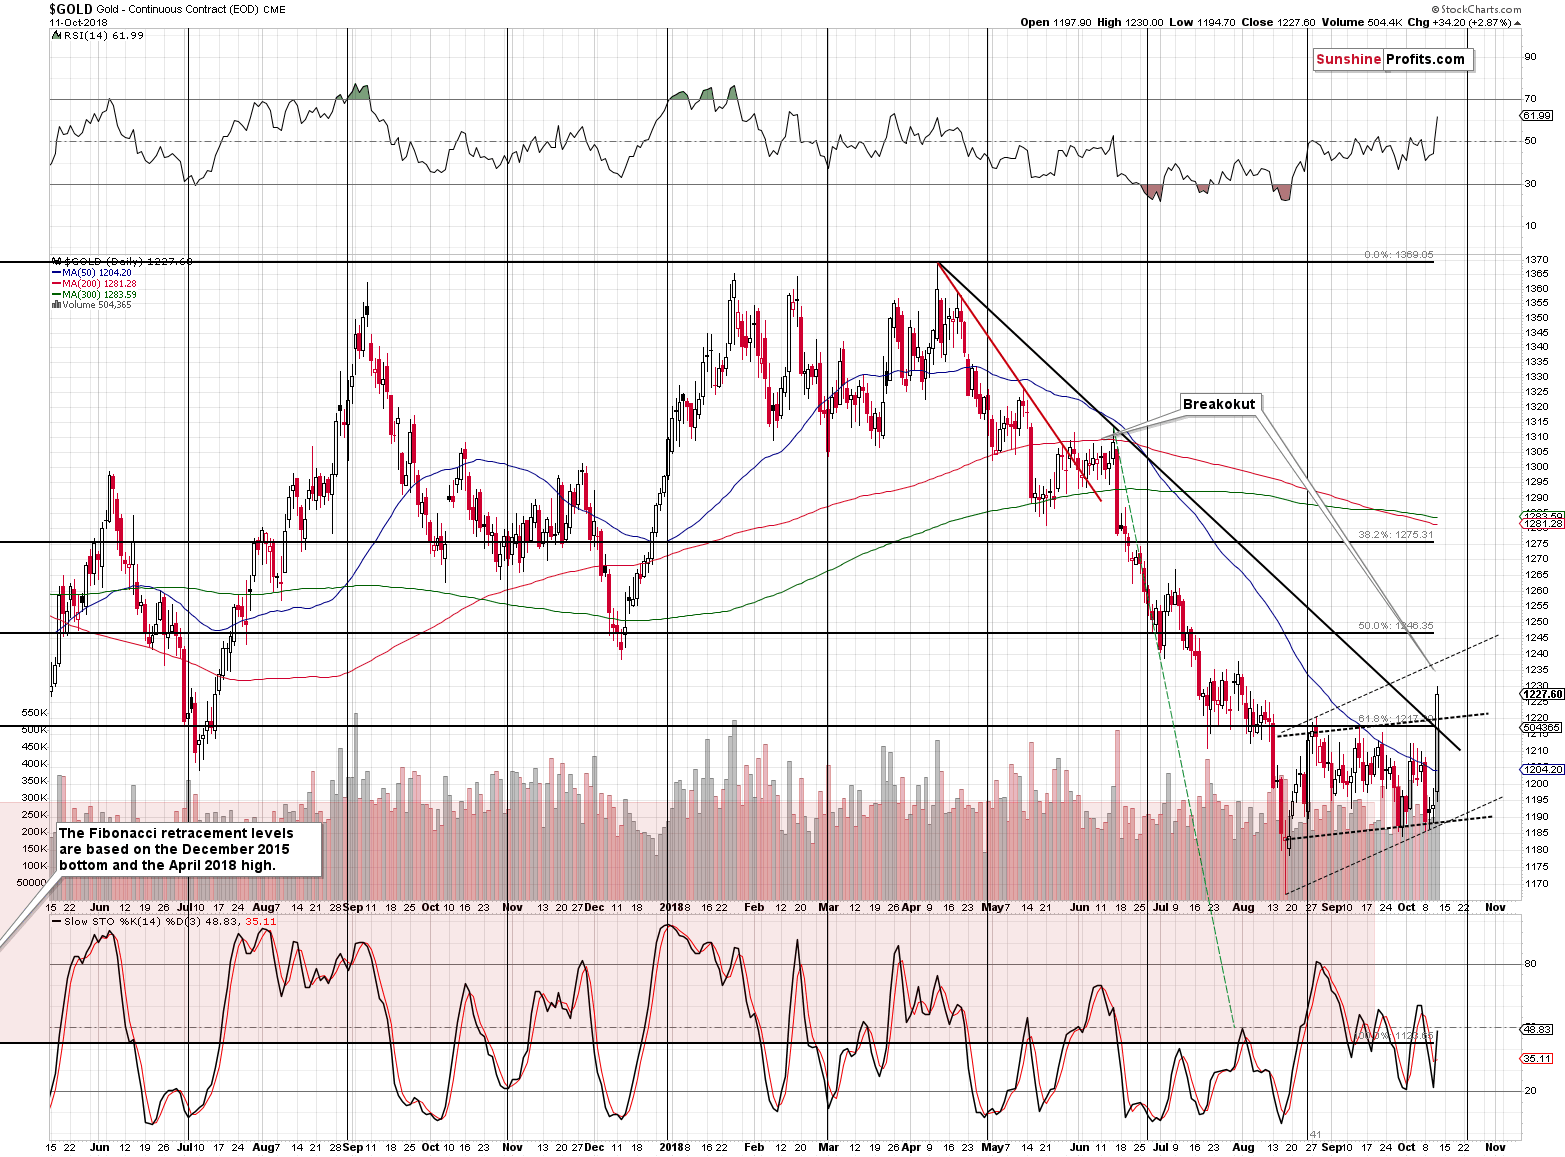
Gold broke above the declining resistance line based on the previous local tops, above the 61.8% Fibonacci retracement level based on the December 2015 low and the April 2018 high, and above the flag pattern based on the closing prices.
If confirmed, this would be a very bullish development for the short term. It’s not likely to change the medium-term trend, but it could generate a short-term rally. If. The week is ending today and yesterday’s rally was likely very emotional and news-driven, which means that it could be reversed at least partially. This would be a very strong bearish sign for the short term. Consequently, making adjustments to the trade based on the above chart alone seems premature at this time.
Silver’s Insignificant Rally
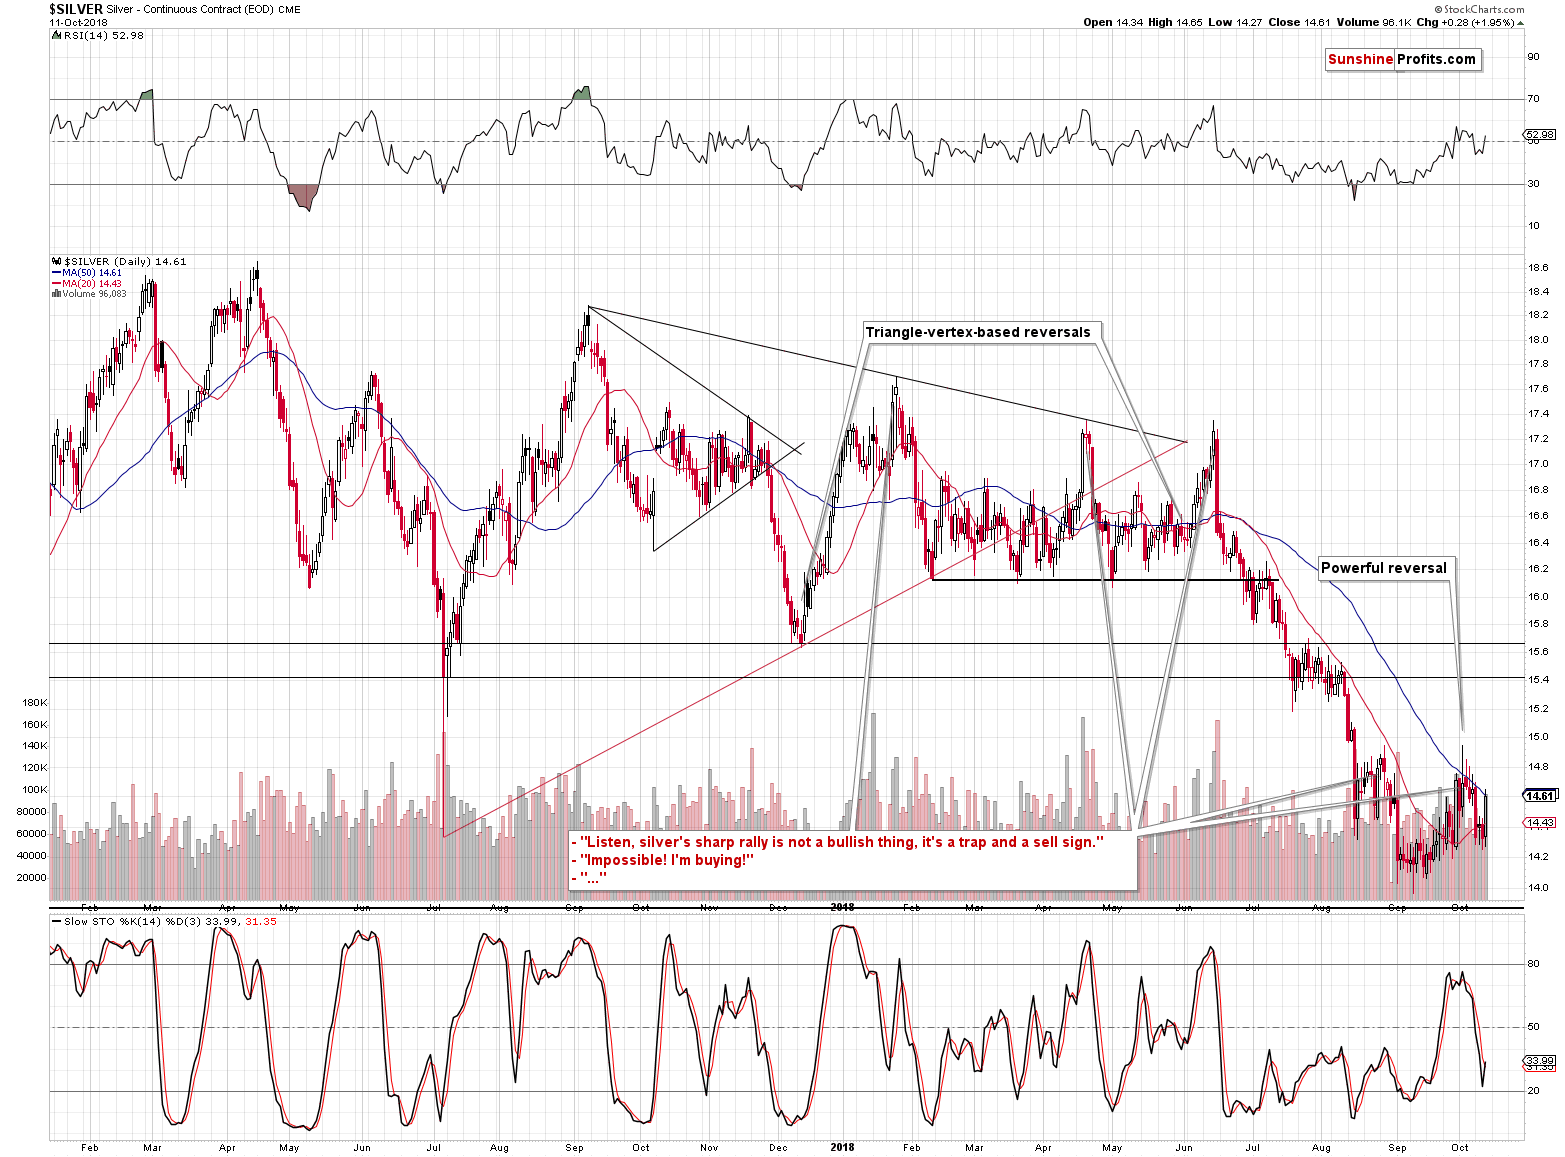
Silver moved higher, but didn’t close above its 50-day moving average, and it didn’t move above the previous highs in terms of the daily closing prices, let alone in the intraday highs. Looking at the white metal, yesterday was not special and nothing changed regarding the downtrend.
Mining stocks, however, showed significant strength.
Mining Stocks’ Signals
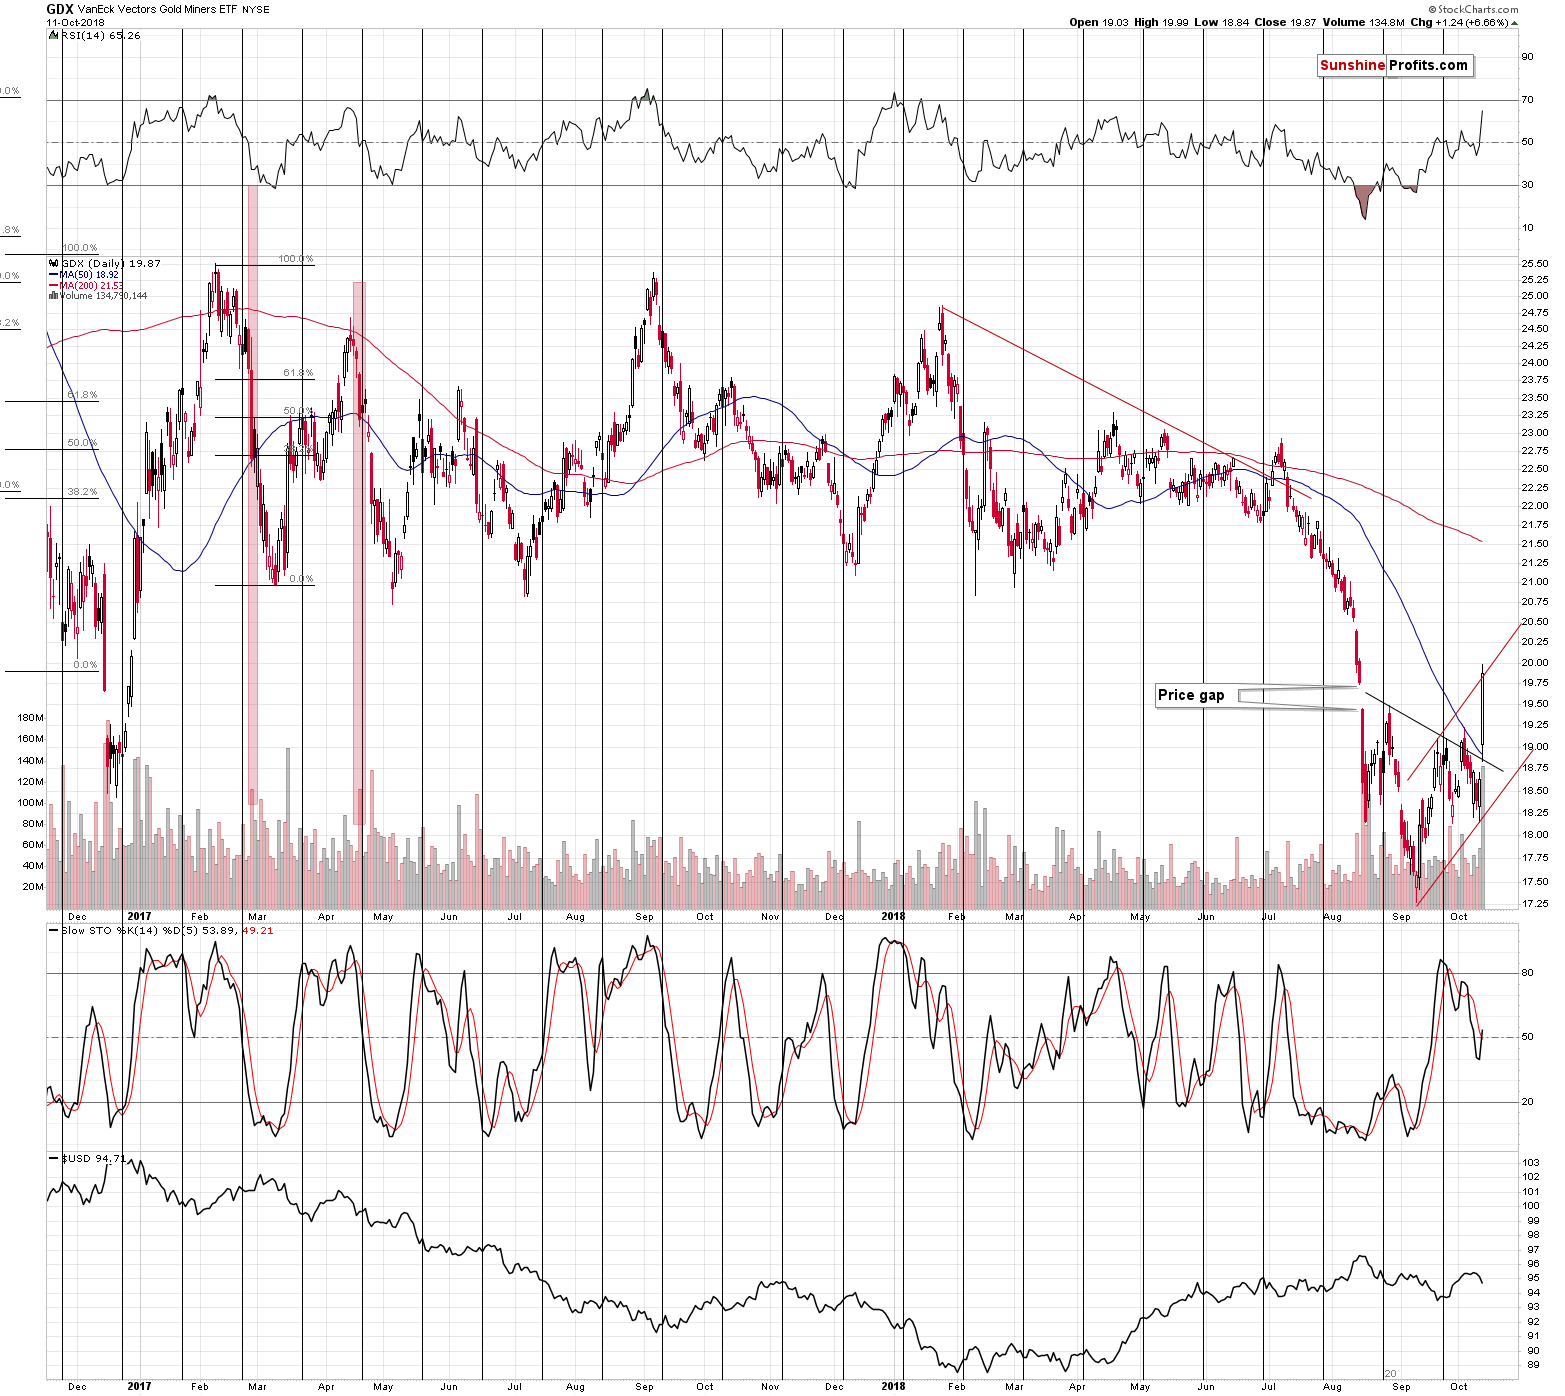
Miners rallied on huge volume and closed the session a bit above their previous price gap – practically right at the upper border of the flag pattern. The ABC (zigzag) flag pattern is based on the assumption that the initial rally of the correction will be similar in size to the final one.
At the same time, the miners broke above the neck level of the inverse head-and-shoulders pattern, which is a bullish development. This breakout was likely to be followed by a rally and we did see a rally. The price may have further to go based on this pattern, but since that was just one close after the breakout, and the rally had very volatile and news-based nature, it’s unclear if it’s sustainable, especially given the less visible, but not less important details.
Silver Stocks Disagree
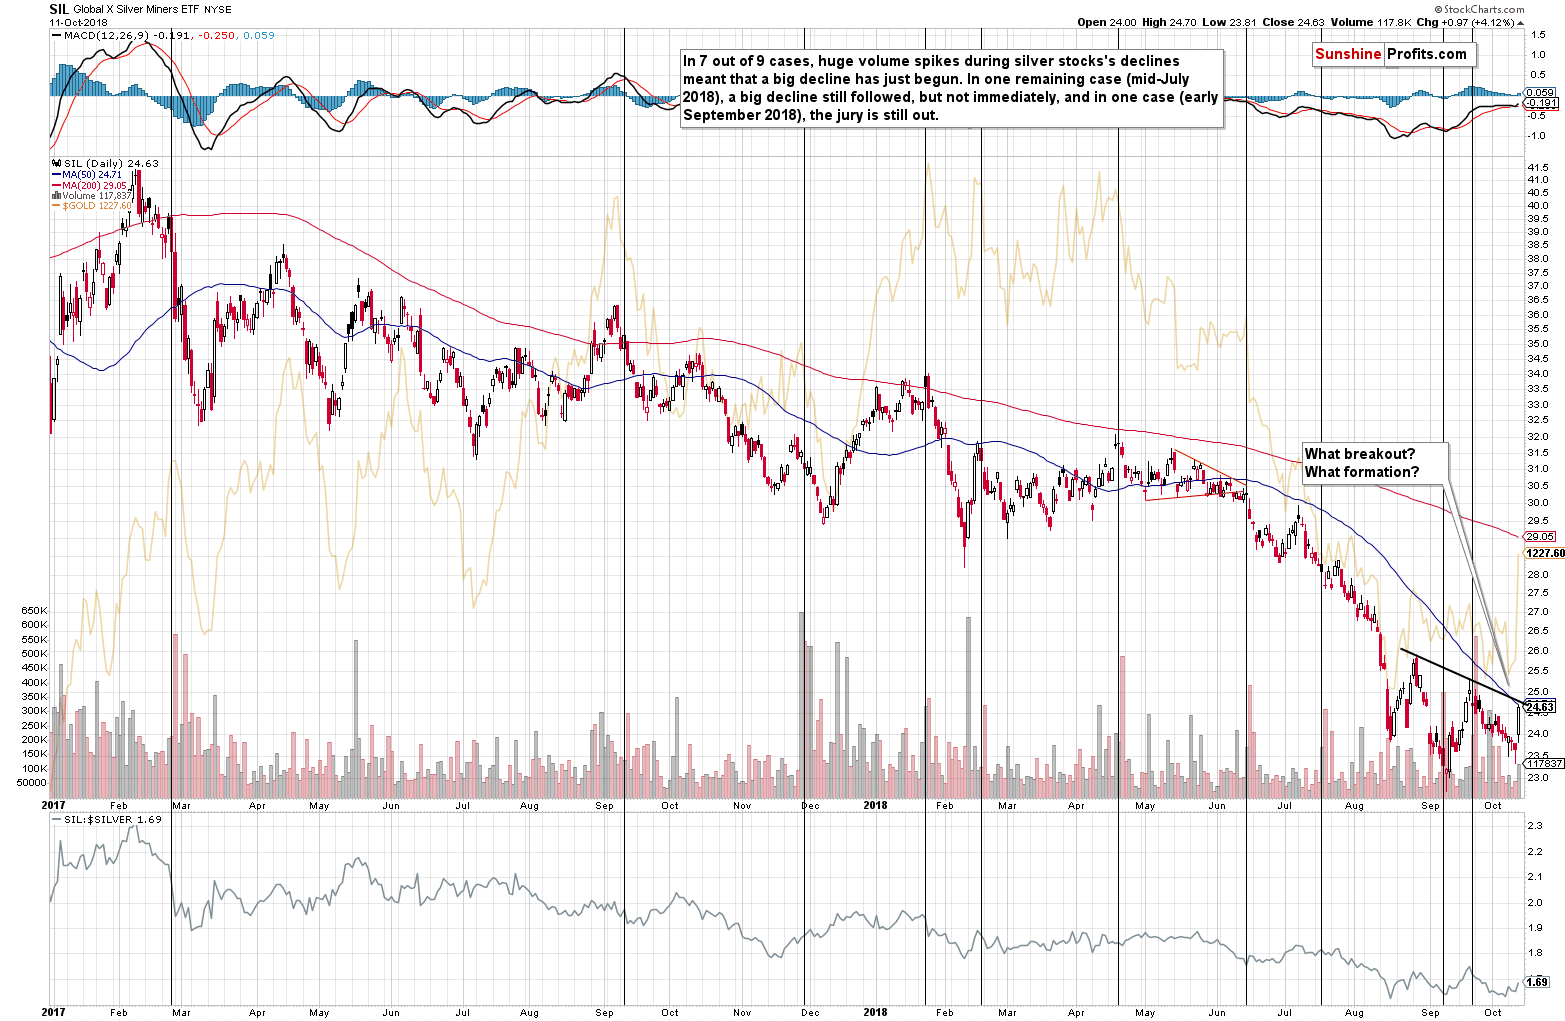
For instance, there was no breakout above the neck level of the inverse head-and-shoulders formation in case of the silver stocks. Can one trust a bullish signal from one proxy for the mining stocks if the other doesn’t confirm it? It’s no longer so certain, and what is supposed to be a clear bullish sign, is definitely not clear.
Long-term Signals
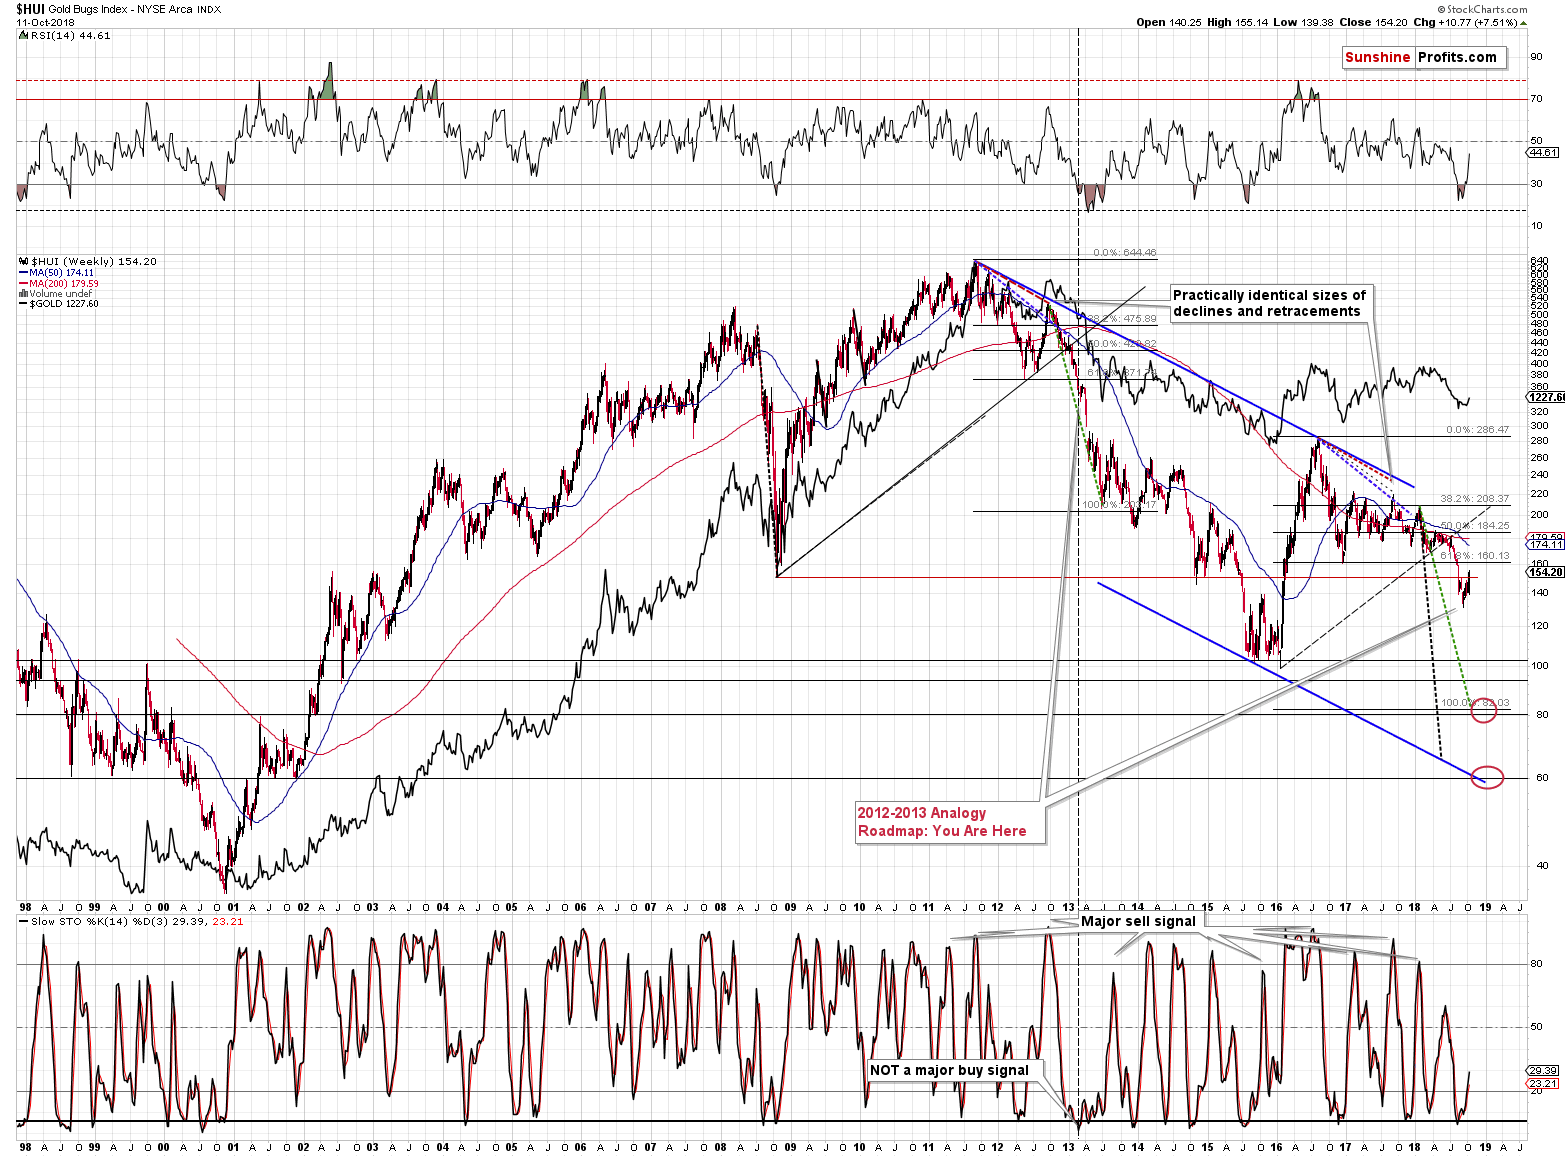
From the very long-term point of view, we see that the breakdown below the 2008 bottom was invalidated. The implications are bullish, but since the price stayed below the 2008 lows for several weeks, it’s prudent to wait at least for a weekly close before stating that anything really changed.
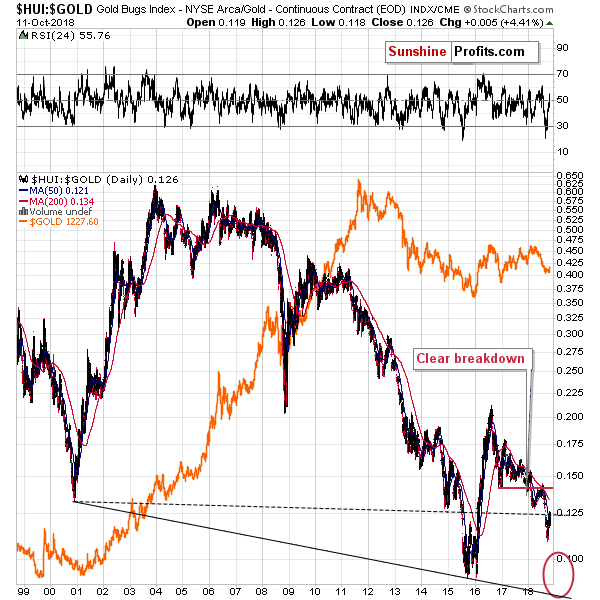
As far as the gold stocks to gold ratio nothing really changed. It’s declining and it’s after a breakdown below the critical support provided by the 2000 low. The implications remain strongly bearish.
But what about the ratio with the general stock market? It surely spiked since the S&P 500 declined while miners soared.
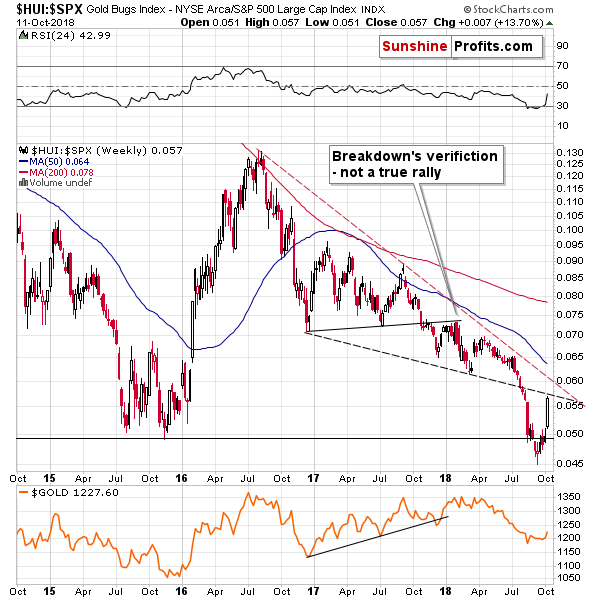
Indeed, that’s exactly what happened. The invalidation of the breakdown below the 2015 lows was already followed by a rally and the ratio has almost reached its declining medium-term resistance line.
But, even though the above chart shows this week’s candlestick as complete, let’s keep in mind that the week is not over yet and that the entire move significant in the above ratio is a matter of just two trading days.
And…
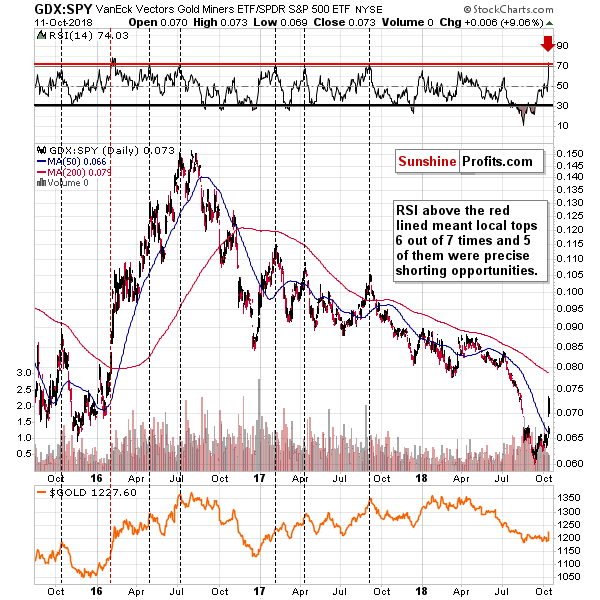
The sharpness of the ratio’s rally is actually a new sell signal. We haven’t discussed this technique for many months, as there were no signals to discuss, but we have been monitoring it daily. And yesterday we finally saw a new bearish indication. The sell signal is provided when the RSI based on the GDX to SPY ratio moves above the red line – visibly above the 70 level.
In the past 40 months or so, we saw this signal 7 times (plus, we saw it yesterday). In 5 times out of 7, that was a major sell signal and an indication that a medium-term top is in. In one case (early 2017) it was not the top, but it was a few weeks before the top and in only one case this signal was followed by visibly higher gold prices.
The thing that the above signal emphasizes is the sudden increases in the interest in the precious metals market – something that usually happens at the top. The above perfectly fits the likely reason behind yesterday’s rally – Trump’s comments. Yes, the rally took place, but its nature appears to be very temporary.
Speaking of ratios, you know what else rallied yesterday?
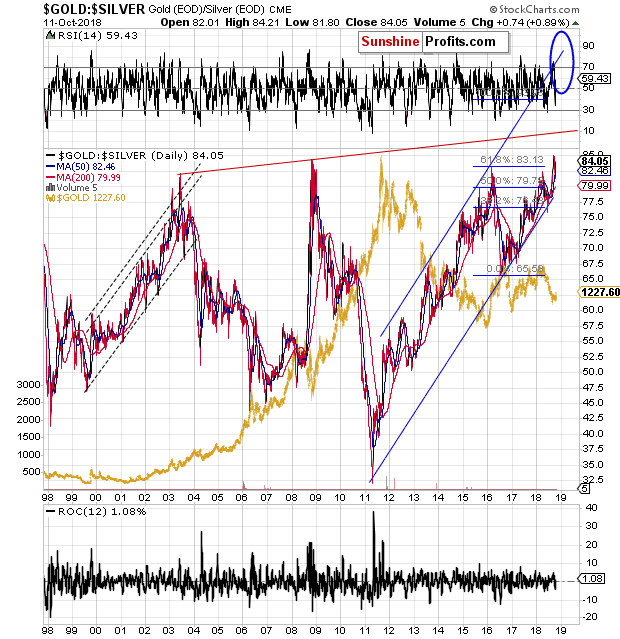
The gold to silver ratio. After correcting in the past few weeks, the ratio is now on the rise again. In general, this important ratio tends to rally when the precious metals sector is in a major downtrend. Naturally, this doesn’t mean that silver won’t outperform every now and then – it’s the trend that matters. And yesterday’s move in the ratio indicates that nothing really changed – the downtrend remains in place.
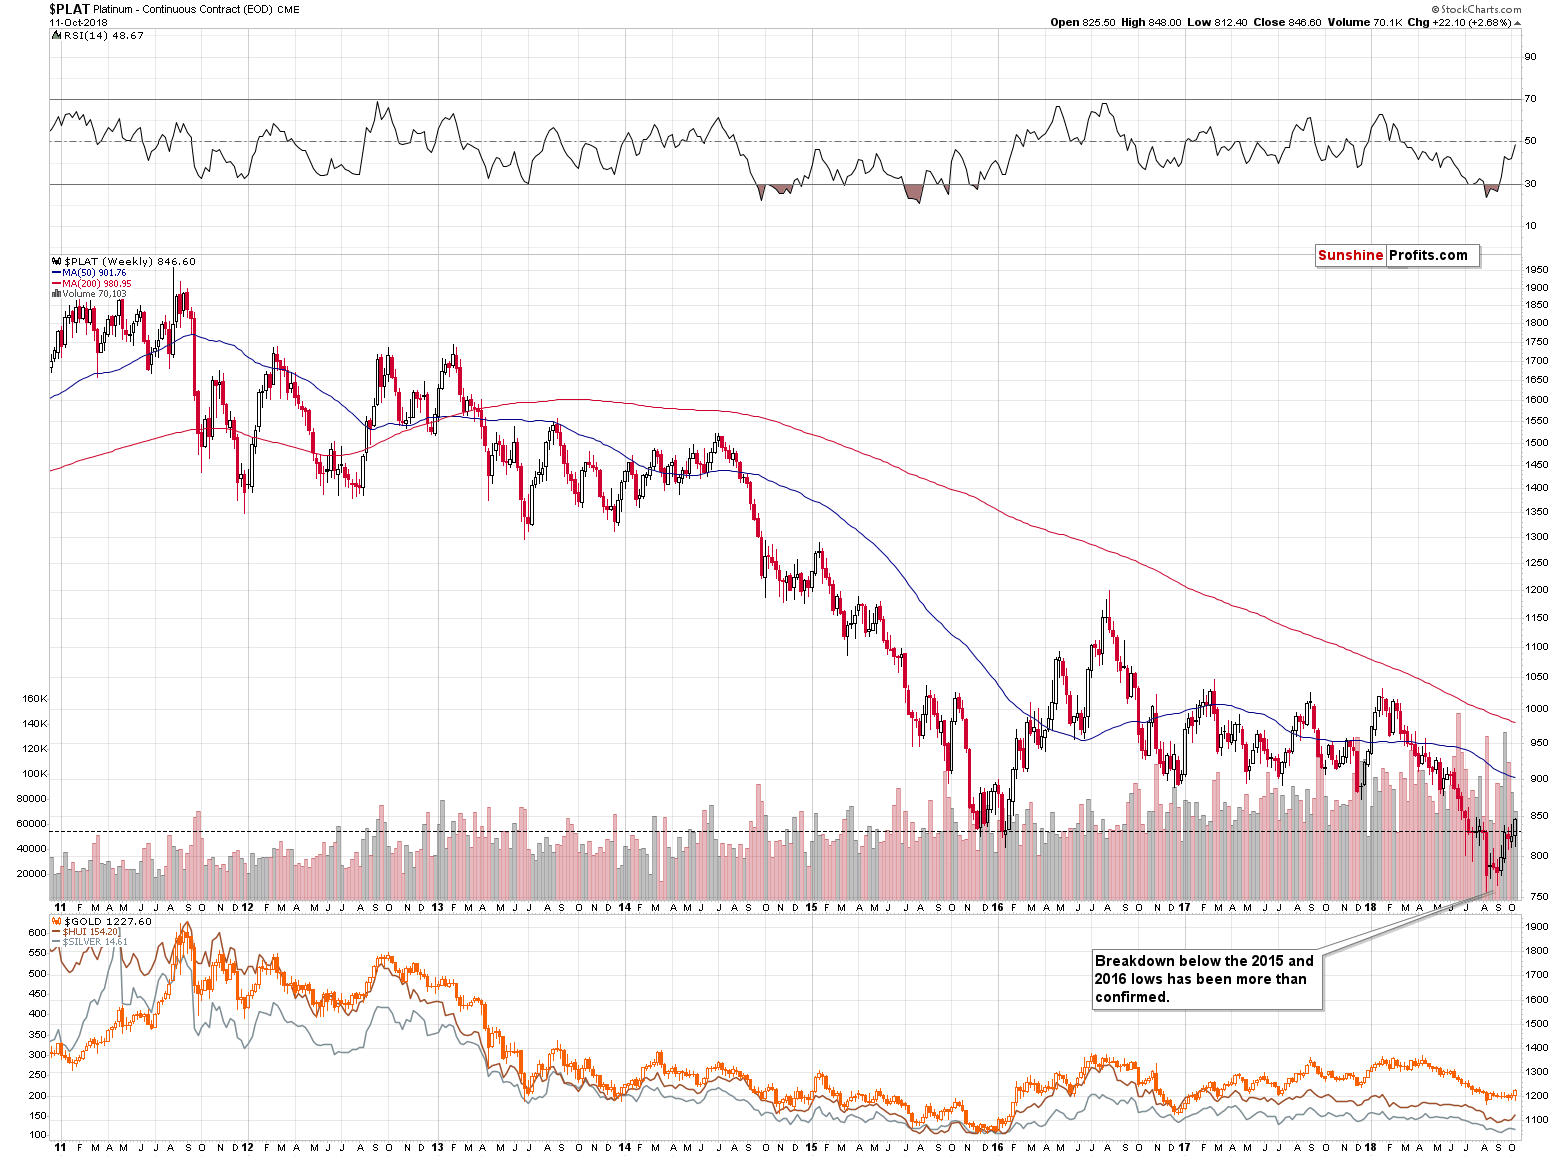
Platinum rallied as well and it’s once again above its 2016 low in terms of the weekly closing prices. All previous analogous to close the week above it were invalidated, and today is the final session of this well. So, we’ll either see an invalidation of this move – as we did in all 3 of the previous weeks – or we’ll finally see a weekly close back above the 2016 low. For now, since the week is not over yet, it seems too early to view the above as a bullish indication.
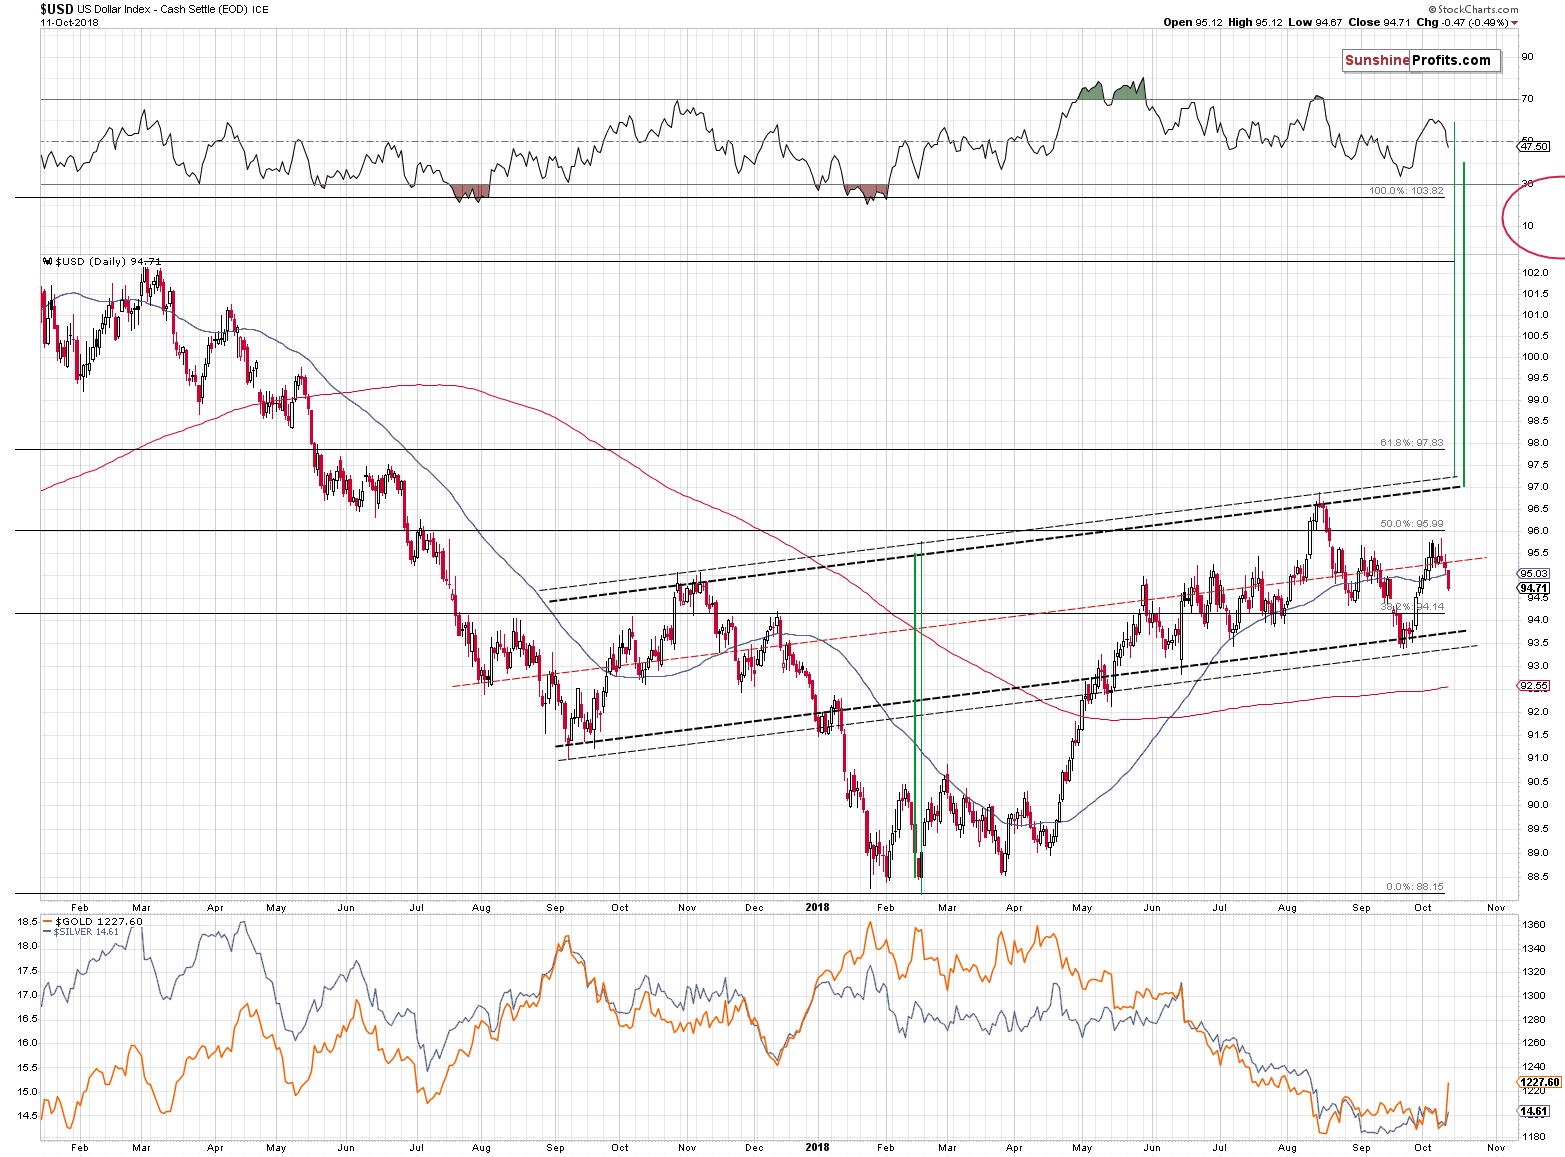
Finally, the USD Index didn’t invalidate it’s recent self-similar pattern, which means that the implications for the precious metals sector remain bearish for the following weeks.
The USD Index: It’s Just a Pause, not the end of the Rally
We described the above-mentioned pattern in the September 21st Alert:
In short, the USDX moved to one of the rising support lines and at the same time it seems to have completed a zigzag correction. Interestingly, the rally that started in the first quarter of this year is symmetrical to the decline that preceded it. The April – May 2018 rally is similar to the December 2017 decline and the same goes for the rest of the move. The October – December 2017 top took form of a head-and-shoulders pattern and it seems that we have also seen a similar pattern in the USDX (July high being the left shoulder, and the early September top being the right shoulder). And, just like the September – October 2017 zigzag started the previous correction, the August – September 2018 zigzag might be ending the current one. The implications of this specific symmetry are bullish for the USDX and bearish for the precious metals sector.
And in yesterday’s analysis, we added the following:
In case of the above analogy, we are now in the situation that reflects what happened in August 2017. It’s not clear if what we’re seeing is the reflection of the late-August correction that was very sharp, or the early August correction that was rather moderate. But since the reflective nature of this analogy is not very precise, it’s enough to say that this is a similar correction. The important takeaway here is that this is a correction within an uptrend – not a game-changer. The implications for the precious metals market remain bearish.
The USD Index moved visibly below the middle of the rising trend channel (we marked with red dashed line), which suggests that this is the volatile part of the correction. This means that the move can – and is likely to – end just as quickly as it started.
The 2013 Link
The precious metals market moved higher yesterday, while it should have moved lower or continued to do nothing. At least if the extremely accurate link to 2013 was to be upheld. But we saw a rally. So, what changed?
Technically:
Gold: from the short-term point of view, the link was invalidated and from the long-term point of view nothing really changed. Back in 2013, before the plunge, gold was in the sideways trading pattern that followed a sizable several-month-long decline. This is also what we see right now.
Silver: the white metal didn’t even move above the previous highs, so the link is just as up-to-date as it was previously. The decline doesn’t have to start in exactly the same way as it did in 2013, and the overall similarity remains in place.
Mining stocks: looking at the very long-term HUI Index chart, we see that the key factors that pointed to similarity to 2013 remain intact: the size of the retracement after the initial bottom (mid-2012, late 2016), the pace of the decline (purple line) and the sharpness of the decline that that immediately followed the breakdown below the initial low. The only thing that is different now is that the current corrective upswing is bigger. But, does it invalidate anything? The only thing that would make the current situation different, would be an invalidation of the breakdown below the initial lows (late 2016). This has not happened. Surely, it would be nice to see the 100% repeat of the 2013 decline, but seeing a repeat “just” the vast majority thereof is already remarkable and something to pay great attention to. The shapes and sizes of the corrections in the HUI didn’t have to be identical for the analogy to remain in place and for the implications to remain intact, and thus what we saw this week didn’t invalidate the key 2013-now link.
Logically:
President Trump may be the leader of the most powerful country on Earth, but his quick remarks that are not verified by actions are not even close to being enough to turn around medium-term trends. Such surprising comments can distort the short-term price movement and result in different route that the market will ultimately take while moving to its targets, but not much else is likely to happen.
The main reason to expect new lows in gold, silver and mining stocks (below the 2015 and 2016 lows) is that the precious metals investors were not scared enough at those lows. We saw the surveys and we know what people were sending in the e-mails and writing on various forums. People didn’t hate gold, and they didn’t think that the bottom is nowhere in sight. That’s what they should be thinking at the true bottom. Can Trump’s quick remarks change the above? Not at all. Consequently, the PMs are still likely to slide to new lows and since they are – quite precisely, but not extremely so – repeating the performance of 2013, the decline is likely to be very volatile. This means that waiting on the sidelines for the decline’s start might mean that one would miss it.
Comments-based Rally as a Shorting Opportunity
Besides, if yesterday’s action was indeed caused by Trump’s comments (which may not really represent his true opinion on the matter), we have a guideline from the past on how temporary the effect might be. In January 2018 Treasury Secretary Steven Mnuchin said that the U.S. would welcome a weaker dollar, which was something that anyone in his position should have never said, so that surprised the market. The USD Index declined and gold soared based on these comments. The next day, January 25th, 2018, gold formed its 2018 top in terms of the closing prices. In other words, in terms of the closing prices, higher gold prices were never seen since that time. The volume in gold was huge at that time. In fact, that was the only time from the recent past when gold’s volume was comparable to what we saw yesterday.
There are even more similarities. Gold stocks rallied above the previous highs just like they did yesterday. It all looked very bullish at the first sight and it generated a lot of feedback and questions. We received numerous questions recently as well, so the situation is similar also from this point of view.
The emotions were high in late January 2018 and they are high now. But, it’s our job to stick to the facts and logic and analyze the emotionality instead of being influenced by it. In the January 25th, 2018 regular Gold & Silver Trading Alert we wrote about 50% of the regular short position in gold, silver, and mining stocks, and in the intraday follow-up we increased this position to 150%. It was indeed an excellent time to enter, not exit a short position. And the same appears to be the case today. Surely, we may have temporarily (in the next several hours or so) higher prices, but the odds are that this is a shorting opportunity in disguise.
What’s Next and How to React?
Based on gold’s short-term (unconfirmed, but still) breakout and the outperformance in mining stocks we might see temporarily higher prices after which the big decline is likely to start anyway. It may start with a daily pause, or without it. It may start on any given day, even starting in the final hour of the session, erasing the daily gains and then declining much more. Or it could happen overnight.
We might also have a situation in which gold invalidates its breakdown and gold stocks also reverse their action shortly. Perhaps in an hour or a few hours or on Monday. This scenario is supported by multiple long-term factors and several short-term ones as well. The way gold reacted after previous “crazy comments” in early 2018 indicate that the top is in or at hand. Gold stocks’ performance relative to other stocks confirms it.
It seems that we are in a situation where the upside is quite limited while the downside is enormous. Day-traders may want to close their positions (if they already didn’t) and re-enter them if gold moves higher (or lower), but we will focus on the trade that we’ve been taking advantage of in the past months and instead of taking our profits off the table, we will keep the positions intact. Because of the outlook and only because of the outlook and our strategy for this trade. As far as the latter in concerned, we explained quite a few times that this is likely to be a major decline, even bigger than what we’ve seen so far this year and this remains to be the case. In crude oil, for instance, we took partial profits from our short positions today because on that market we don’t have as many confirmations pointing to lower prices in the following weeks.
All positions remain strongly profitable despite yesterday’s move higher, but this has no impact on the decision on whether to keep a position, close or open. If we didn’t have any positions right now, we’d open short positions based on the outlook.
We are also moving the stop-loss levels even higher. The stop-loss is the price level at which we want to be automatically taken out of the market, because reaching this price level alone (regardless of other factors) changes the outlook. We don’t want to be thrown out of the market even if gold moves a dollar or two above the upper border of its flag pattern (based on the intraday prices) and we don’t want to be thrown out of the market if the HUI Index moves higher, but not visibly above the late 2016 low. The change in the stop-loss levels reflects the above – it’s not a sign that the outlook is becoming any less bearish.
Important Analyses
Before summarizing, we would like to emphasize that we have recently posted several analyses that are very important and that one should keep in mind, especially in the next several weeks. If you haven’t had the chance of reading them previously, we encourage you to do so today:
- Dear Gold Investor - Letters from 2013 - Analogy to 2013, which should make it easier to trade the upcoming sizable upswing (if enough factors point to it, that is) and to enter the market close to the final bottom.
- Gold to Soar Above $6,000 - discussion of gold’s long-term upside target of $6,000.
- Preparing for THE Bottom in Gold: Part 6 – What to Buy - extremely important analysis of the portfolio structure for the next huge, multi-year rally in the precious metals.
- Preparing for THE Bottom in Gold: Part 7 – Buy-and-hold on Steroids - description of a strategy dedicated to significantly boosting one’s long-term investment returns while staying invested in the PM sector.
- Gold’s Downside Target, Upcoming Rebound, and Miners’ Buy Plan - details regarding the shape of the following price moves, a buying plan for mining stocks, and a brief discussion of the final price targets for the current decline.
- Gold: What Happened vs. What Changed - discussion of the latest extreme readings from gold’s CoT report
- Key Factors for Gold & Silver Investors - discussion of key, long-term factors that support the bearish outlook for PMs. We are often asked what makes us so bearish – this article is a reply to this question.
- The Upcoming Silver Surprise - two sets of price targets for gold, silver and mining stocks: the initial and the final one.
- Precious Metals Sector: It’s 2013 All Over Again - comparison between 2013 and 2018 throughout the precious metals sector, the general stock market and the USD Index. Multiple similarities point to the repeat of a 2013-style volatile decline in the PMs.
- Changing One's Mind - Why, When, and How – discussing the way of analyzing the market that helps to stay focused on the growing one’s capital while not being influenced by the loss aversion bias.
Summary
Summing up, the comments-based rally is not likely to change the key medium-term trend and thus the outlook remains strongly bearish. In late January 2018, somewhat similar comments resulted in gold forming the yearly top and an excellent shorting opportunity. It seems that we may be seeing something very similar right now. All in all, it seems that the huge profits on our short positions will soon become enormous, even if it takes a few more days before that happens.
As always, we’ll keep you – our subscribers – informed.
To summarize:
Trading capital (supplementary part of the portfolio; our opinion): Full short positions (250% of the full position) in gold, silver and mining stocks are justified from the risk/reward perspective with the following stop-loss orders and exit profit-take price levels:
- Gold: profit-take exit price: $1,062; stop-loss: $1,253; initial target price for the DGLD ETN: $82.96; stop-loss for the DGLD ETN $49.47
- Silver: profit-take exit price: $12.72; stop-loss: $15.76; initial target price for the DSLV ETN: $46.97; stop-loss for the DSLV ETN $27.37
- Mining stocks (price levels for the GDX ETF): profit-take exit price: $13.12; stop-loss: $20.83; initial target price for the DUST ETF: $80.97; stop-loss for the DUST ETF $27.67
Note: the above is a specific preparation for a possible sudden price drop, it does not reflect the most likely outcome. You will find a more detailed explanation in our August 1 Alert. In case one wants to bet on junior mining stocks’ prices (we do not suggest doing so – we think senior mining stocks are more predictable in the case of short-term trades – if one wants to do it anyway, we provide the details), here are the stop-loss details and target prices:
- GDXJ ETF: profit-take exit price: $17.52; stop-loss: $31.23
- JDST ETF: initial target price: $154.97 stop-loss: $51.78
Long-term capital (core part of the portfolio; our opinion): No positions (in other words: cash)
Insurance capital (core part of the portfolio; our opinion): Full position
Important Details for New Subscribers
Whether you already subscribed or not, we encourage you to find out how to make the most of our alerts and read our replies to the most common alert-and-gold-trading-related-questions.
Please note that the in the trading section we describe the situation for the day that the alert is posted. In other words, it we are writing about a speculative position, it means that it is up-to-date on the day it was posted. We are also featuring the initial target prices, so that you can decide whether keeping a position on a given day is something that is in tune with your approach (some moves are too small for medium-term traders and some might appear too big for day-traders).
Plus, you might want to read why our stop-loss orders are usually relatively far from the current price.
Please note that a full position doesn’t mean using all of the capital for a given trade. You will find details on our thoughts on gold portfolio structuring in the Key Insights section on our website.
As a reminder – “initial target price” means exactly that – an “initial” one, it’s not a price level at which we suggest closing positions. If this becomes the case (like it did in the previous trade) we will refer to these levels as levels of exit orders (exactly as we’ve done previously). Stop-loss levels, however, are naturally not “initial”, but something that, in our opinion, might be entered as an order.
Since it is impossible to synchronize target prices and stop-loss levels for all the ETFs and ETNs with the main markets that we provide these levels for (gold, silver and mining stocks – the GDX ETF), the stop-loss levels and target prices for other ETNs and ETF (among other: UGLD, DGLD, USLV, DSLV, NUGT, DUST, JNUG, JDST) are provided as supplementary, and not as “final”. This means that if a stop-loss or a target level is reached for any of the “additional instruments” (DGLD for instance), but not for the “main instrument” (gold in this case), we will view positions in both gold and DGLD as still open and the stop-loss for DGLD would have to be moved lower. On the other hand, if gold moves to a stop-loss level but DGLD doesn’t, then we will view both positions (in gold and DGLD) as closed. In other words, since it’s not possible to be 100% certain that each related instrument moves to a given level when the underlying instrument does, we can’t provide levels that would be binding. The levels that we do provide are our best estimate of the levels that will correspond to the levels in the underlying assets, but it will be the underlying assets that one will need to focus on regarding the signs pointing to closing a given position or keeping it open. We might adjust the levels in the “additional instruments” without adjusting the levels in the “main instruments”, which will simply mean that we have improved our estimation of these levels, not that we changed our outlook on the markets. We are already working on a tool that would update these levels on a daily basis for the most popular ETFs, ETNs and individual mining stocks.
Our preferred ways to invest in and to trade gold along with the reasoning can be found in the how to buy gold section. Additionally, our preferred ETFs and ETNs can be found in our Gold & Silver ETF Ranking.
As a reminder, Gold & Silver Trading Alerts are posted before or on each trading day (we usually post them before the opening bell, but we don't promise doing that each day). If there's anything urgent, we will send you an additional small alert before posting the main one.
=====
Latest Free Trading Alerts:
We know, it’s just a symbol. But it’s a powerful symbol of the most severe recession since the Great Depression. Yup, it’s another article about the Lehman Brothers’ collapse. But we really invite you to read it, as we thoroughly analyze the impact on that bankruptcy on the price of the yellow metal. You will also find out what can we learn from the 2008 banking crisis for the gold market.
Gold Ten Years after Lehman Brothers
=====
Thank you.
Sincerely,
Przemyslaw Radomski, CFA
Founder, Editor-in-chief, Gold & Silver Fund Manager
Gold & Silver Trading Alerts
Forex Trading Alerts
Oil Investment Updates
Oil Trading Alerts

