

Briefly: in our opinion, full (300% of the regular position size) speculative short positions in mining stocks are justified from the risk/reward point of view at the moment of publishing this Alert.
Welcome to this week's flagship Gold & Silver Trading Alert. As we’ve promised you previously, in our flagship Alerts, we will be providing you with much comprehensive and complex analyses (approximately once per week), which will usually take place on Monday.
Predicated on last week’s price moves, our most recently featured outlook remains the same as the price moves align with our expectations. On that account, there are parts of the previous analysis that didn’t change at all in the earlier days, which will be written in italics.
Before discussing the technical point of view, we’d like to say a few words about gold’s safe-haven appeal given the latest fundamental news.
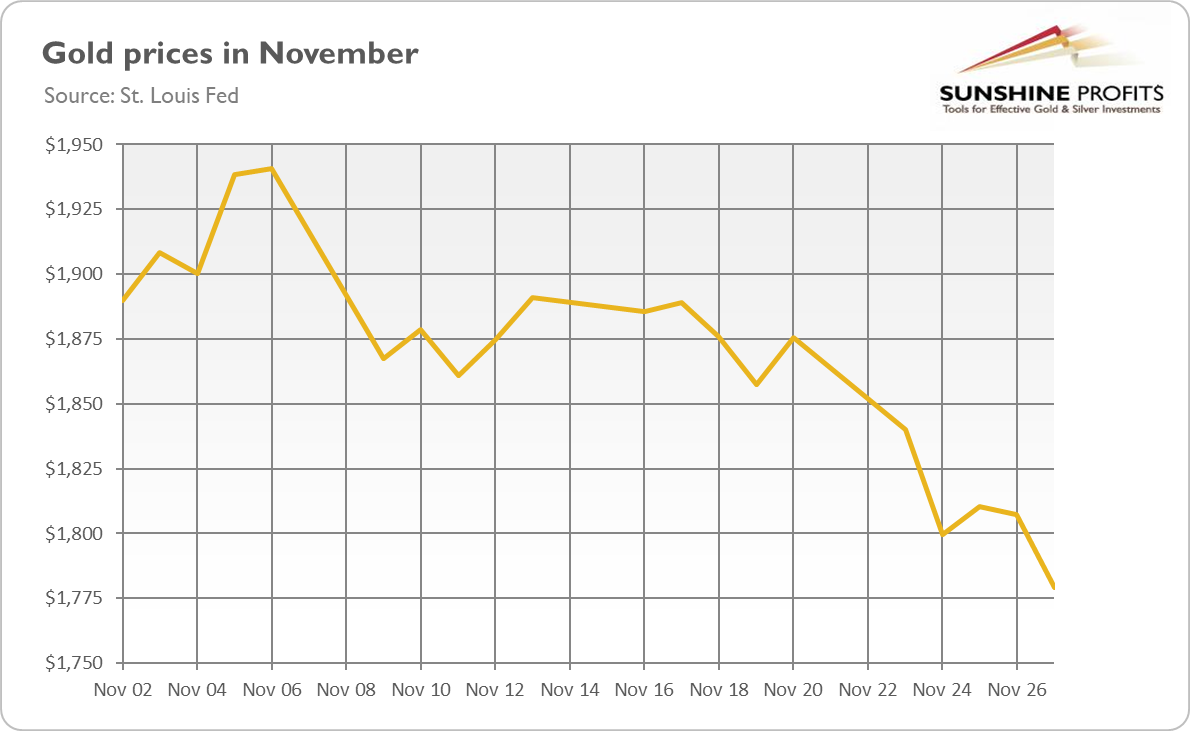
November doesn’t look like a good month for gold. The declines in the precious metals market continued last week. As the chart below shows, the price of the yellow metal dropped to $1,779 on Friday (November 27).
What is going on? Well, it seems that investors have switched into a risk-on state of mind, which sent the safe-haven assets such as gold substantially lower. You see, a lot of important things happened or are happening: a few vaccines are coming to the market, the formal transition of power from the current administration to President-elect Joe Biden has begun, and Biden picked Janet Yellen as his Treasury Secretary. All of this news reduced a substantial part of the uncertainty and has been welcomed by investors. They are convinced that the economy will find itself on the road to normality. The market participants have breathed a sigh of relief, reassured that the worst scenarios – of unconstrained pandemic, contested election, or an inexperienced, radical progressive responsible for U.S. financial matters – will not materialize.
Indeed, Wall Street can be happy. Yellen, the monetary dove, will work closely with the Fed (after all, Powell was on the Board of Governors under Yellen) to design whatever response necessary to sustain the asset price bubb… sorry, to stimulate the economy!
As a consequence of a stronger risk appetite and more optimistic economic outlook, investors started to price an interest rate hike in 2023. The more hawkish expectations have exerted downward pressure on gold prices.
But what about the more distant future of gold? Well, neither the vaccines, nor a Biden-Yellen duo will cure all of the U.S. economy’s problems over the long run. Actually, America will have to face a big health crisis in the very short term. The second wave of infections is already affecting the economy negatively. For example, personal income decreased 0.7 percent in October, followed by a 0.7 percent gain in September. And the number of initial claims have been rising again in November (albeit rather mildly so far).
The vaccines may take us into a new normality, but not to a unicorn fantasy land. Perhaps you don’t remember, but the pre-pandemic normality wasn’t wonderful, the pace of economic growth was not impressive, and indebtedness levels were already high. At present, economic growth is not going to accelerate substantially. The debt – both corporate and public debt – is considerably more substantial than before the pandemic. The real interest rates are lower, while the risk of inflation runs higher.
The return of normality could actually be positive for gold prices in the long run. Why? Because once the epidemic is over, a lot of people will want to travel, buy larger houses, and spend, spend, and spend some more! The pent-up demand, combined with some cracks in the supply chains, and increased broad money supply, could lead to the acceleration in inflation and thus, stronger demand for gold as an inflation hedge.
All these factors suggest that the price of gold should not return to a lower pre-epidemic level. After all, the world will come out of the pandemic with much higher debt levels and some lasting scars. Actually, the price of the yellow metal can continue its upward march in the medium or long run, however, it seems that gold requires a trigger to overcome its current weakness and move further north. That trigger can come in the form of the next U.S. stimulus package, some turmoil in the corporate debt markets, or the next dovish change in the Fed’s stance that could be announced in December. The reason might also be technical – gold could decline so much that the decline burns itself out as everyone who wants to sell will do so and the price – given the extremely bad sentiment - will be able to go in only one direction – up.
All in all, there are multiple fundamental reasons why gold is likely to soar in the upcoming years. However, even the most profound bull markets can’t move up in a straight line, and some corrections will likely take place. After the big rallies, we will probably witness significant corrections, and in the case of the precious metals market, one is long overdue.
Much like in March, it seems that the evident economic decline might trigger a sell-off.
At this point, we would like to quote what we wrote about the aspects of the virus scare and how the market reacts to them. In short, gold (and other markets) reacted when people started to strongly consider the pandemic's economic implications, a topic that was ubiquitous in the media.
Undoubtedly, the most important factor for gold will be the economic implications of the second Covid-19 wave. How do we know that? Because we compared what people were searching for (online) with how the gold prices were shaped. There's a lot more data available on https://searchingcovid19.com/, but we'll focus on the chart that shows us exactly when people were getting interested in each aspect of the pandemic, and we'll compare that to gold.
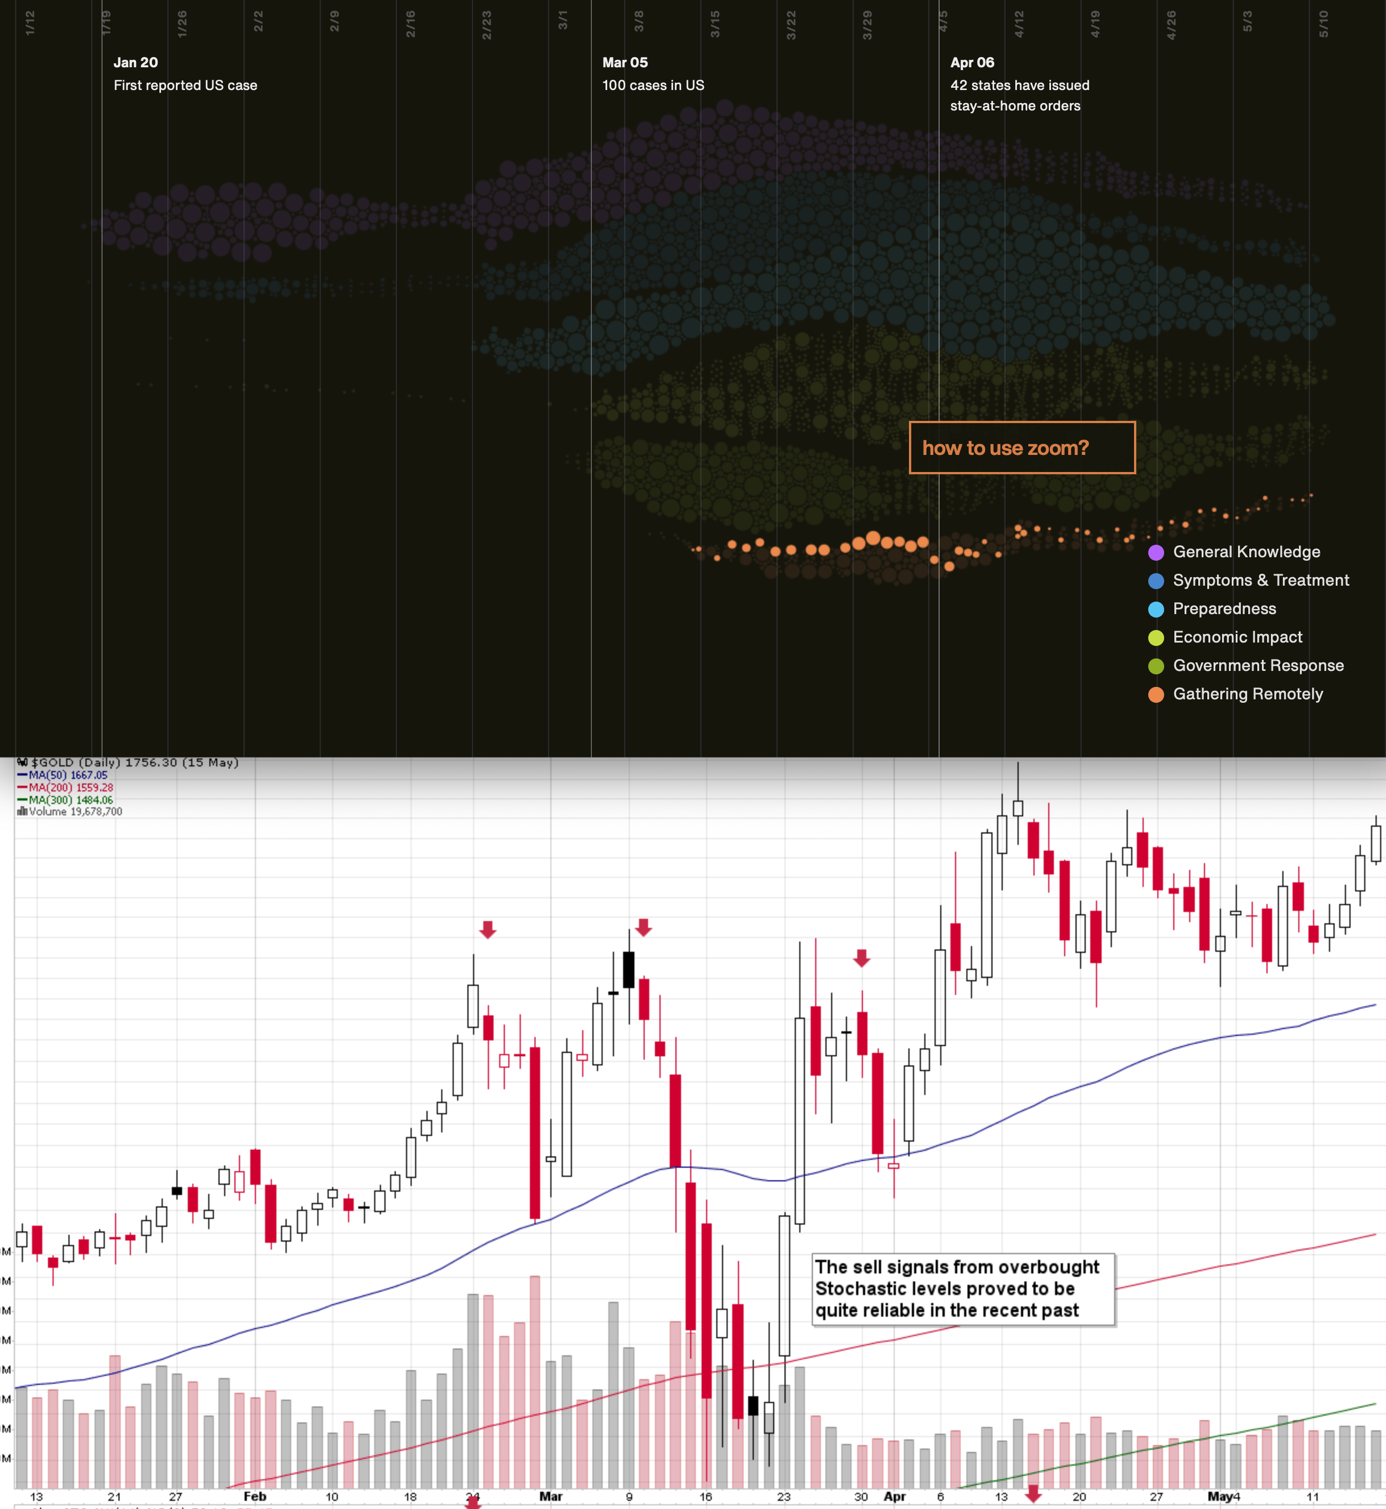
We aligned both charts with regard to time. The chart on the bottom is from Stockcharts.com and it features gold's continuous futures contract. The gold price (and the USD Index value) really started to move once people got particularly interested in the economic impact of the pandemic and in the government's response.
In the recent days (and weeks) the news is dominated by other issues. Once people start considering the economic implications of the second wave of this coronavirus, the prices would be likely to move.
The news coming from the Fed is positive for gold in the long run, but in the short term, they continue to indicate risk for the economy. This risk is likely to translate into lower stock values and initially gold is likely to slide given the above - just like it did in March.
All in all, gold is likely to rally far in the long run, but in the short run it’s vulnerable to a sizable decline, when the economic implications of the pandemic’s continuation become obvious to investors.
Stocks and the Dollar Weigh In
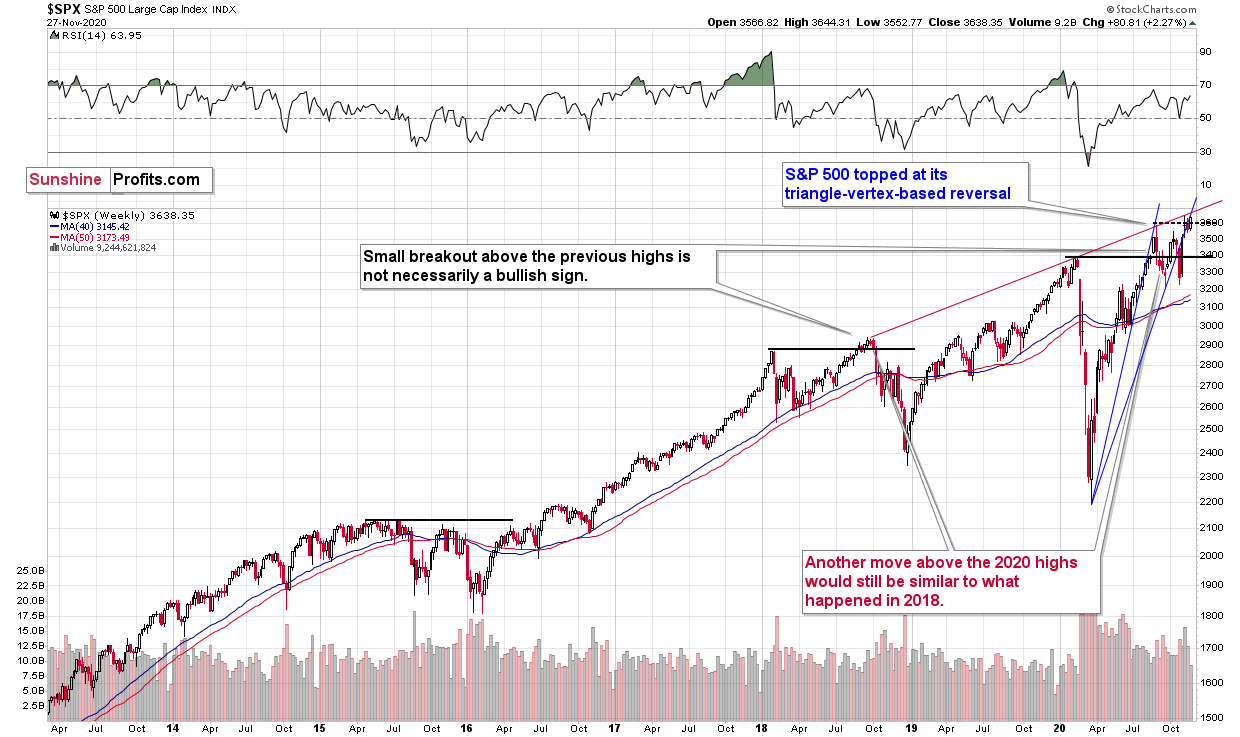
Stocks are testing their previous highs. Will this test be successful? Growing Covid-19 cases and an increasing number of hospitalizations suggest that this will not be the case.
Please note that back in 2018 stocks moved above their previous high before sliding. The fact that they moved above their previous highs is therefore not as bullish as it first appears.
Moreover, please note that back in early September, stocks topped at the vertex of the triangle created by the rising red and blue lines. The blue line is based on the 2020 bottom and the June bottom. The analogous line, based on the 2020 bottom and the September bottom also creates a triangle with the rising red line, and this triangle has a vertex practically right about now.
Since we’re speaking about stocks, I would like to let you know that starting today, our Stock Trading Alerts have a new author – my fellow CFA Charterholder from Canada, Matthew Levy, CFA. Matthew has extensive experience with the stock market, and you can read more about him in his bio over here. In short, Matthew sees a short-term pullback as something that’s definitely possible, but you’ll be able to read his stock market analysis in its entirety, because for the entire week, we are providing free access to Matthew’s Stock Trading Alerts to all Gold & Silver Trading Alert subscribers (if you don’t do anything with it, the access to Stock Trading Alerts won’t renew, so it’s 100% free, no strings attached – we just want to you have an easy way to see what Matthew’s services look like). You can read today's Stock Trading Alert using this link.
So, you can expect to see a notification email with a link to today’s Stock Trading Alerts later today, and you can expect these notifications to continue for the rest of the week.
Ending this digression, I would like to state that even though we might see a decline in stocks relatively soon, a decline in stocks is not required for the PMs to decline.
After all, back in 2016, stocks rallied right after the U.S. presidential elections, while PMs declined.
Keeping the analogy to the U.S. presidential election years in mind, please note that gold tends to decline in these years shortly after (or before) Thanksgiving.
Gold’s Performance around Thanksgiving
Thanksgiving is on the fourth Thursday of each November, which means that the holiday always falls between November 22and 28. What’s usually happening to the price of gold before and after this period? Let’s check gold’s seasonality for Q4.
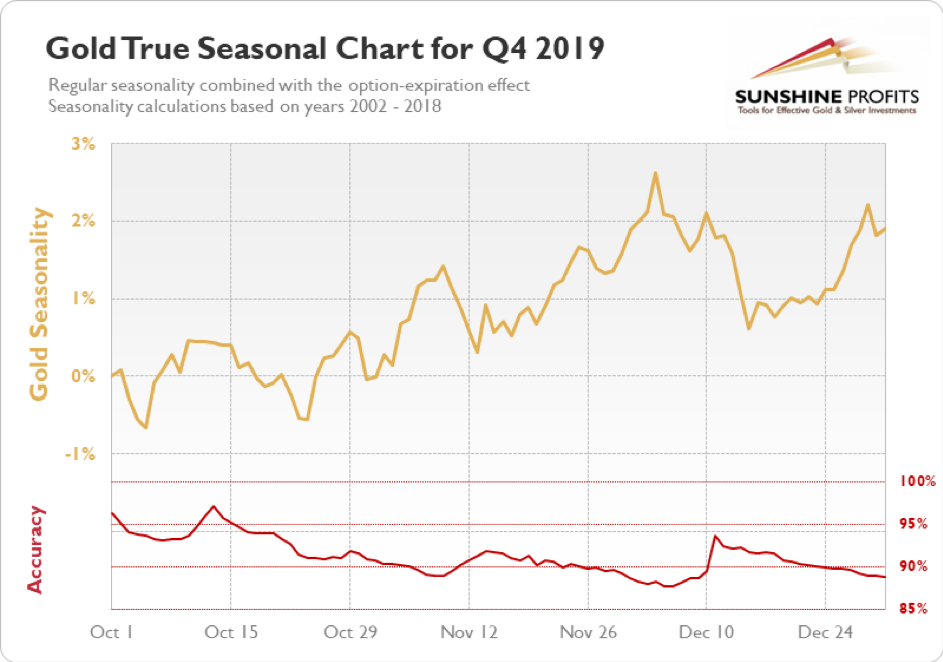
During this period, gold is usually just before forming a short-term top and starting the biggest decline within the final quarter of the year.
Please note that the accuracy measure as to when the top is likely to be is relatively low, but soars right before gold’s plunge. This means that while it’s not that clear when gold is likely to top, it’s quite probable that we are going to see some kind of important top regardless of when exactly that takes place. Could it be slightly ahead of Thanksgiving? Yes. Could it be slightly after it? That’s possible as well.
But this year is not like other years, and I don’t mean the pandemic. This year, particularly this November, is special because of the U.S. presidential elections. Therefore, instead of taking into account the average of the previous periods around all recent Thanksgivings, one should focus on the Thanksgivings which were concurrent with presidential elections.
Gold and Thanksgiving during the Presidential Election Years
Let’s examine the last four cases, when gold was already after the 1999-2000 bottom and within its secular bull market.
Starting with the most recent case:
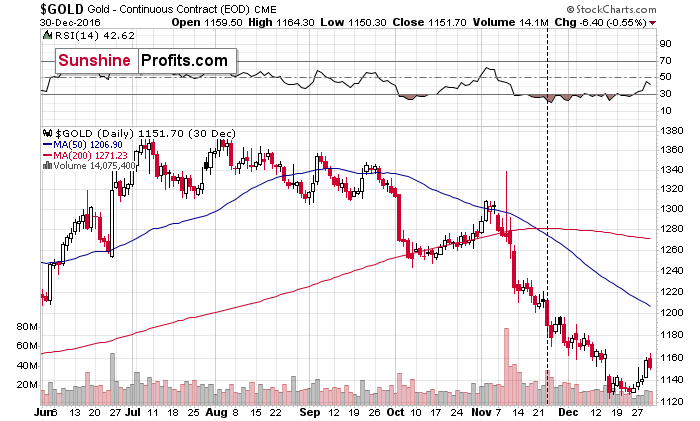
Back in 2016, the decline simply continued after Thanksgiving, and gold bottomed in the second half of December.
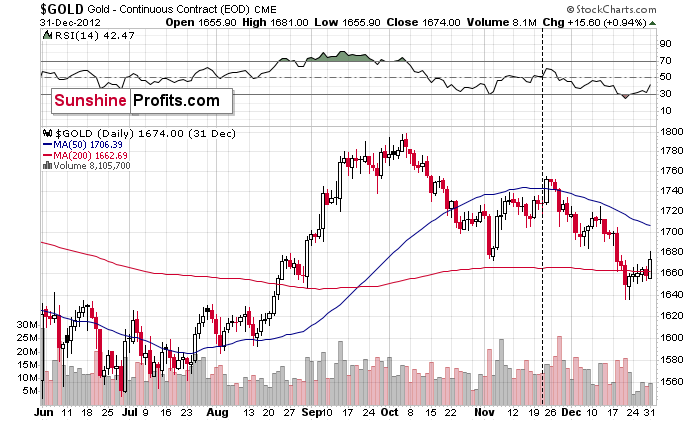
Four years earlier, in 2012, gold topped right after Thanksgiving and – just like in 2016 – it bottomed in the second half of December.
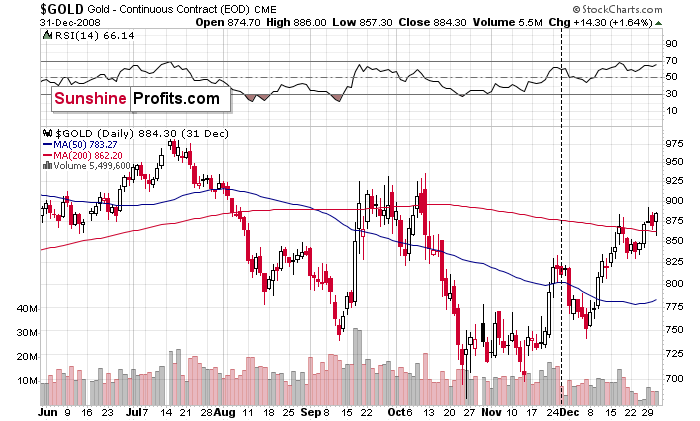
In 2008, gold topped right before Thanksgiving and it bottomed in the first half of December.
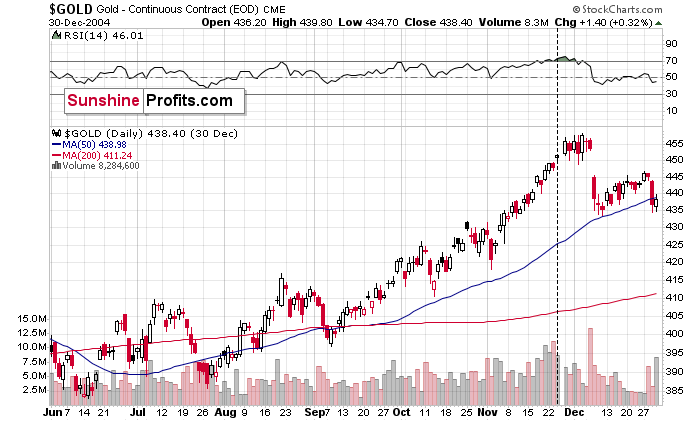
Finally, in 2004, gold topped shortly after Thanksgiving, and it formed an initial bottom in the first half of December. However, it then declined once again, further reaching bottom in January and February 2005 (two separate bottoms).
Consequently, Thanksgiving during the U.S. presidential election year had a bearish follow-up for gold in practically all four cases. Sometimes it was a bit early and at other times a bit late, but overall, it seems that one should be prepared for declines in the yellow metal during the final days of November and early part of December.
This pattern fits in line with my other thoughts on the gold market. As the USD Index appears to have ended forming its broad bottom pattern, it’s likely to rally, causing gold to slide. At some point gold is likely to stop responding to the dollar’s bearish indications, and based on the above analysis, we expect this might take place in December.
Moreover, let’s keep in mind that the situation continues to be excessive on the forex market.
The recent plunge was dramatic, and the USD Index even managed to invalidate its previous short-term breakout. This was bearish, but there are more powerful bullish forces that remain intact, so the above didn’t change the outlook.
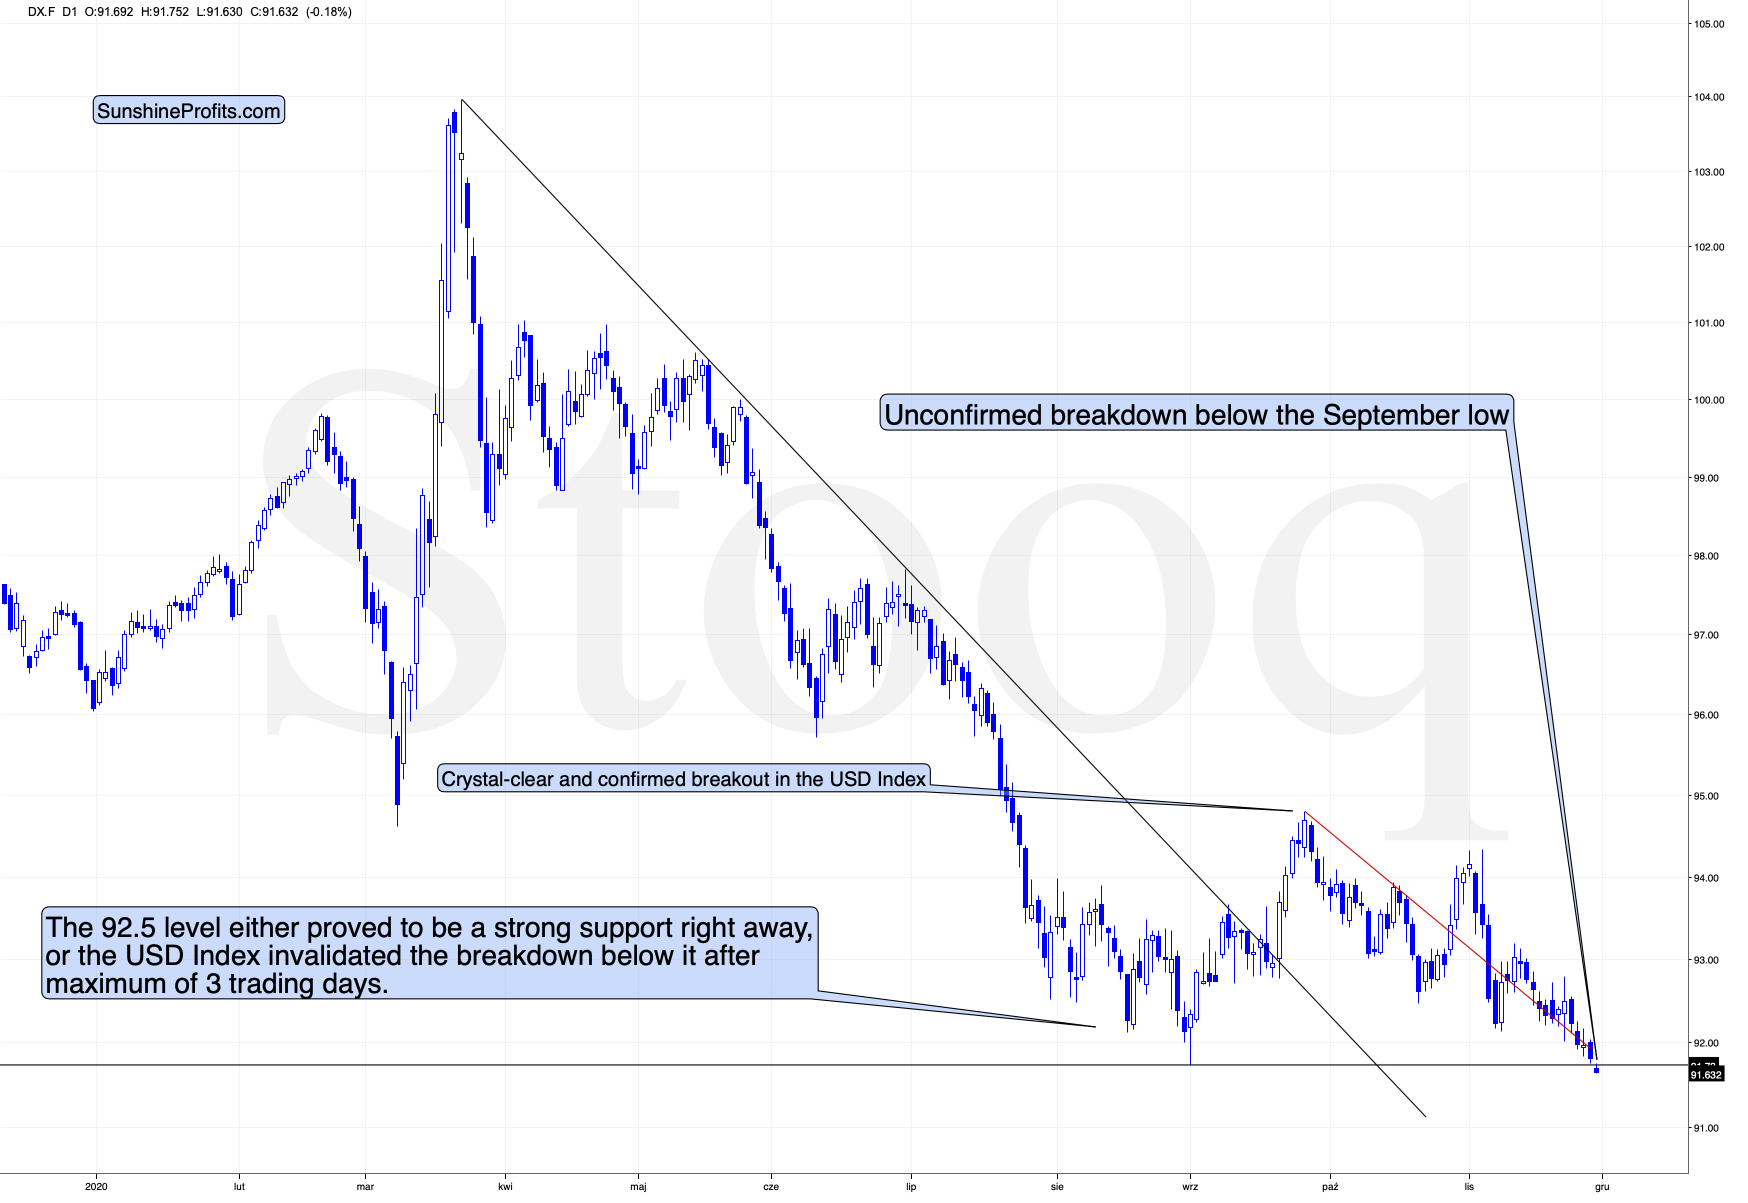
At the moment of writing these words, the U.S. currency is testing its previous lows. It’s slightly below the previous intraday low and this tiny breakdown is definitely not confirmed.
Given the Thanksgiving seasonality, it’s doubtful that there are any bearish implications at all.
Speaking of cyclicality, please note that the U.S. Dollar Index tends to reverse its course at the turn of the month. That happened early in the months of January, February, May, July, August, September, and November – thus occurring in over half of the year. Today is the last day of November and given the above regularities, it seems that the USD’s breakdown will be invalidated shortly.
Besides, that’s not even the most important detail from the precious metals investors’ point of view.
The most important detail is that all these bearish moves in the USDX failed to trigger any decent rallies in gold, which shows that the latter simply doesn’t want to rally from here.
Moreover, short-term indications are one thing, but it’s important to remember that they are not as important as medium or long-term ones…and speaking of the latter – let’s zoom out.
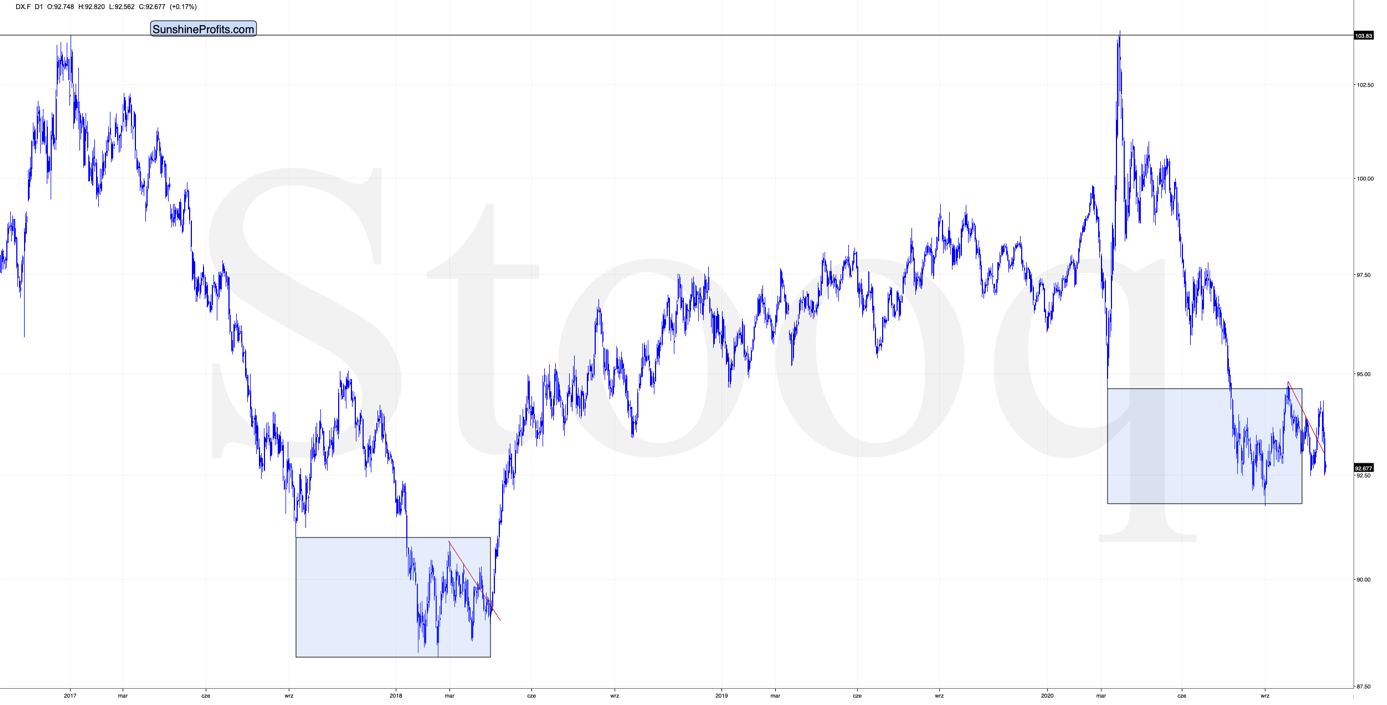
Please note that the shape of the current broad bottom is almost identical to what we saw in early 2018. The rectangles on the above chart are 100% identical. The left rectangle is based on the September 2017 low, the 2018 low, and final low of the broad bottom. Copying this rectangle and attaching it to the March 2020 bottom provides us with an almost 100% precise downside target for the recent low. The follow-up highs (March 2018 and September 2020) are very closely aligned as well.
Moreover, in both cases, the initial bottom was not the final one, but the final one followed shortly. We then saw (again, in both cases), a relatively sharp rally that failed and then another low that was not as low as the previous bottom. Then there was yet another fake rally (and a fake breakout above the declining red resistance line). This breakout was then invalidated and what followed was THE final bottom in the USD Index.
Oh, and both declines started from the same level (about 103.8).
Yes, the situation is as ridiculously similar as I described above. But wait, there’s more!
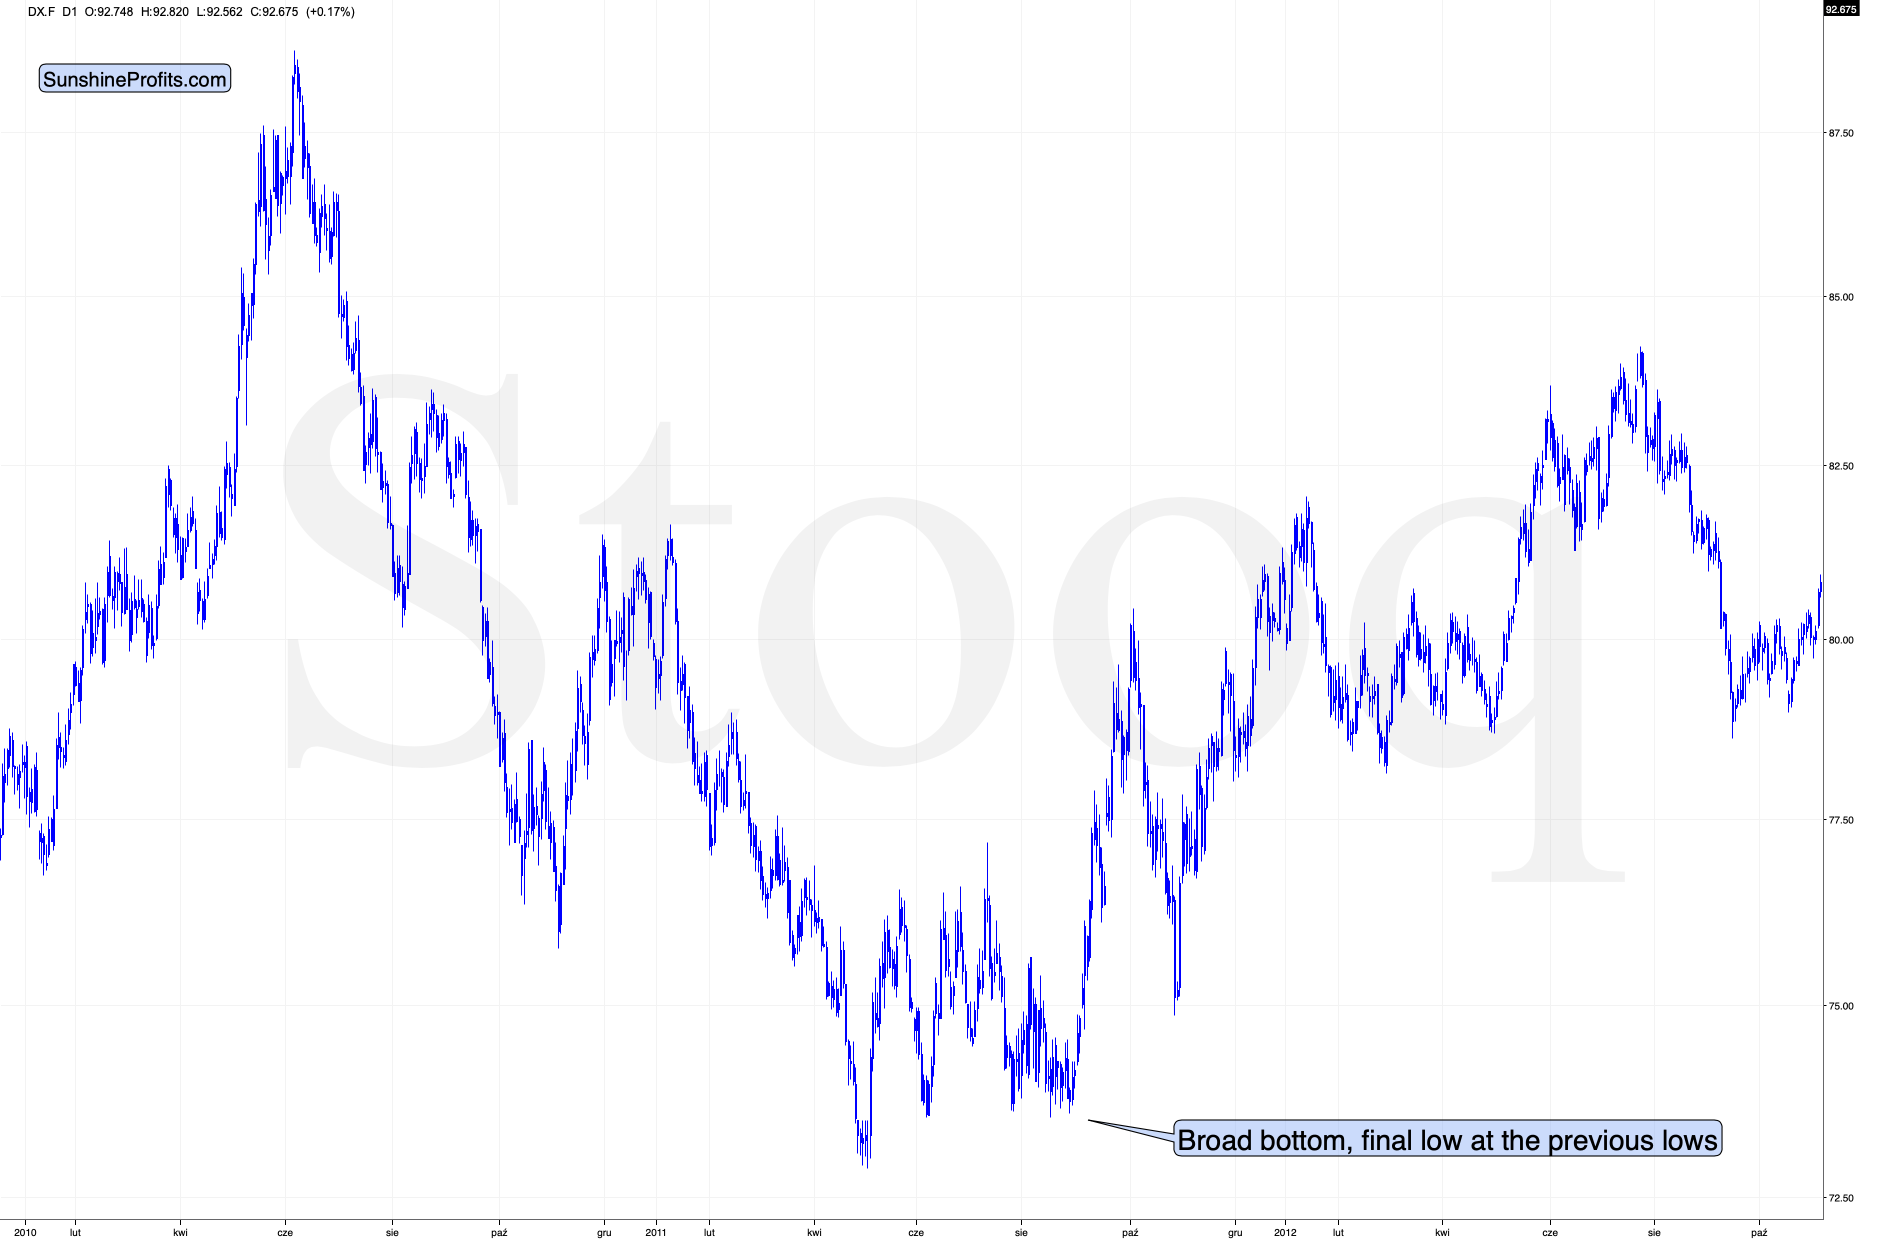
The bottoming pattern in 2011 is also very similar to what we see right now and what we saw earlier this year. The final bottom even took place at the previous lows – just like what we saw yesterday. This analogy is particularly important because August 2011 is when gold formed its multi-year high.
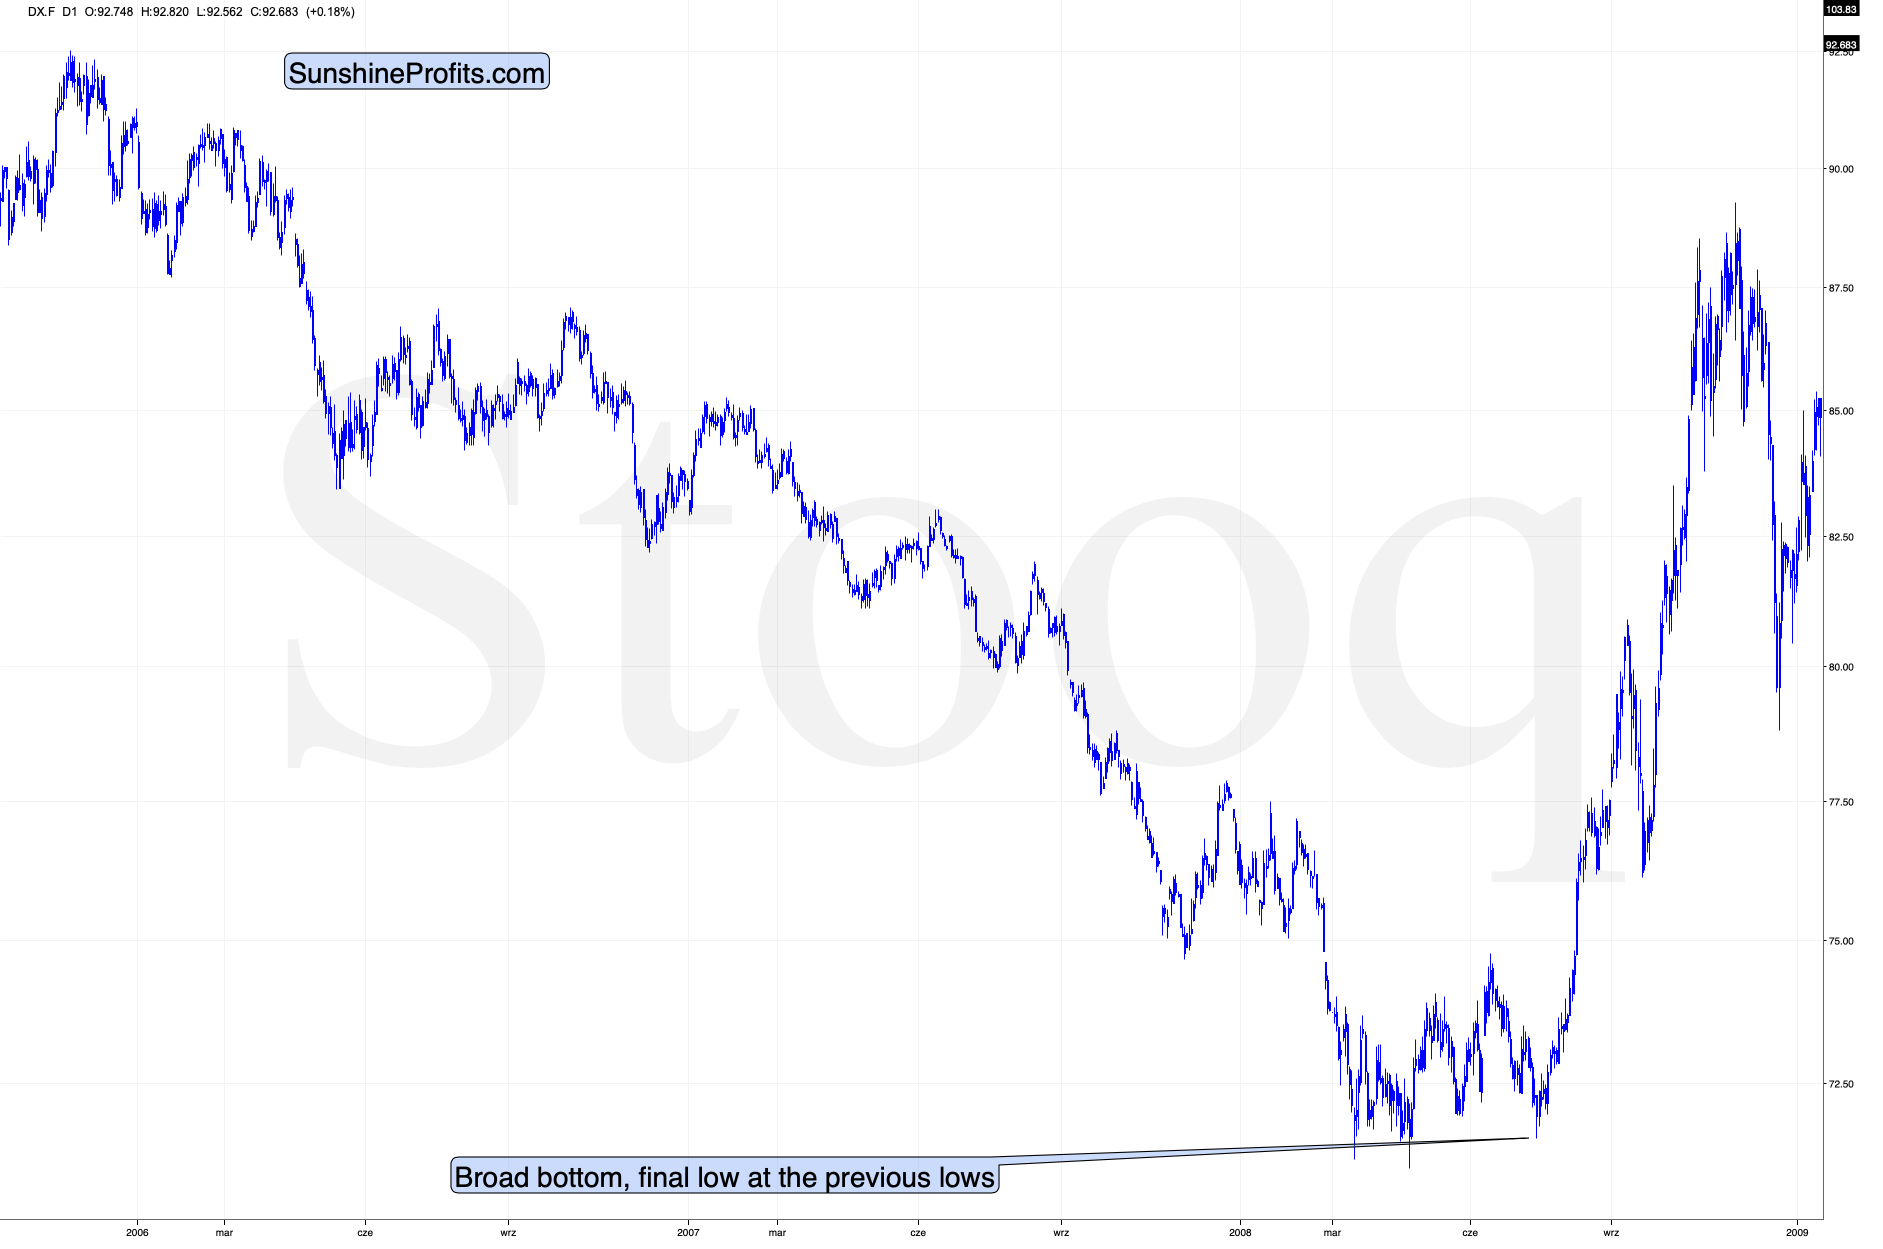
Back in 2008, the USD Index bottomed in a very similar manner. And yes, the final bottom formed close to the previous lows – once again just like what we saw this week.
So, does the invalidation of the short-term breakout in the USD Index really make the outlook bearish right now? In light of the above powerful analogies to the past major bottoms – absolutely not.
And as the USD Index soars, gold is likely to slide.
Additionally, let’s keep in mind that the short-term strength in the USD Index is likely to translate into an invalidation of the small breakdown below the rising support line that we see on USDX’s long-term chart.
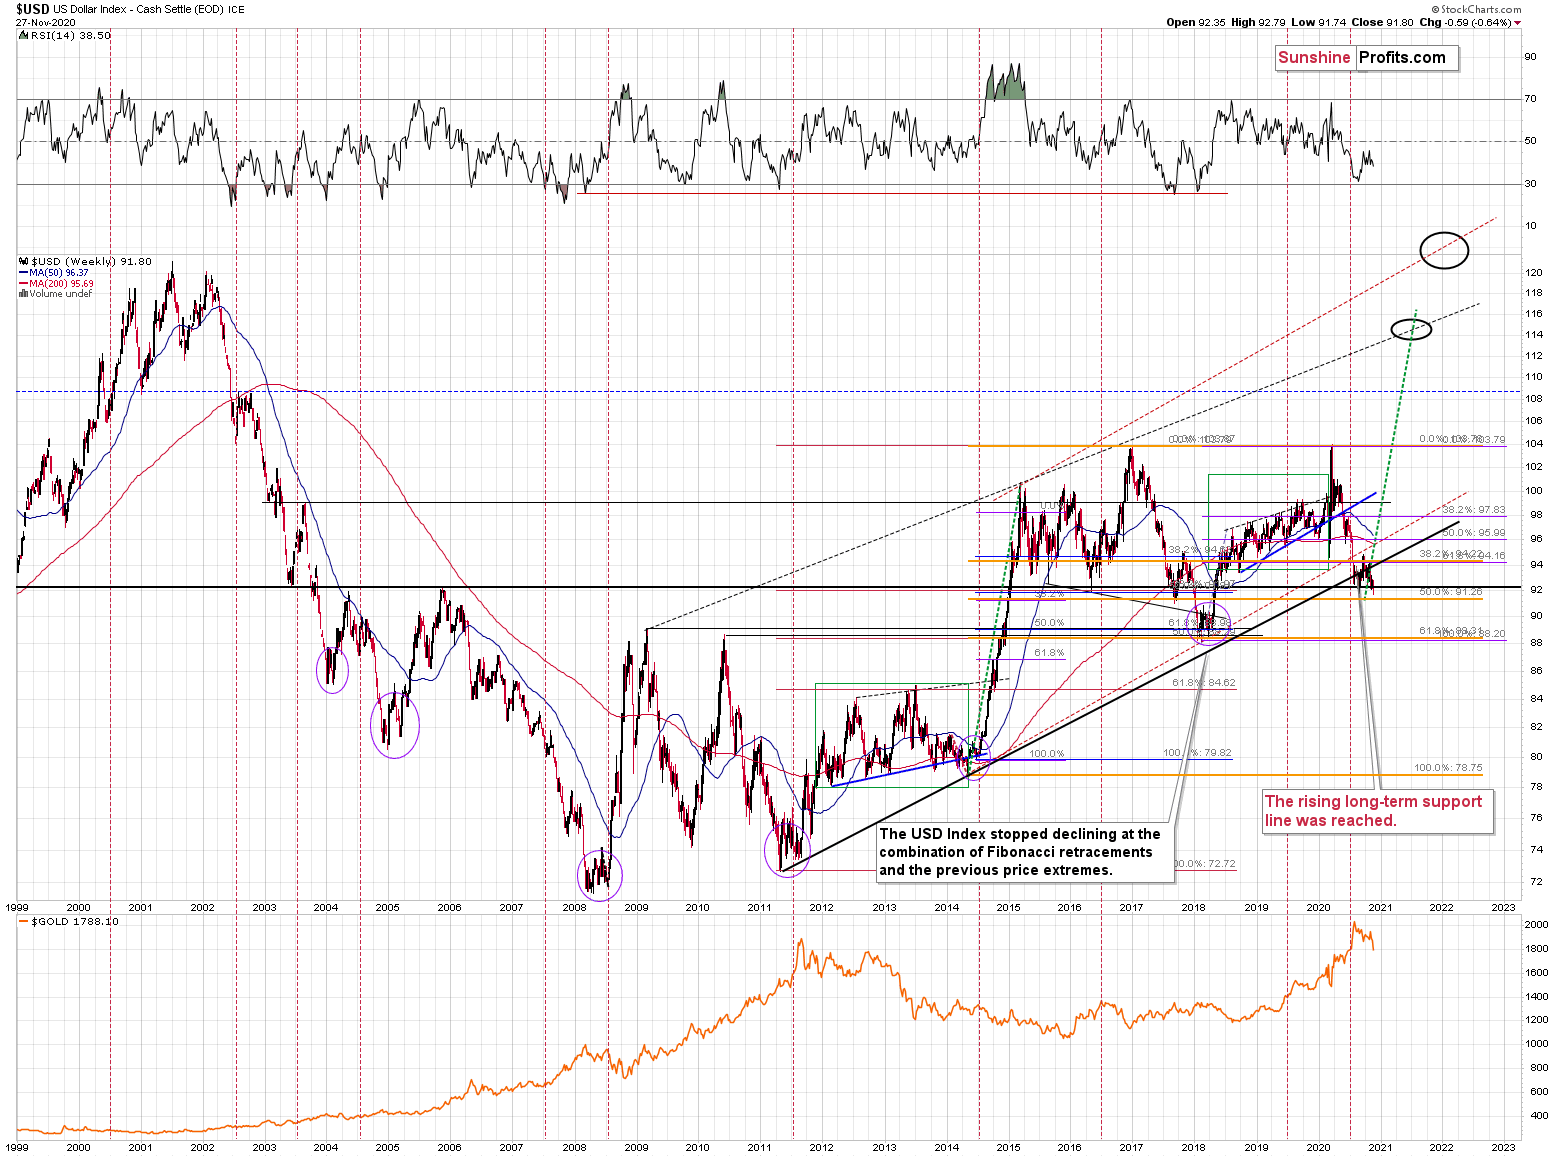
My previous comments on that matter remain up-to-date (with the slight change that at the moment USDX is a bit below the support line, but let’s keep in mind that similar small breakdowns were invalidated shortly).
Remember when in early 2018 we wrote that the USD Index was bottoming due to a very powerful combination of support levels? Practically nobody wanted to read that as everyone “knew” that the USD Index is going to fall below 80. We were notified that people were hating on us in some blog comments for disclosing our opinion - that the USD Index was bottoming, and gold was topping. People were very unhappy with us writing that day after day, even though the USD Index refused to soar, and gold was not declining.
Well, it’s exactly the same right now.
The USD Index was at a powerful combination of support levels. One of them is the rising, long-term, black support line based on the 2011 and 2014 bottoms. The other major support level and a long-term factor is the proximity to the 92 level – that’s when gold topped in 2004, 2005, and where it – approximately – bottomed in 2015, and 2016.
The USDX just moved to these profound support levels, broke slightly below them, and now it has clearly invalidated this breakdown. For many weeks, we’ve been warning about the likely USD Index rally, and we finally saw it.
Quoting my previous comments:
USD Index moved briefly below the long-term, black support line and then it invalidated this breakdown before the end of the week. This is a very bullish indication for the next few weeks.
Before moving to the short-term chart, please note that the major bottoms in the USD Index that formed in the middle of the previous years, often took form of broad bottoms.
Consequently, the current back and forth trading is not that surprising. This includes the 2008, 2011, and 2018 bottoms.
A crucial aspect is that the rally that we’ve witnessed so far is just the tip of the bullish iceberg. The breakdown below the key support levels was invalidated, which is a strong bullish indicator. Since it happened on a long-term chart and the temporarily broken lines were critical, the implications are incredibly important as well– and they should be visible from the long-term perspective.
So, how high could the USD Index rally now? At least to the 100 level (approximately). This way, the upcoming rally would almost match the rally that started after the previous major invalidation – the 2018 one.
Still, we wouldn’t rule out a scenario in which the USD Index rallies above its 2020 highs before another major top. After all, the USD Index is after a very long-term breakout that was already verified several times.
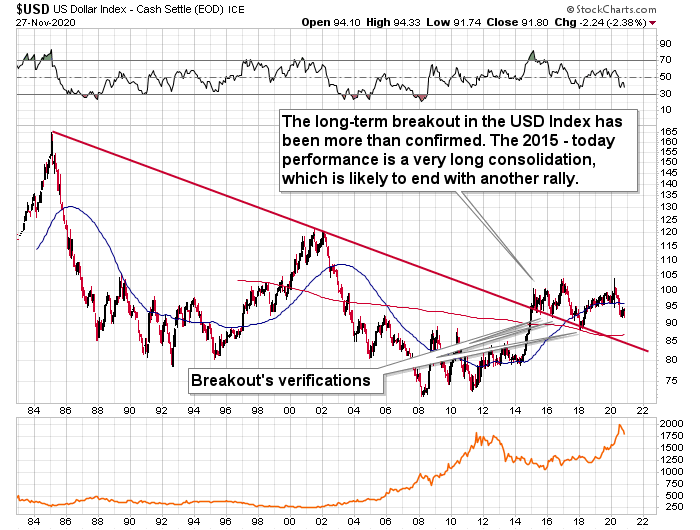
Taking into account USDX’s lengthy breakout, its several breakout verifications, and the 5-year consolidation, it seems that the USD Index is ready to rally much higher – perhaps to approximately to the 120 level.
Please note that the consolidation that preceded the previous rally to 120 that took place between 1997 and 2000 happened when the USD index was trading at relatively similar price levels – approximately between 90 and 105.
The additional bullish factor is the excessive bearishness present on the futures market.
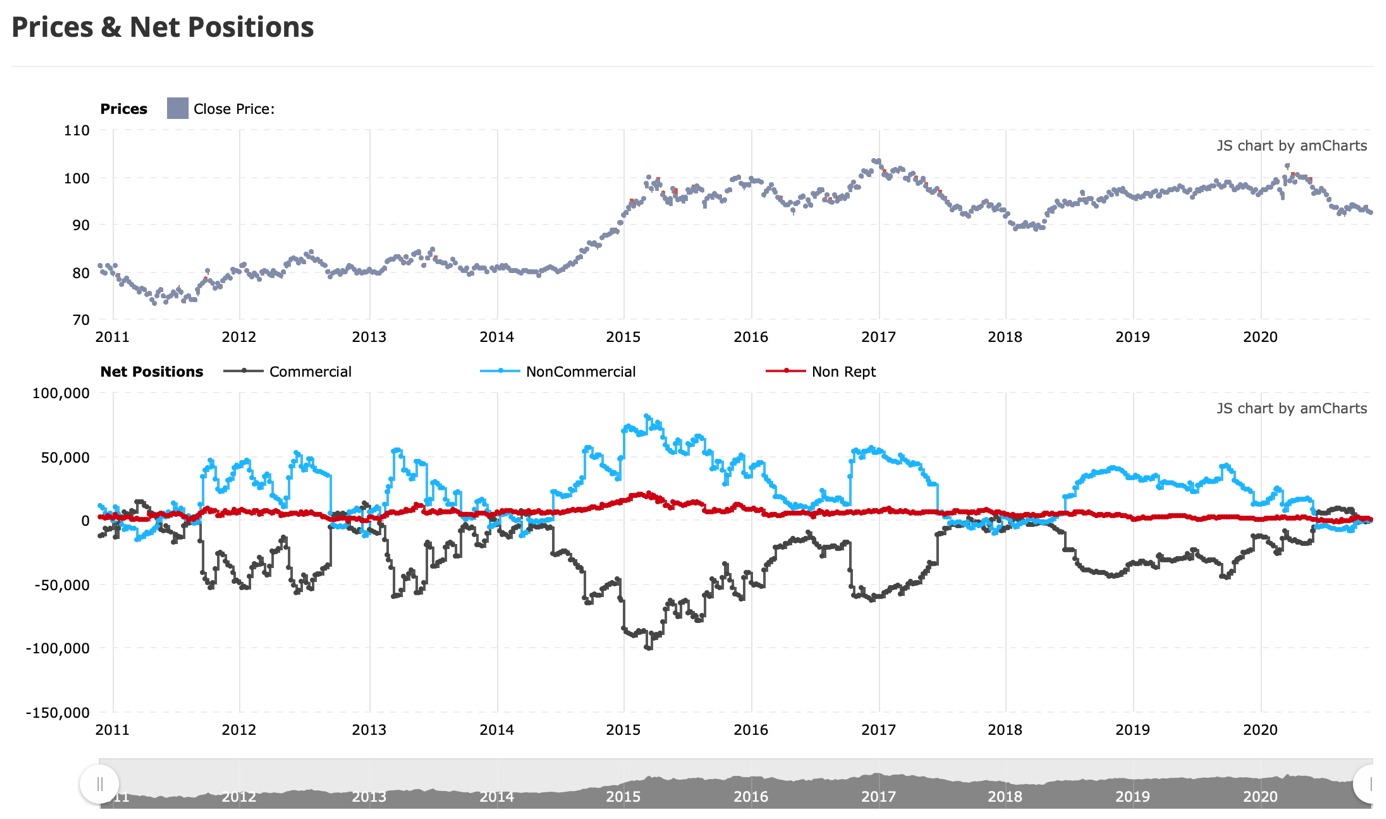
The above chart shows the netted version of the positions included in the Commitment of Traders report. Please note how the lows in the blue line correspond to major medium-term bottoms in the USD Index. We once again find ourselves in this situation.
On the fundamental front, please keep in mind that for the currency markets it’s not important how “things are going in the U.S.”, but how they are doing relative to the rest of the world, and most importantly, relative to the Eurozone and Japan (currency exchange rates against the euro and the yen have the biggest weights in the USD Index, which is ultimately a weighted average of currency exchange rates). Are things about to get much worse in the U.S. compared to them? No. In risking oversimplification, let’s say that while things are bad pretty much all around the world, they might actually get calmer in the U.S. as the post-presidential election turmoil subsides.
Overall, as the outlook remains bullish for the USD Index, it remains bearish for the precious metals sector. This is particularly the case if we take into account that recently, the Gold Miners Bullish Percent Index ($BPGDM) showed the highest possible overbought reading.
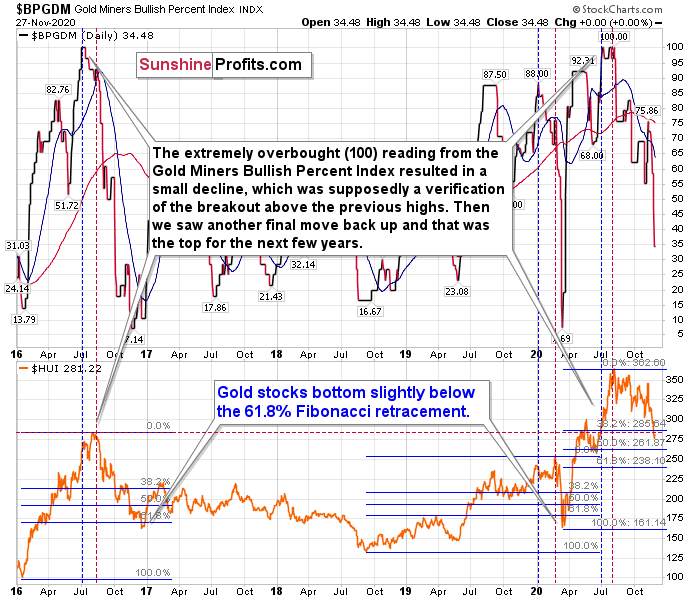
The excessive bullishness was present at the 2016 top as well and it didn’t cause the situation to be any less bearish in reality. All markets periodically get ahead of themselves regardless of how bullish the long-term outlook really is. Then, they correct. If the upswing was significant, the correction is also quite often significant.
Please note that back in 2016, there was an additional quick upswing before the slide and this additional upswing had caused the $BPGDM to move up once again for a few days. It then declined once again. We saw something similar also in the middle of this year. In this case, the move up took the index once again to the 100 level, while in 2016 this wasn’t the case. But still, the similarity remains present.
Back in 2016, when we saw this phenomenon, it was already after the top, and right before the big decline.
Based on the decline from above 350 to below 280, we know that a significant decline is definitely taking place. But has it already run its course?
Let’s consider two similar cases when gold miners declined significantly after the $BPGDMwas very high: the 2016 decline and early-2020 decline.
In both cases, the HUI Index continued to decline until it moved slightly below its 61.8% Fibonacci retracement level. This means that if the history is to repeat itself, we shouldn’t expect any major turnaround until the gold miners decline to 220 - 230 or so. Depending on how things are developing in gold, the above might or might not be the final bottom, though.
Please note that the HUI already declined below its 2016 high. This breakdown is yet another bearish sign.
Please note that back in 2016 (after the top), and in March 2020, the buying opportunity didn’t present itself until the $BPGDMwas below 10. Currently, it’s above 30, so it seems that miners are likely to move even lower.
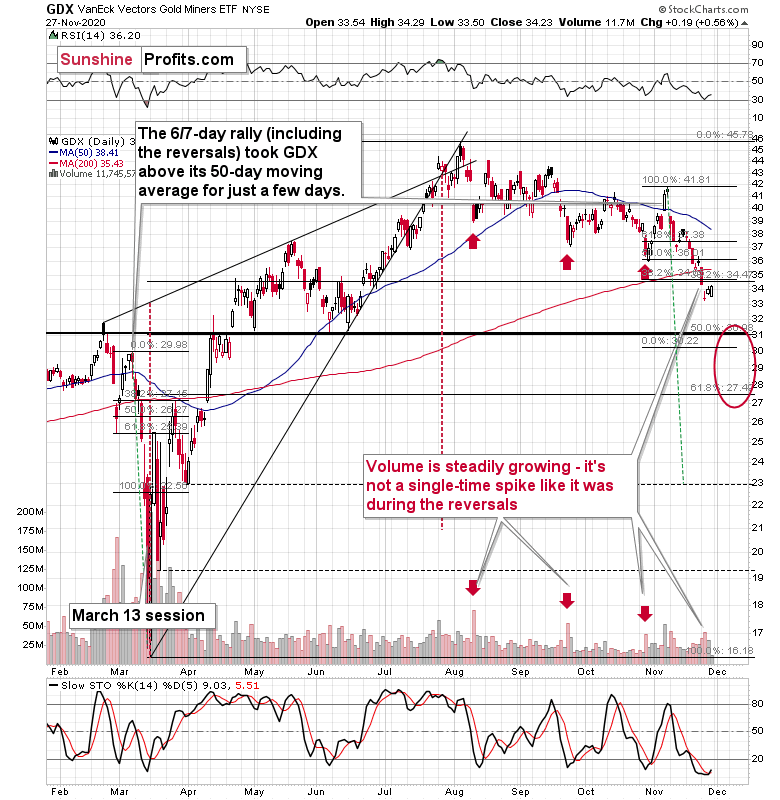
Two weeks ago, when I was preparing the analysis of the above GDX ETF chart, I commented on the late-week rebound in the following way:
On Thursday (Nov 12th) and Friday (Nov 13th) of last week, miners moved and closed higher, but it’s important to note that their upswing was tiny and not accompanied by strong volume. In other words, it has all the characteristics of the breather that’s going to be followed by another move in the direction in which the market had been moving previously.
The previous move was down, so the implications are bearish.
Something similar took place during last week as well as the previous week, and thus today’s comments will be similar. It seems that we now have this specific weekly gold stocks seasonality where miners decline strongly early in the week and then show some limited strength before the weekend.
For now, it seems that we have just likely seen a regular breather that is likely to be followed by further declines.
As indicated earlier, the biggest part of the decline might start shortly after Thanksgiving.
Also, let’s not forget that the GDX ETF has recently invalidated the breakout above the 61.8% Fibonacci retracement based on the 2011 – 2016 decline.
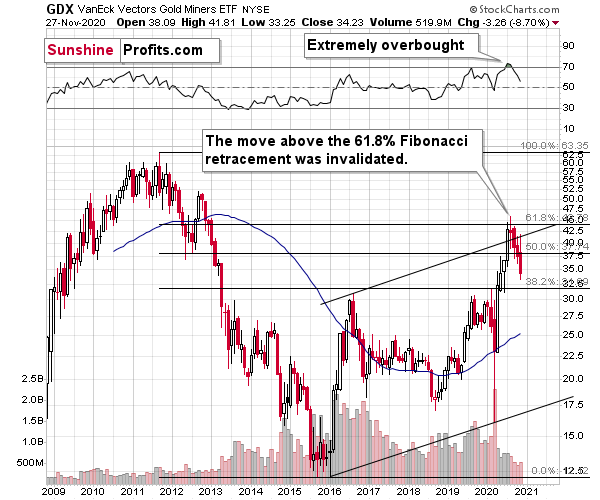
When GDX approached its 38.2% Fibonacci retracement, it declined sharply – it was right after the 2016 top. Are we seeing the 2020 top right now? This is quite possible – PMs are likely to decline after the sharp upswing, and since there is just more than one month left before the year ends, it might be the case that they move north of the recent highs only in 2021.
Either way, miners’ inability to move above the 61.8% Fibonacci retracement level and their invalidation of the tiny breakout is a bearish sign.
The same goes for miners’ inability to stay above the rising support line – the line that’s parallel to the line based on the 2016 and 2020 lows.
Let’s proceed to metals themselves.
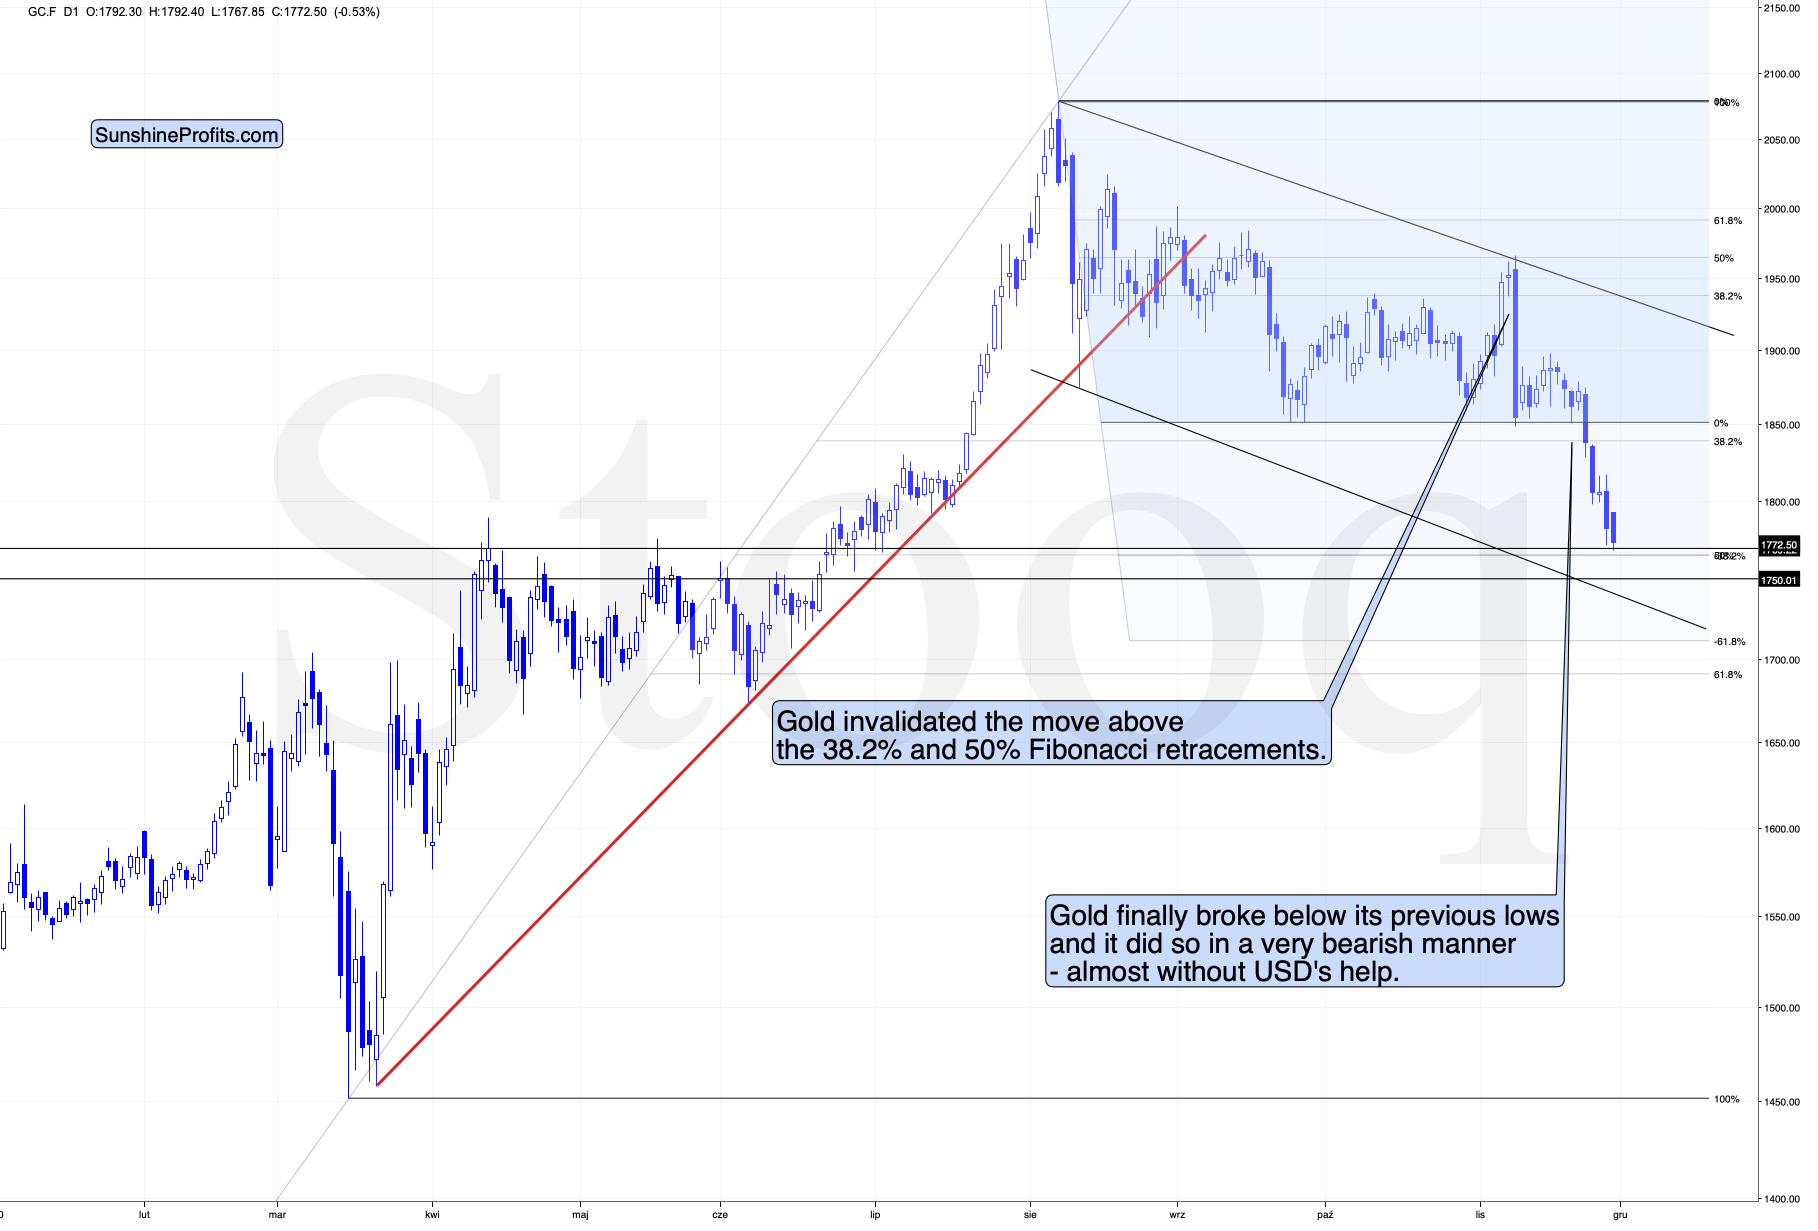
Gold plunged last week and it’s moving lower also in today’s pre-market trading. This is surprising, given the USD’s tiny breakdown that I discussed earlier today. Still, it’s not that odd given the breakdown below the September lows.
The support provided by the April high as well as the Fibonacci-based retracement (50% based on the 2020 rally and extension (1.382 of the initial decline) could trigger a rebound, but they definitely don’t have to, given where the USD Index is.
In fact, since the USD Index has not soared yet and the price of gold is already only about $70 above our previous target for this decline ($1,700), it now seems unlikely that gold will form its final bottom at this price level.
If gold was so weak last week despite the decline in the USDX, it’s likely to be even weaker, when the USD Index finally rallies. And since the USDX could soar quite sharply, gold could truly plunge.
Gold might rebound temporarily from $,1700 or even from the current levels, but overall, it seems that the decline that is still ahead will be bigger than just to $1,700.
The next very strong support level is all the way down at about $1,500 – or at the 2020 lows, near $1,450.
Still, please keep in mind that it is not the price level that gold reaches per se that’s most important, but gold’s ability to remain strong while the USD Index continues to rally. So far, we see exactly the opposite – gold is weak even though the USD Index is also weak.
Having said that, let’s take a look at silver.
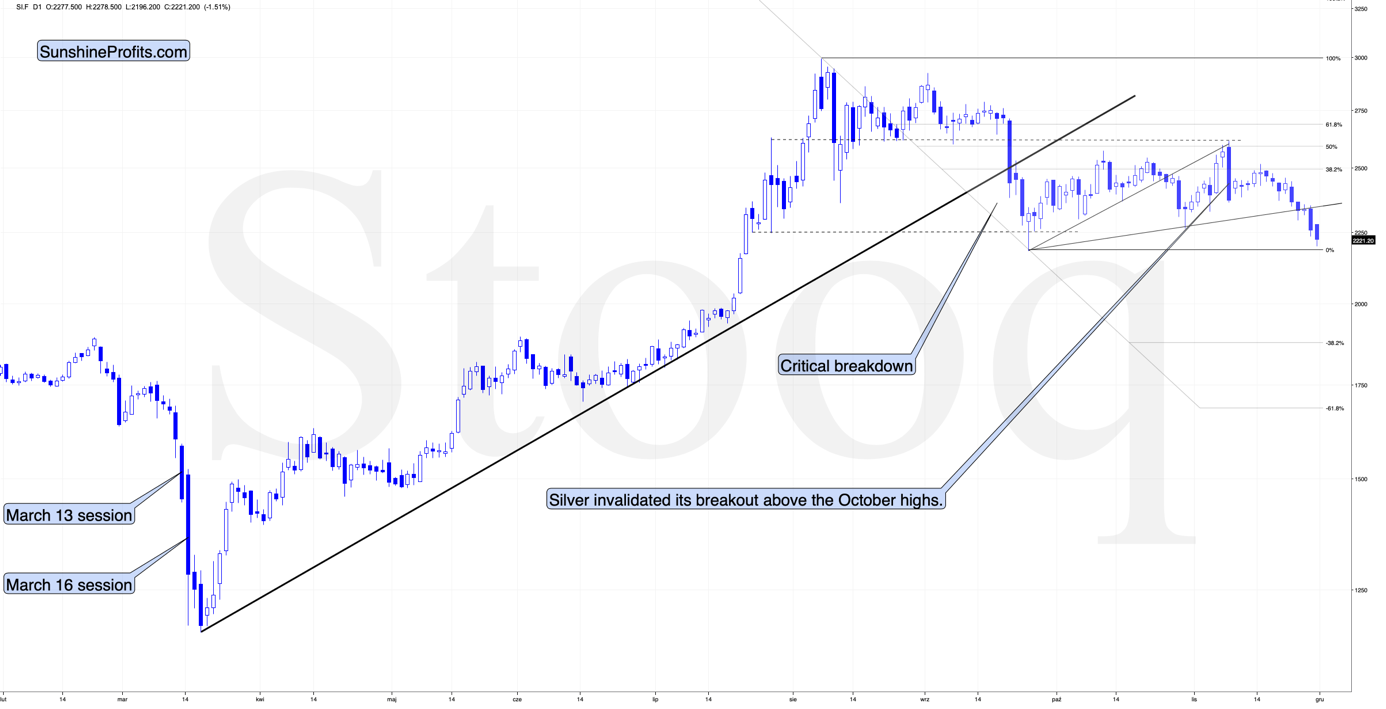
Silver was outperforming gold on a short-term basis, which had indicated that the next sizable move lower was looming. And indeed, gold is already well after the breakout below its September low, and silver is just approaching its own September low.
Is it still outperforming gold? No, it’s now moving more or less in tune with it (on a day-to-day basis). This is normal given the current situation (PMs are declining).
But is silver declining much faster than mining stocks? This was the case on Friday, but just as one swallow doesn’t make a summer, this daily session doesn’t imply that just yet – it could have been accidental.
What seems likely is that if gold is to decline below $1,700, then the part of the decline below this level could be characterized by rapidly declining silver prices. You know, if gold is about to slide all the way back to its 2020 low, then silver might do the same thing and slide below $12, especially if we see more weakness in the general stock market.
Sounds crazy? This could be the case, but please note that gold’s decline from above $2,000 to below $1,800 is also quite extravagant given a move lower in the USD Index in the meantime. If the USD Index rallies – and its likely to rally significantly in my view – then PMs are likely to slide.
Let’s keep in mind that silver has more industrial uses than gold, which makes it more likely to get the bearish push from stocks – if the latter decline that is.
Before moving further, I would like to stress that according to the previous gold chart, the likely initial downside target for gold is at about $1,700, predicated on the previous lows and the 61.8% Fibonacci retracement, based on the recent 2020 rally.
Having said, that, let’s focus on the fact that gold recently failed to move above its previous long-term (2011) high. Since history tends to repeat itself, it’s only natural to expect gold to behave as it did during its previous attempt to break above its major long-term high.
And the only similar case is from late 1978 when gold rallied above the previous 1974 high. Let’s take a look at the chart below for details (courtesy of chartsrus.com)
As you can see above, in late 1978, gold declined severely right after it moved above the late-1974 high. This time, gold invalidated the breakout, which makes the subsequent decline more likely. And how far did gold decline back in 1978? It declined by about $50, which is about 20% of the starting price. If gold was to drop 20% from its 2020 high, it would slide from $2,089 to about $1,671.
This is in perfect tune with what we described previously as the downside target while describing gold’s long-term charts:
The chart above shows exactly why the $1,700 level is even more likely to trigger a rebound in gold, at the very minimum.
The $1,700 level is additionally confirmed by the 38.2% Fibonacci retracement based on the entire 2015 – 2020 rally.
There’s also a good possibility that gold could decline to the $1,500 - $1,600 area or so (50% - 61.8% Fibonacci retracements and the price level to which gold declined initially in 2011), but based on the size of the recent upswing, we no longer think that this scenario is the most likely one.
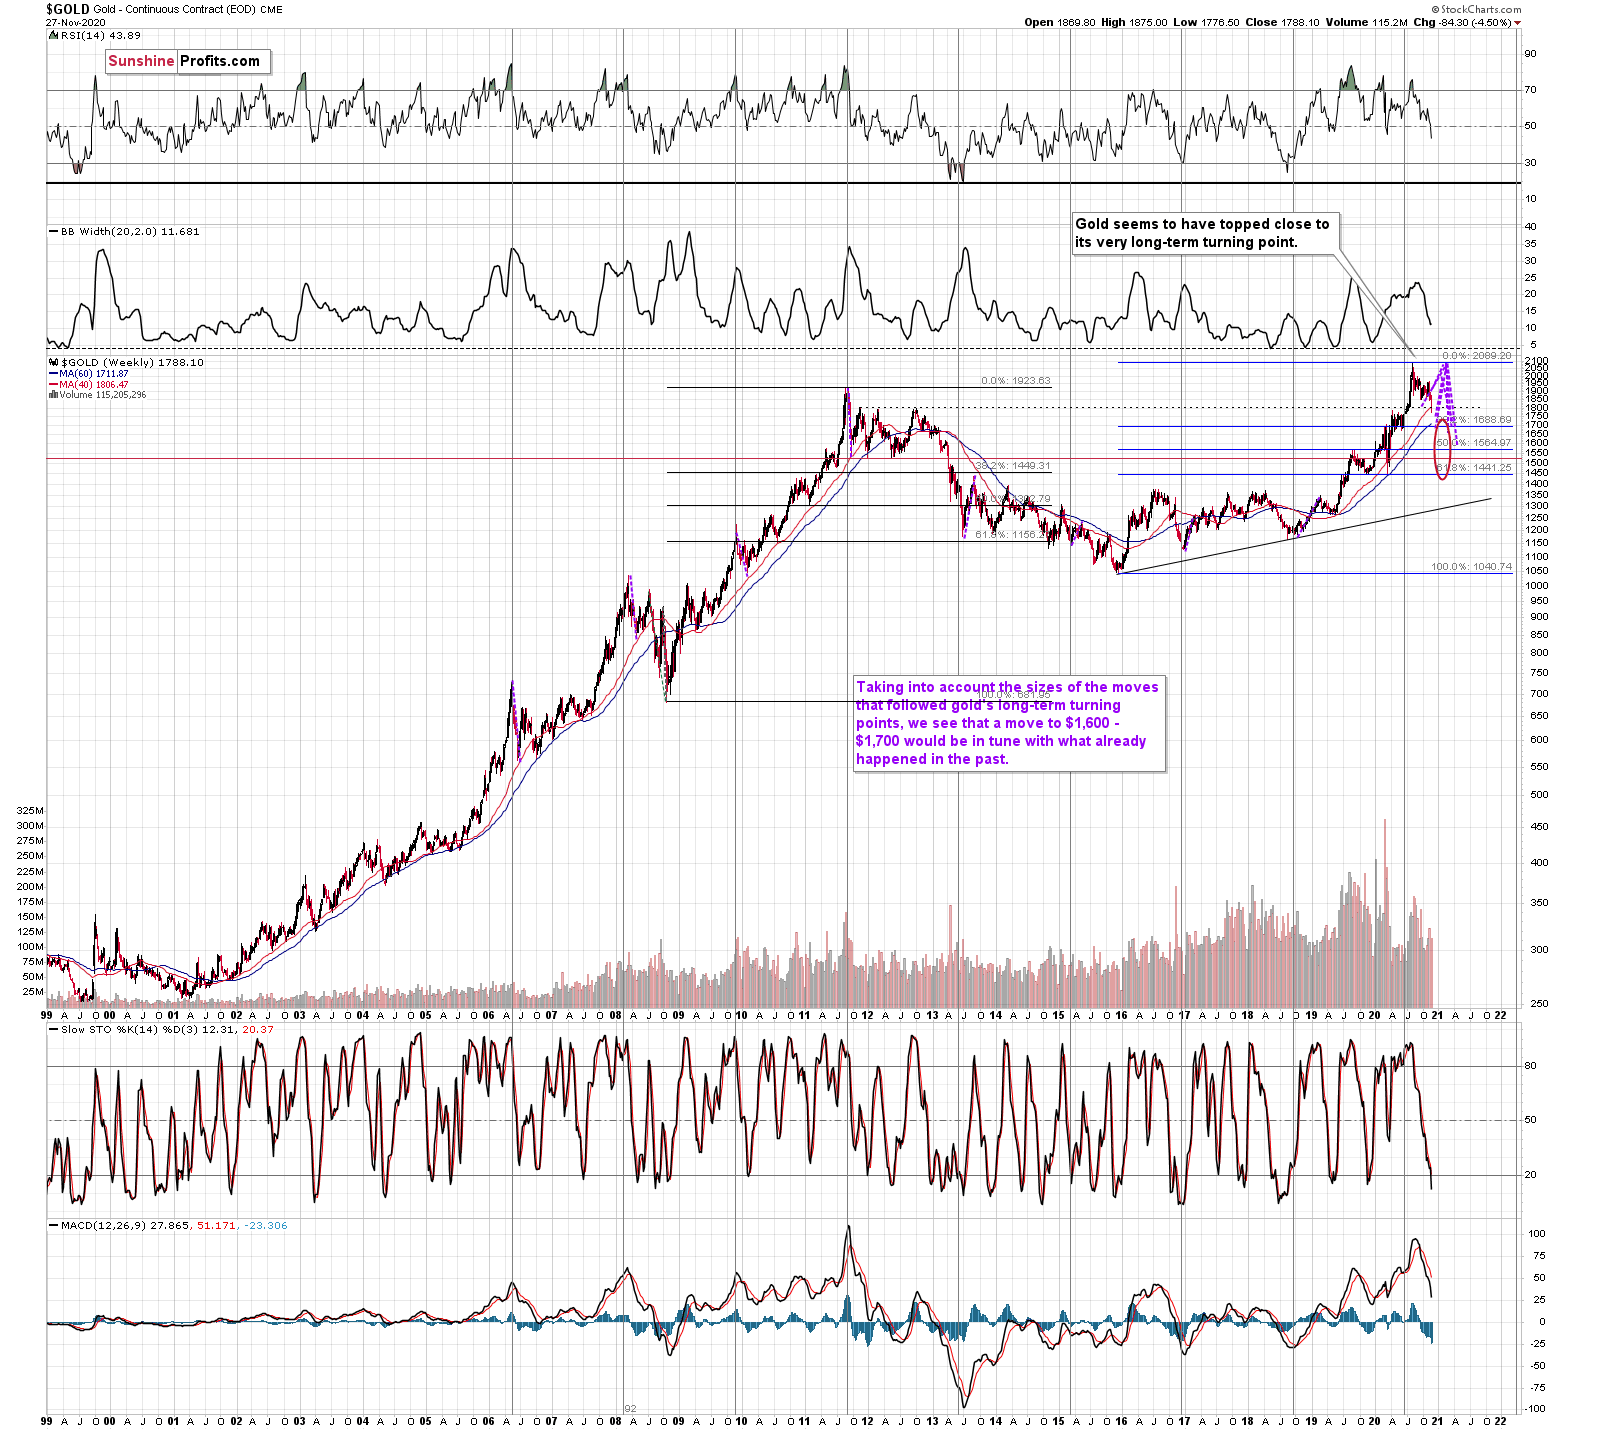
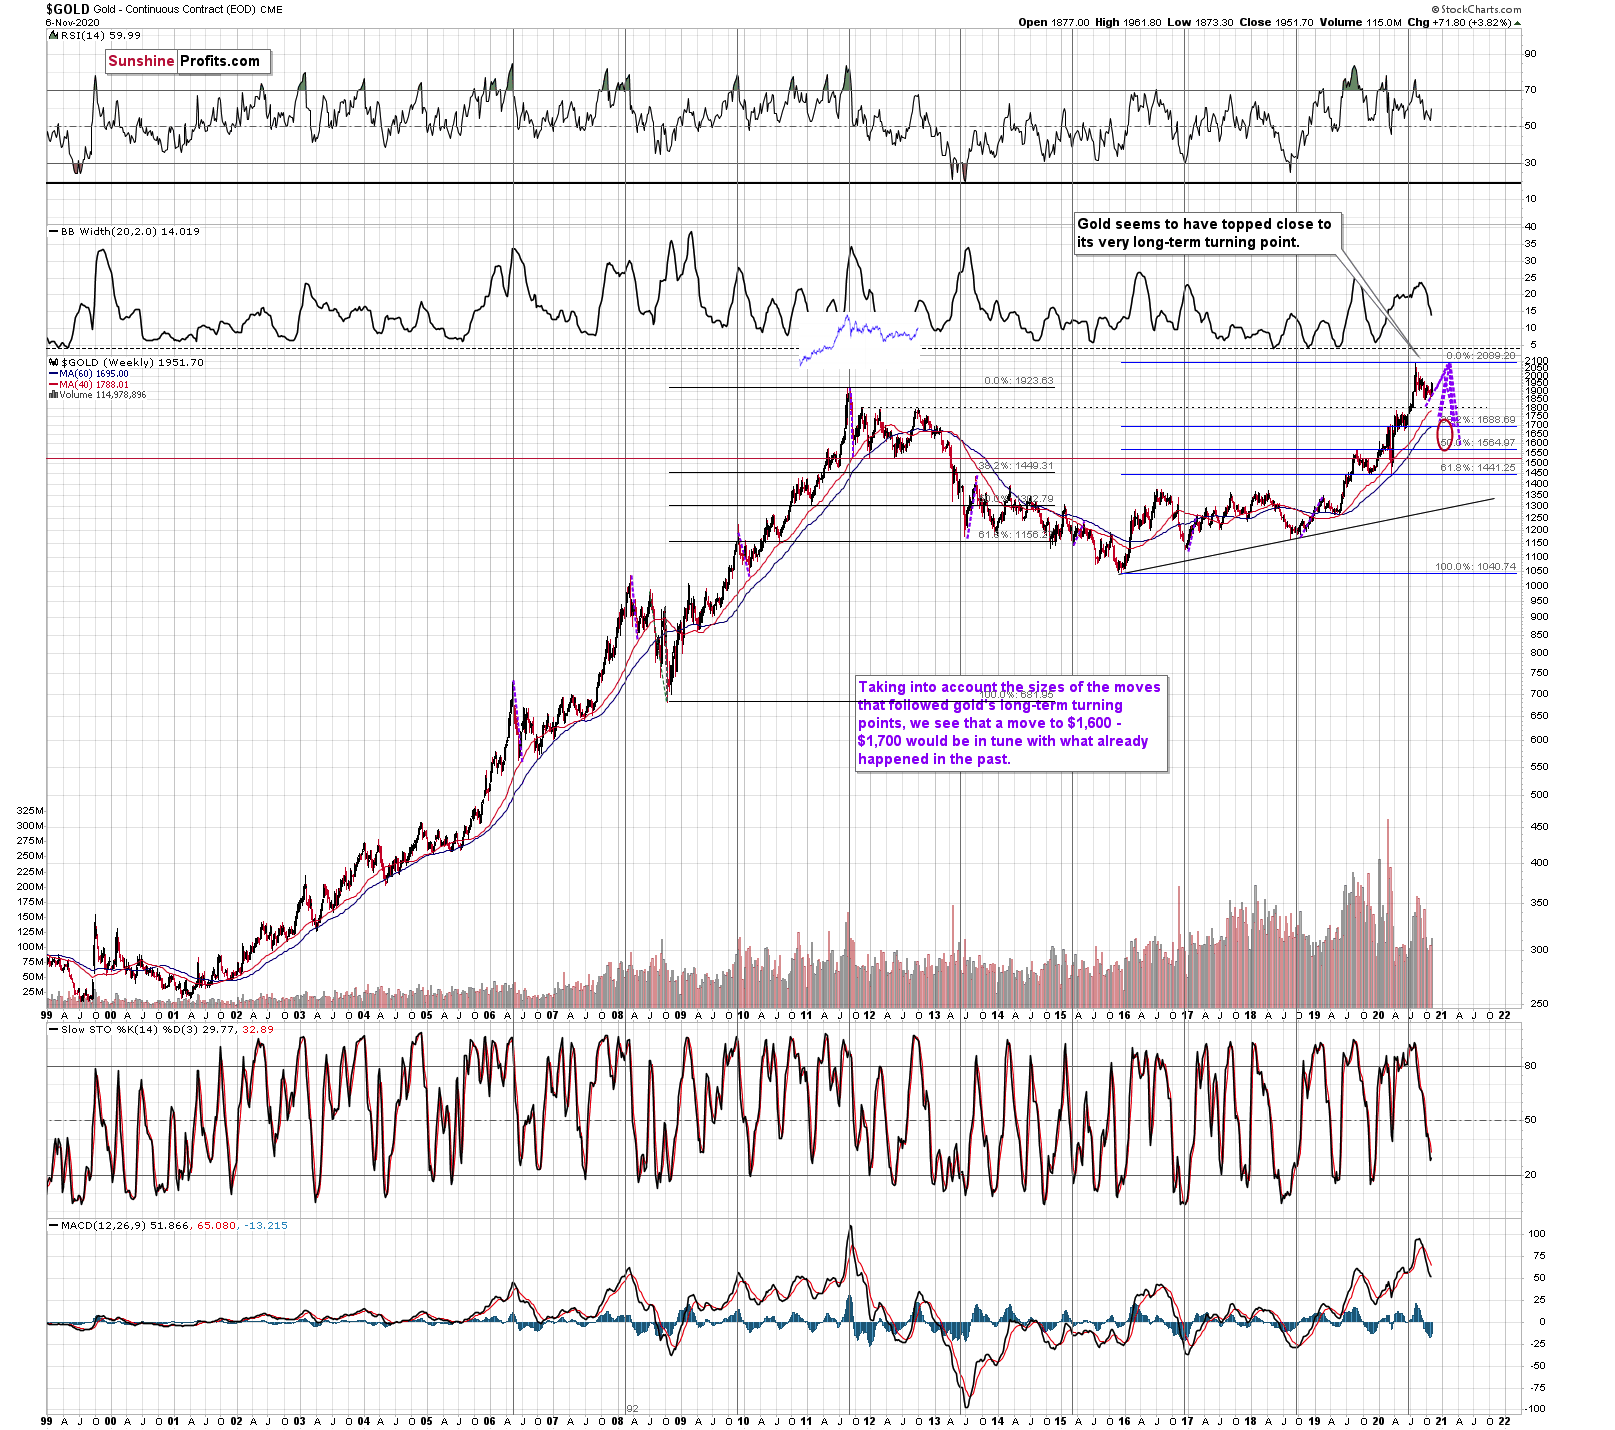
Gold is (from the long-term point of view) after its very long-term turning point, and since the most recent move has been to the upside, its implications are bearish.
We used the purple lines to mark the previous price moves that followed gold's long-term turning points, and we copied them to the current situation. We copied both the rallies and declines, which is why it seems that some moves would suggest that gold moves back in time - the point is to show how important the turning point is in general.
Based on the information that we have available right now, it seems likely that gold will decline to at least the $1,700 level. That’s very much in tune with how much gold moved after the previous long-term turning points.
Speaking of upside targets, about three months ago we wrote:
Based on gold's Fibonacci extensions and the previous major highs and lows (the 2018 high and late-2019 low along with the 2020 low), we get a nearby upside target of $2085. At the moment of writing these words, gold is trading at $2044. Given this week's volatility, it could even be a matter of hours before gold reaches the above-mentioned target and reverses. Taking closing prices into account, gold is up by $35, so if it reverses significantly, we would be likely to see a powerful weekly reversal candlestick and one that causes gold to decline in the following weeks.
That’s more or less what happened. Gold topped at $2,089.20. It then declined quite visibly and closed last week at about $1,950.
Do you get the feeling that you have already seen gold perform this way before? Because you did.
The history rhymes, but this time, the similarity is quite shocking.
We copied the short-term chart and pasted it on the long-term chart above and next to the 2011 top. We pasted it twice, so that you can easily compare gold’s performance.
They are very similar to say the least. Yes, these patterns happened over different periods, but this doesn’t matter. Markets are self-similar, which is why you can see similar short-term trends and long-term trends (with regard to their shapes). Consequently, comparing patterns of similar shape makes sense even if they form over different timeframes.
After a sharp rally, gold declined quickly. Then we saw a rebound, and a move back to the previous low. Then, after a bit longer time, gold moved close to the most recent high and started its final decline. This decline was less volatile than the initial slide. That’s what happened when gold topped in 2011 (and in the following years), and that’s what happened also this year.
The patterns of this level of similarity are rare, and when they do finally take place, they tend to be remarkably precise with regard to the follow-up action.
What is likely to follow based on this pattern, is that we’re likely to see the end of the slower decline, which will be followed by a big and sharp decline – similarly to what we saw in 2013.
The above similarity also shows that gold’s decline might initially have counter-trend rallies – just as we saw in early 2013. Consequently, seeing such a rally could be viewed as a bearish confirmation of this self-similarity.
How low could gold slide based on this similarity? Back in 2013, gold declined approximately to the 61.8% Fibonacci retracement based on the preceding rally (the one that started in 2008), so that’s the natural target this time as well.
Considering this retracement based on the 2015 – 2020 rally provides us with $1,441 as the final target.
Another interesting point is that gold made an interim low close to the 38.2% - 50% retracements and the previous lows. Applying this to the current situation suggests that we could see a smaller rebound when gold moves to about $1,700, where we have several support levels.
This might be the moment to switch from short positions in the miners to short position in silver. It’s too early to say for sure at this time, though.
Moreover, please note that from the long-term point of view, silver is not that strong.
While gold moved to new highs, silver – despite its powerful short-term upswing – didn’t manage to correct more than half of its 2011 – 2020 decline.
In fact, silver has already invalidated its move above the lowest of the classic Fibonacci retracement levels (38.2%), which is not something that characterizes extraordinarily strong markets.
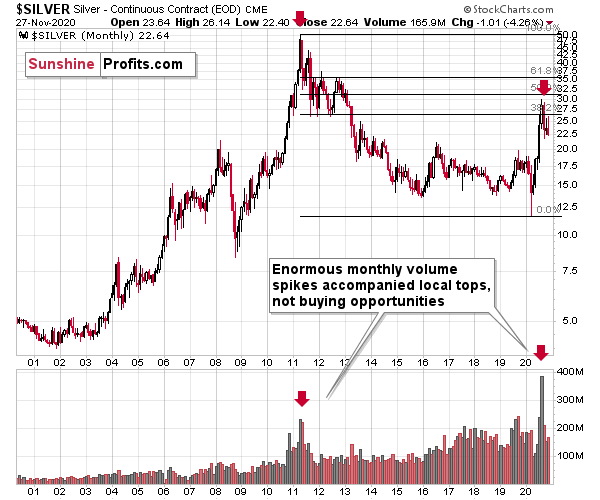
Silver is likely to move well above its 2011 highs, but it’s unlikely to do it without another sizable downswing first.
If you look at the monthly silver volume levels, it seems likely that the next sizable downswing has already begun. The previous substantial monthly volume in silver accompanied the 2011 top. The analogy doesn’t get more bearish than this. Ok, it would, if there were multiple key tops confirmed by huge monthly volume. But the 2011 top was so significant that other tops are not comparable, except for the most recent one. Thus, the implications are bearish.
We are witnessing something similar in the HUI Index as well. The latter corrected half of its 2011 – 2016 decline and nothing more, while gold moved well above its 2011 high.
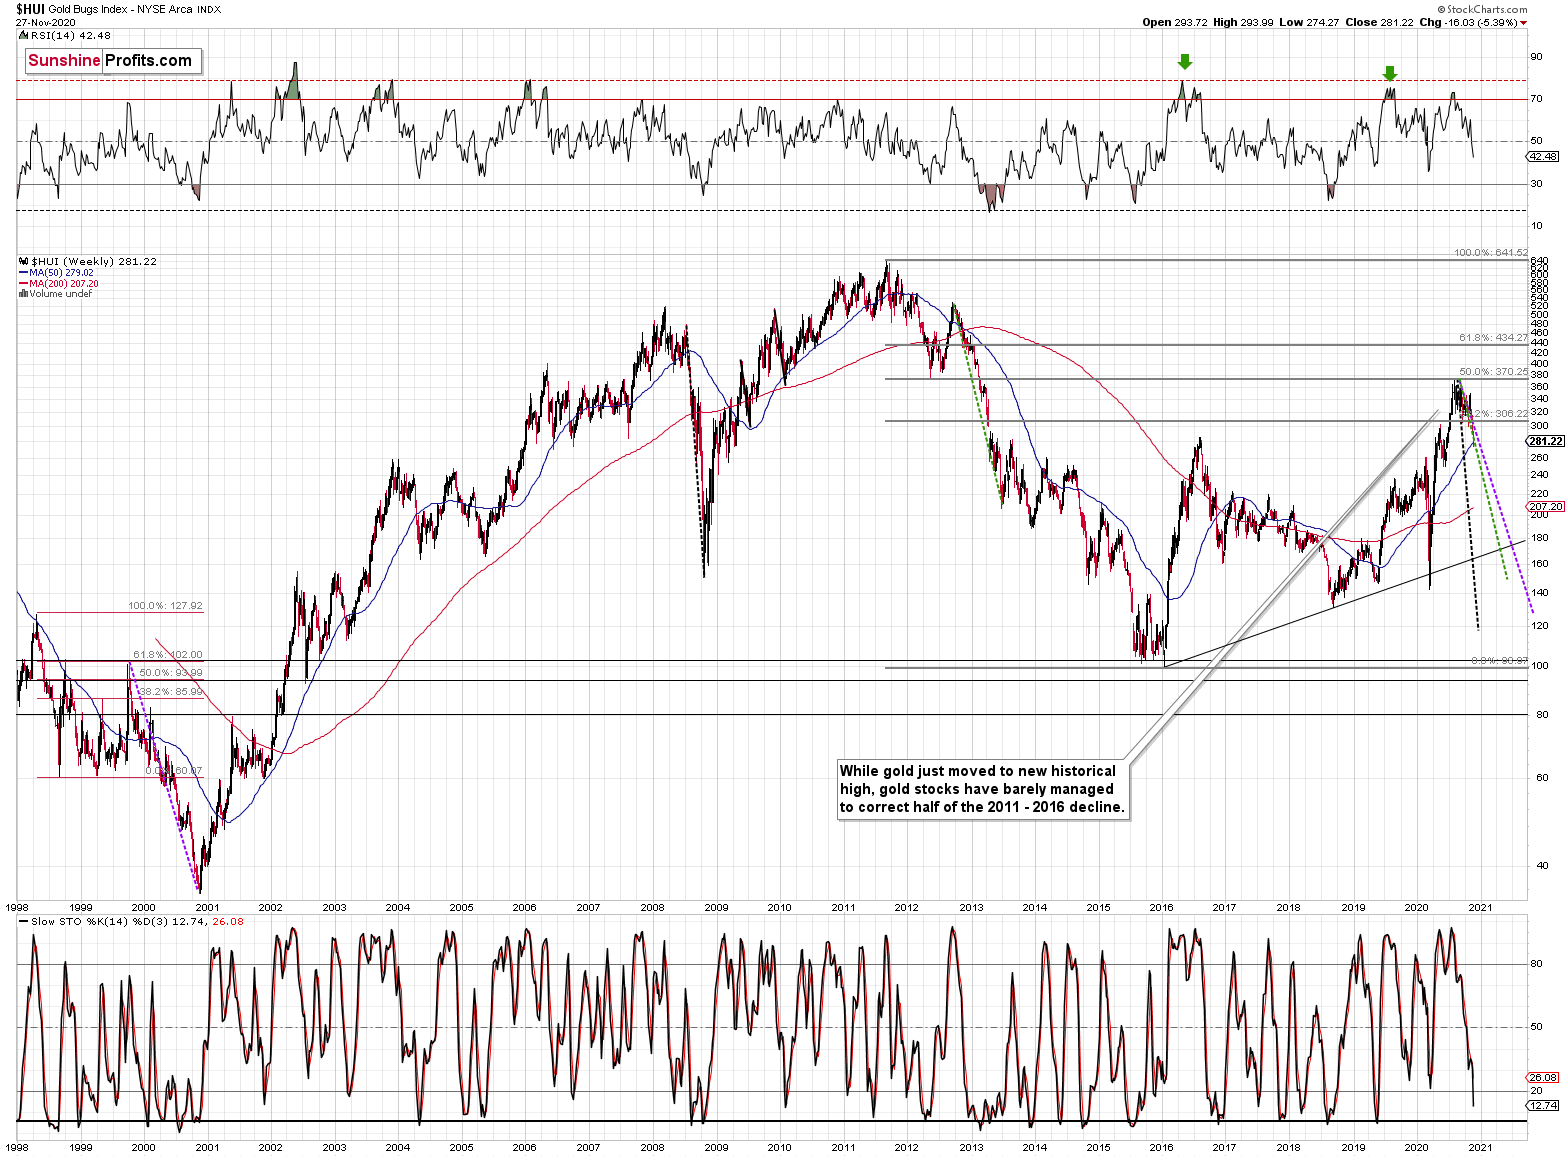
All in all, it was mostly gold that was making the major gains earlier this year – not the entire precious metals sector.
So, how can one determine the end of the gold price decline? At $1,700, it seems that it can go either up or down. Where does gold need to go to complete the pattern?
In reality, gold could rebound from $1,700, but it could just as well slide further, perhaps once again to the previous 2020 lows, especially if the USDX rallies to its 2020 highs.
So, how do we determine whether we see the buying opportunity or not?
We will view the price target levels as guidelines, and the same goes for the Gold Miners Bullish Percent Index (below 10), but the final confirmation will likely be something else. Something that we already saw in March when gold bottomed.
We will be on a special lookout for gold’s strength against the ongoing USDX rally. At many vital bottoms in gold, that’s exactly what happened, including what the March bottom.
The link between gold and the USD Index is strongly negative in the medium-term, but given gold’s extraordinary weakness despite the USD’s decline, the short-term correlation actually turned slightly positive recently. This is not the bullish sign we’ve been looking for. This is its opposite.
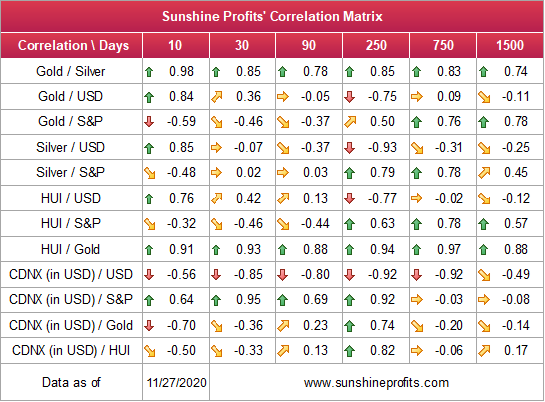
Since gold, silver, and mining stocks have been strongly negatively correlated with the USD Index in the medium term (90-day column), it seems likely that they will be negatively affected by the upcoming sizable USDX upswing.
…Until we see the day where gold reverses or soars despite the U.S. currency’s rally.
If that happens with gold at about $1,700, we’ll have a very good chance that this was the final bottom. If it doesn’t happen at that time, or gold continues to slide despite USD’s pause or decline, we’ll know that gold has further to fall.
Naturally we’ll keep you – our subscribers – informed.
To move forward, how does the GDX downside target compare to gold’s downside target? If, at the same time, gold moves to about $1,700 and miners are already after a ridiculously big drop (to $31-$32 in the GDX ETF, or lower), the binding profit-take exit price of your GDX ETF will become $32.02 (those with higher risk tolerance might lower it to $31.15 or so, but moving it lower seems just too risky).
At this time, the final GDX target (the one that would correspond to gold at $1,500 or so) is still unclear. The $17 - $23 area seems probable, especially if the general stock market slides once again. It’s too early to say with any significant level of certainty. Gold is providing us with a clearer final target, so that’s what we’ll focus on. And most importantly – we’ll focus on gold’s performance relative to the USD Index.
Overview of the Upcoming Decline
As far as the current overview of the upcoming decline is concerned, I think it has already begun.
During the final part of the slide (which could end within the next 1-5 weeks or so), I expect silver to decline more than miners. That would align with how the markets initially reacted to the Covid-19 threat.
The impact of all the new rounds of money printing in the U.S. and Europe on the precious metals prices is incredibly positive in the long run, which does not make the short-term decline improbable. Markets can and will get ahead of themselves and decline afterward – sometimes very profoundly – before continuing with their upward climb.
The plan is to exit the current short positions in miners after they decline far and fast, but at the same time, silver drops just “significantly” (we expect this to happen in 0 – 3 weeks). In other words, the decline in silver should be severe, but the decline in the miners should look “ridiculous”. That’s what we did in March when we bought practically right at the bottom. It is a soft, but simultaneously broad instruction, so additional confirmations are necessary.
I expect this confirmation to come from gold, reaching about $1,700 - $1,750. If – at the same time – gold moves to about $1,700 - $1,750 and miners are already after a ridiculously big drop (say, to $31 - $32 in the GDX ETF – or lower), we will probably exit the short positions in the miners and at the same time enter short positions in silver. However, it could also be the case that we’ll wait for a rebound before re-entering short position in silver – it’s too early to say at this time. It’s also possible that we’ll enter very quick long positions between those short positions.
The precious metals market's final bottom is likely to take shape when gold shows significant strength relative to the USD Index. It could take the form of a gold’s rally or a bullish reversal, despite the ongoing USD Index rally.
Summary
Summing up, the next big move lower in the precious metals market is definitely underway and it seems that it will take another 1-5 weeks (likely in mid-December or in its second half) before the decline ends. It seems that the part of the slide in gold that takes place below $1,700 is going to see a silver catching up with the decline in gold and miners.
Please note that even Warren Buffett is limiting his exposure to gold.
As the USD Index appears to have ended forming its broad bottom pattern, it’s likely to rally, causing gold to slide. At some point gold is likely to stop responding to dollar’s bearish indications, and based on the above analysis, it seems that we might expect this to take place in December.
Naturally, everyone's trading is their responsibility. But in our opinion, if there ever was a time to either enter a short position in the miners or increase its size if it was not already sizable, it's now. We made money on the March decline, and on the March rebound, with another massive slide already underway.
After the sell-off (that takes gold to about$1,700 or lower), we expect the precious metals to rally significantly. The final decline might take as little as 1-5 weeks, so it's important to stay alert to any changes.
Most importantly, please stay healthy and safe. We made a lot of money on the March decline and the subsequent rebound (its initial part) price moves (and we'll likely earn much more in the following weeks and months), but you have to be healthy to enjoy the results.
As always, we'll keep you - our subscribers - informed.
To summarize:
Trading capital (supplementary part of the portfolio; our opinion): Full speculative short positions (300% of the full position) in mining stocks is justified from the risk to reward point of view with the following binding exit profit-take price levels:
Senior mining stocks (price levels for the GDX ETF): binding profit-take exit price: $32.02; stop-loss: none (the volatility is too big to justify a SL order in case of this particular trade); binding profit-take level for the DUST ETF: $28.73; stop-loss for the DUST ETF: none (the volatility is too big to justify a SL order in case of this particular trade)
Junior mining stocks (price levels for the GDXJ ETF): binding profit-take exit price: $42.72; stop-loss: none (the volatility is too big to justify a SL order in case of this particular trade); binding profit-take level for the JDST ETF: $21.22; stop-loss for the JDST ETF: none (the volatility is too big to justify a SL order in case of this particular trade)
For-your-information targets (our opinion; we continue to think that mining stocks are the preferred way of taking advantage of the upcoming price move, but if for whatever reason one wants / has to use silver or gold for this trade, we are providing the details anyway. In our view, silver has greater potential than gold does):
Silver futures downside profit-take exit price: unclear at this time - initially, it might be a good idea to exit, when gold moves to $1,703.
Gold futures downside profit-take exit price: $1,703
Long-term capital (core part of the portfolio; our opinion): No positions (in other words: cash
Insurance capital (core part of the portfolio; our opinion): Full position
Whether you already subscribed or not, we encourage you to find out how to make the most of our alerts and read our replies to the most common alert-and-gold-trading-related-questions.
Please note that we describe the situation for the day that the alert is posted in the trading section. In other words, if we are writing about a speculative position, it means that it is up-to-date on the day it was posted. We are also featuring the initial target prices to decide whether keeping a position on a given day is in tune with your approach (some moves are too small for medium-term traders, and some might appear too big for day-traders).
Additionally, you might want to read why our stop-loss orders are usually relatively far from the current price.
Please note that a full position doesn't mean using all of the capital for a given trade. You will find details on our thoughts on gold portfolio structuring in the Key Insights section on our website.
As a reminder - "initial target price" means exactly that - an "initial" one. It's not a price level at which we suggest closing positions. If this becomes the case (like it did in the previous trade), we will refer to these levels as levels of exit orders (exactly as we've done previously). Stop-loss levels, however, are naturally not "initial", but something that, in our opinion, might be entered as an order.
Since it is impossible to synchronize target prices and stop-loss levels for all the ETFs and ETNs with the main markets that we provide these levels for (gold, silver and mining stocks - the GDX ETF), the stop-loss levels and target prices for other ETNs and ETF (among other: UGL, GLL, AGQ, ZSL, NUGT, DUST, JNUG, JDST) are provided as supplementary, and not as "final". This means that if a stop-loss or a target level is reached for any of the "additional instruments" (GLL for instance), but not for the "main instrument" (gold in this case), we will view positions in both gold and GLL as still open and the stop-loss for GLL would have to be moved lower. On the other hand, if gold moves to a stop-loss level but GLL doesn't, then we will view both positions (in gold and GLL) as closed. In other words, since it's not possible to be 100% certain that each related instrument moves to a given level when the underlying instrument does, we can't provide levels that would be binding. The levels that we do provide are our best estimate of the levels that will correspond to the levels in the underlying assets, but it will be the underlying assets that one will need to focus on regarding the signs pointing to closing a given position or keeping it open. We might adjust the levels in the "additional instruments" without adjusting the levels in the "main instruments", which will simply mean that we have improved our estimation of these levels, not that we changed our outlook on the markets. We are already working on a tool that would update these levels daily for the most popular ETFs, ETNs and individual mining stocks.
Our preferred ways to invest in and to trade gold along with the reasoning can be found in the how to buy gold section. Furthermore, our preferred ETFs and ETNs can be found in our Gold & Silver ETF Ranking.
As a reminder, Gold & Silver Trading Alerts are posted before or on each trading day (we usually post them before the opening bell, but we don't promise doing that each day). If there's anything urgent, we will send you an additional small alert before posting the main one.
Thank you.
Przemyslaw Radomski, CFAFounder, Editor-in-chief

