

Briefly: in our opinion, full (300% of the regular position size) speculative short positions in mining stocks are justified from the risk/reward point of view at the moment of publishing this Alert.
If you’ve been waiting for a high-quality sign that the next big move in the precious metals sector is underway – you just got it.
There are days on the markets when nothing happens, there are days when what happens is visible only to some (like Monday’s session), and there are days when the market’s signals are crystal-clear – as if the charts were practically screaming at the person examining them. Yesterday, was one of the latter kind of days.
Without further ado, let’s take a look at the key development that we just saw in the precious metals’ world – the big decline in the GDX ETF – proxy for mining stocks.
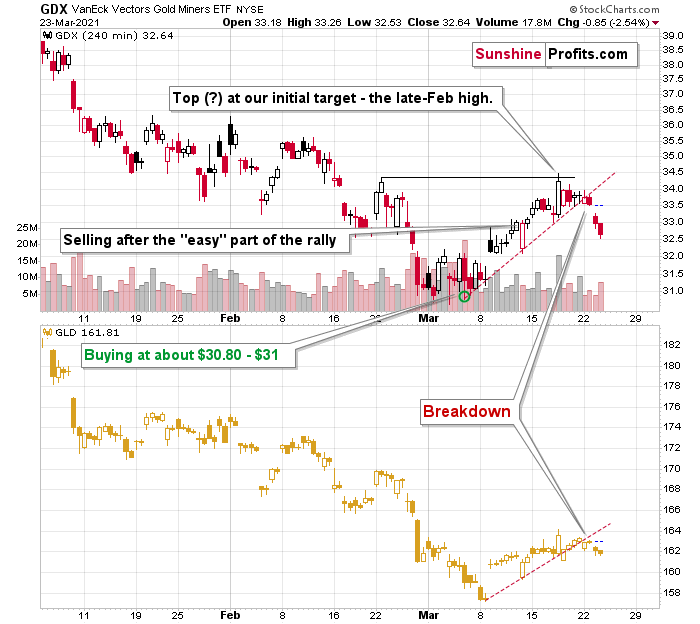
After the tiny breakdown that I described yesterday (Mar. 24), the GDX ETF declined significantly, and it even opened the session with a price gap. If you look at the left side of the chart, you’ll see that this is the way in which the big January decline started. In the next 2 months, the value of the GDX ETF declined by over $8.
But is the corrective upswing really over? Did the move higher end at a price level that was likely to stop it? Yes, definitely so.
On March 10 (when we were already long), I wrote the following:
Even though gold moved lower in early March, gold miners stopped declining after reaching my target area based several techniques – most importantly the 50% Fibonacci retracement based on the entire 2020 rally, and the previous lows and highs. Just as miners’ relative weakness had previously heralded declines for the entire precious metals sector, their strength meant that a rally was about to start. And that’s just what we saw yesterday (Mar. 9).
Ultimately, it seems that the above corrections will result in the GDX ETF moving to about $34 or so.
The resistance levels in the $34 - $35 area are provided by:
- The late-February 2020 high
- The rising neck level of the previously completed head and shoulders pattern
- The analogy to how big miners’ correction was in April (assuming that the mirror similarity continues)
- The declining blue resistance line
- The 50-day moving average
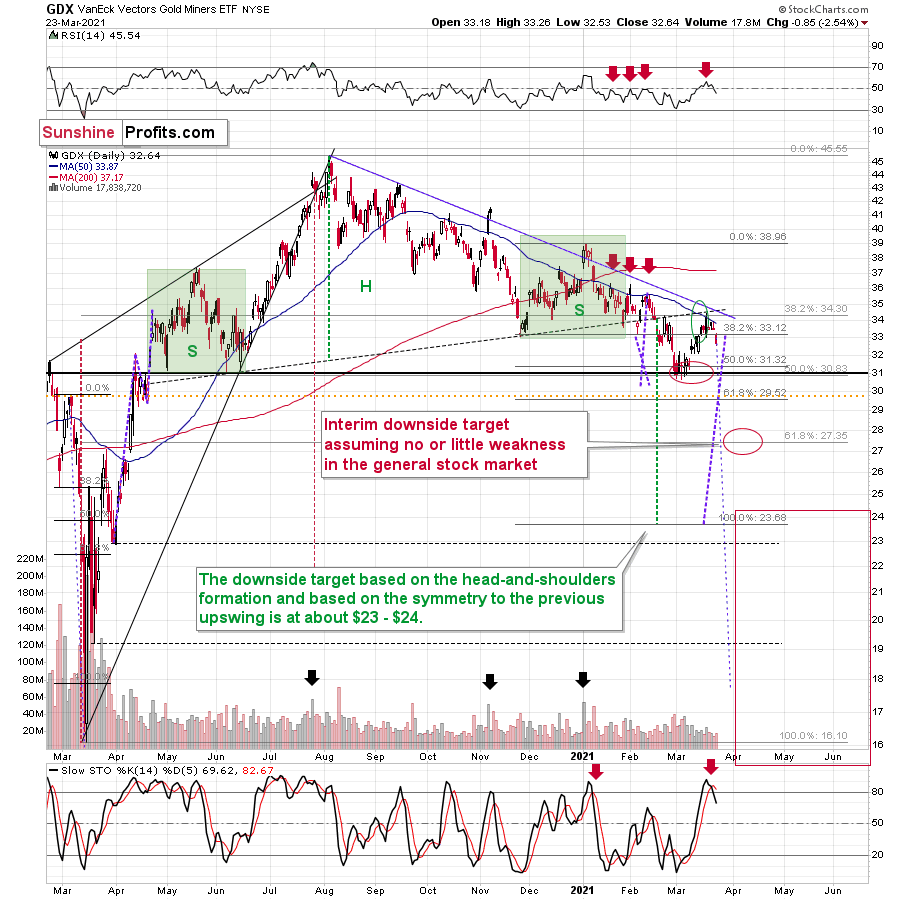
Consequently, it makes sense for the GDX ETF to slide form here, as the corrective rally that was likely to take place is most likely already over.
The clearly visible sell signal from the stochastic indicator (lower part of the chart) confirms the above as well.
Having said that, let’s take a look at even bigger decline in the GDXJ ETF – proxy for junior mining stocks.
While senior gold miners declined 2.54% yesterday, junior miners declined by 4.04%.
The remarkable thing about both declines is that they took place almost without gold’s help. GLD ended yesterday’s session just 0.73% lower. The general stock market – another market that could temporarily impact the prices of mining stocks – declined by 0.76% yesterday.
In comparison, the declines that we saw in both proxies for mining stocks were huge. This is very important, because the recent declines in the precious metals sector and the recent rallies in the precious metals sector were preceded by – respectively – the relative weakness of miners compared to gold and the relative strength of miners compared to gold.
What we saw yesterday is a crystal-clear sign that the waiting for the next big move lower is over.
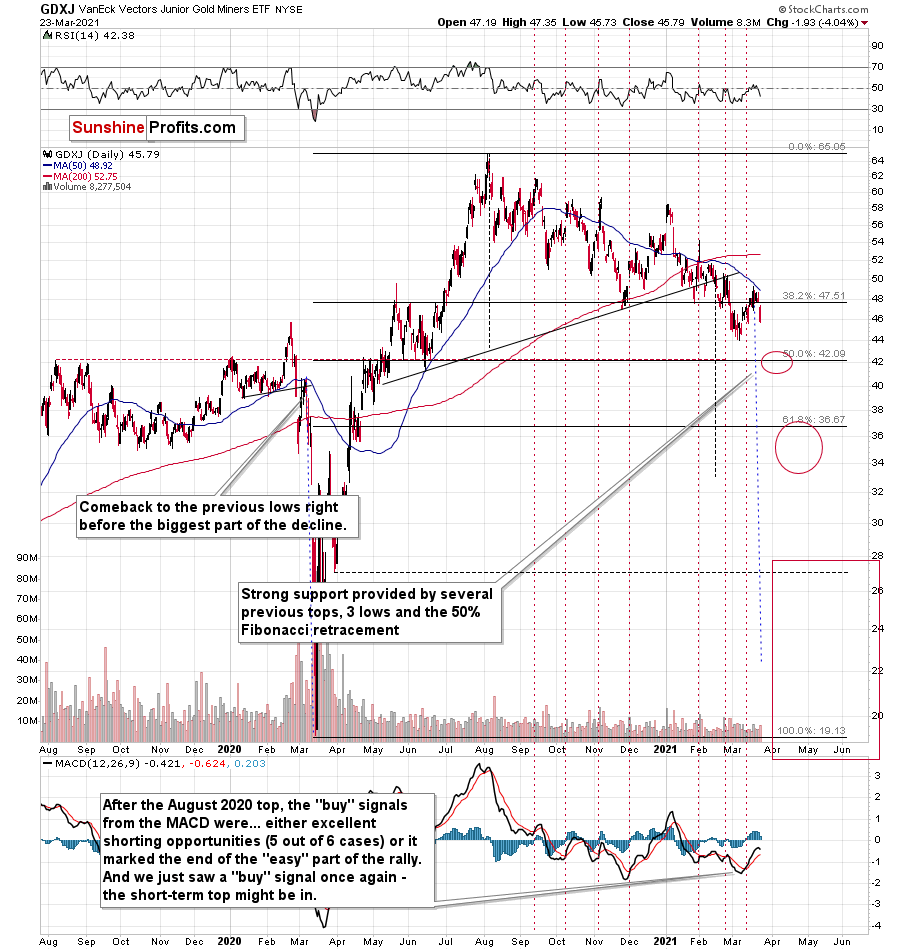
This month’s “buy” signal from the MACD indicator seems to have once again marked a great shorting opportunity. On March 12, I wrote the following:
The above chart is a big red warning flag for beginner investors. The flag reads: “verify the efficiency of a given tool on a given market, before applying it”.
The bottom part of the above chart features the MACD indicator. Normally, when the indicator line (black) crosses its signal line (red), we have a signal. If it’s moves above the signal line, it’s a buy sign, and if it moves below it, it’s a sell sign.
But.
If one actually looks at what happened after the previous “buy signals” in the recent months, they will see that in 5 out of 6 cases, these “buy signals” practically marked the exact tops, thus being very effective sell signals! In the remaining case, it was a good indication that the easy part of the corrective upswing was over.
I’m not only describing the above due to its educational value, but because we actually saw a “buy signal” from the MACD, which was quite likely really a sell signal.
I recently added that the MACD indicator is far from a light switch. While false buy signals often precede material drawdowns, the reversals don’t occur overnight. As a result, it’s perfectly normal for the GDXJ ETF to trade sideways or slightly higher for a few days before moving lower. This is what we saw last week.
And yesterday, we saw the 4%+ daily slide, which means that everyone who shorted the market based on the MACD’s “buy” signal is already profitable.
Once again – please remember to check whether a given technique or indicator actually worked for your favorite market before applying it and entering a trade.
Another market that appears to confirm the bearish narrative is silver.
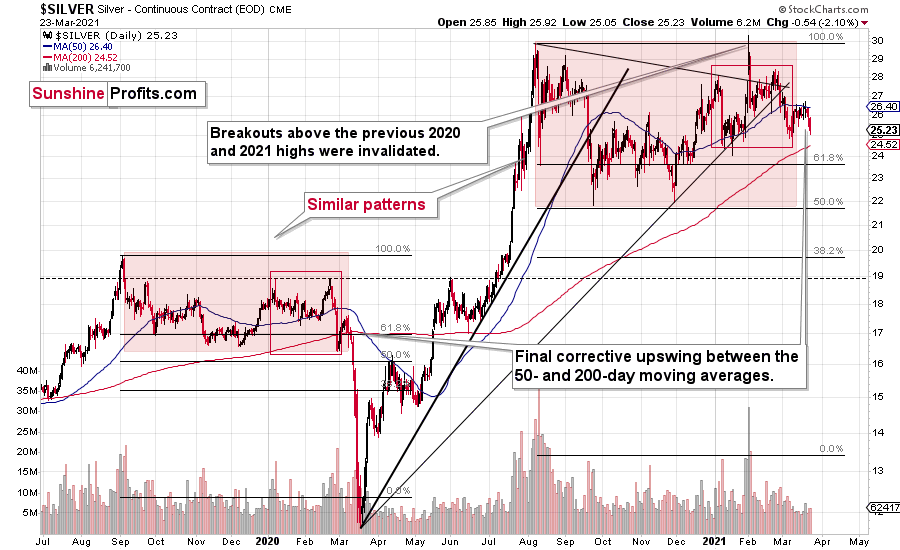
Silver moved lower in a more visible manner, which might be surprising to some investors (especially those that went long based on the “silver short squeeze” movement almost two months ago), but it’s not surprising to me. If the history repeats itself to a considerable degree, then it’s not odd to see the same kind of performance that we saw in the similar stage of a given price move.
In this case, I already discussed the self-similarity present in the silver market, and I marked the similar patterns with red rectangles. The current situation seems similar to early March 2020, when silver was just starting a major decline while being between its 50- and 200-day moving average. Let’s keep in mind that gold actually moved to a new high in early March, and silver was very far from doing so. Back then, silver underperformed, so it’s no wonder that it’s underperforming right now. While the silver shortage was the topic of the day for many days about two months ago, it seems that more bearish headlines will soon be more popular.
Please note that a move below ~$24 in silver will imply that everyone who bought in late January or February, when silver was particularly popular is already in the red. As silver then moves even lower, those investors will most likely feel significant emotional pressure to sell – and some will, most likely making the decline bigger and sharper.
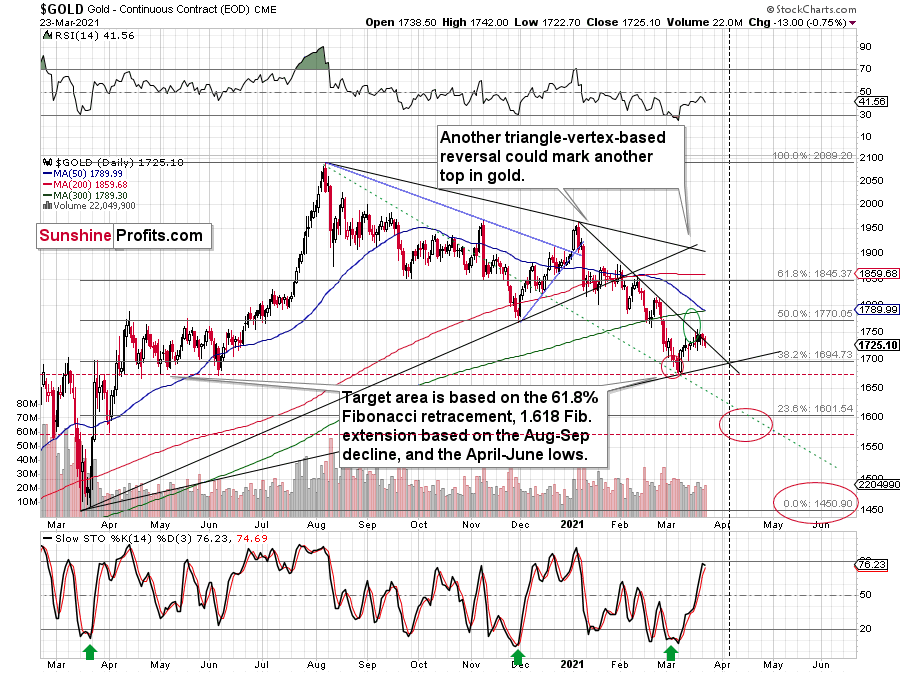
Gold seems to have topped in the lower part of my target area and the levels reached by its price as well as the levels reached by the stochastic indicator seem to indicate that the top is indeed in.
Gold reversed after failing to break above the declining short-term resistance line, relatively close to its triangle-vertex-based reversal, which is a bearish combination. The stochastic (lower part of the chart) didn’t move to the 80 level, but it was very close to it and it was the proximity of this level that was enough for the tops to form in quite a few previous cases – including the November 2020 top. Based on yesterday’s closing price, we didn’t see a sell signal in this indicator yet, but once we see just a little more weakness, we’ll get this confirmation. Based on what we saw in mining stocks yesterday, it seems that we’ll see it shortly.
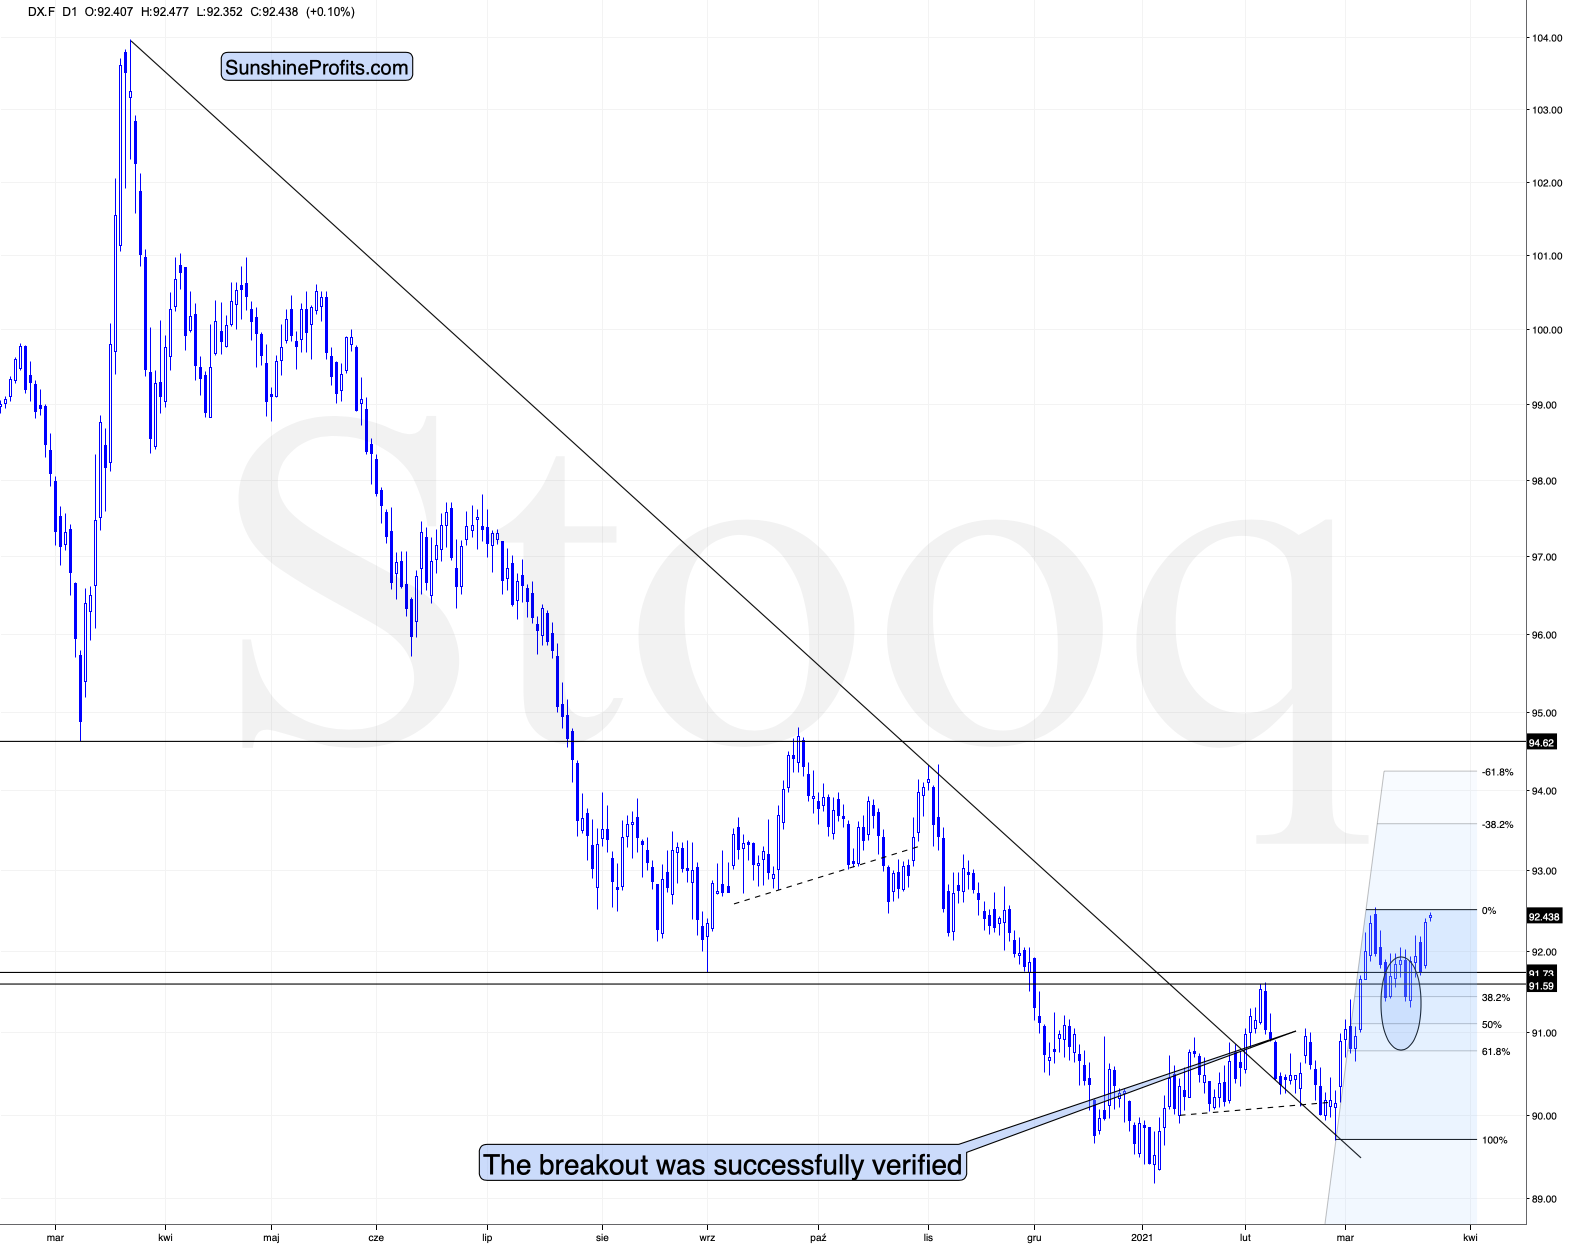
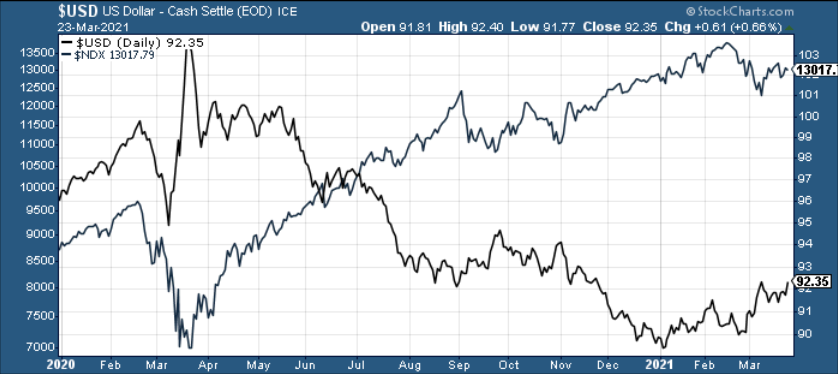
Right now, traders are likely taking the wait-and-see approach with regard to the USD Index. The latter just moved to its previous yearly highs. It’s already after verification of the breakout above the February highs, so it seems that it’s ready to break higher any day – or hour – now. When that happens, I expect the rally to take the USDX to at least 94, perhaps to 94.5 or 95. The September 2020 high is 94.8, so this level is the most likely upside target for the short term. I don’t think that the rally in the USD Index would end once it reaches the proximity of 95, but that’s when we might see another breather (perhaps after a breakout above this level and perhaps before the breakout, it’s too early to tell at this time).
All in all, it seems that the next move lower in the precious metals market is already underway and that we’re going to see new 2021 lows in gold and mining stocks in the next several weeks or days.
Having said that, let’s take a look at the market from a more fundamental angle.
All Stocked up
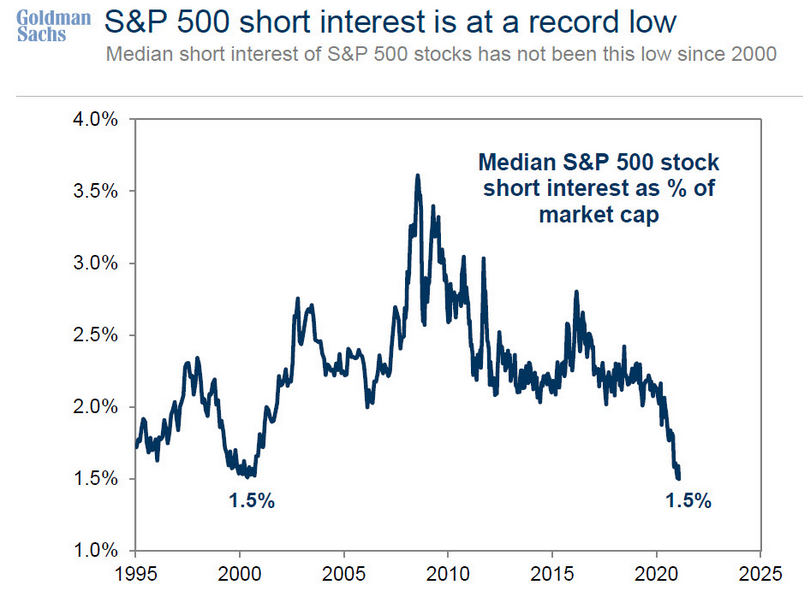
With U.S. equity investors continuing to dance with the devil, bears have essentially been exiled. On Feb. 10, I warned that S&P 500 short interest has hit its lowest level since the peak of the dot-com bubble. And continuing to move lower, the current reading is now a mirror-image of 2000.
Please see below:
For more context, I wrote previously:
Short-sellers are akin to airbags in your car. In the event of a crash, airbags serve their purpose by cushioning the blow. Similarly, when the market crashes, short-sellers cover their positions (by purchasing the underlying asset), helping to alleviate the downward impact.
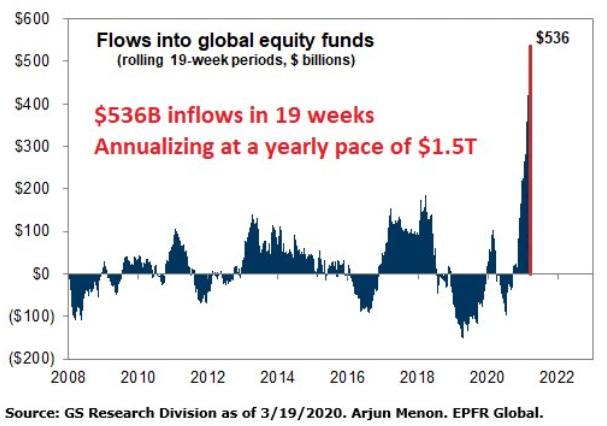
But with FOMO now a modern form of valuation, investors are piling into global equities at an unprecedented pace. Case in point: with $68 billion flowing into global equities last week, the reading was by-far the highest on record.
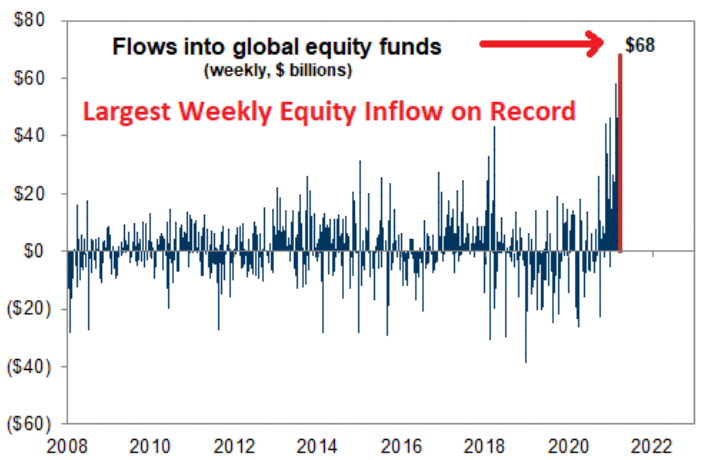 Source: GS Research
Even more pronounced, the 19-week rolling average highlights just how abnormal investor positioning has become. If you analyze the chart below, you can see that the current spike absolutely dwarfs any other comparable since 2008.
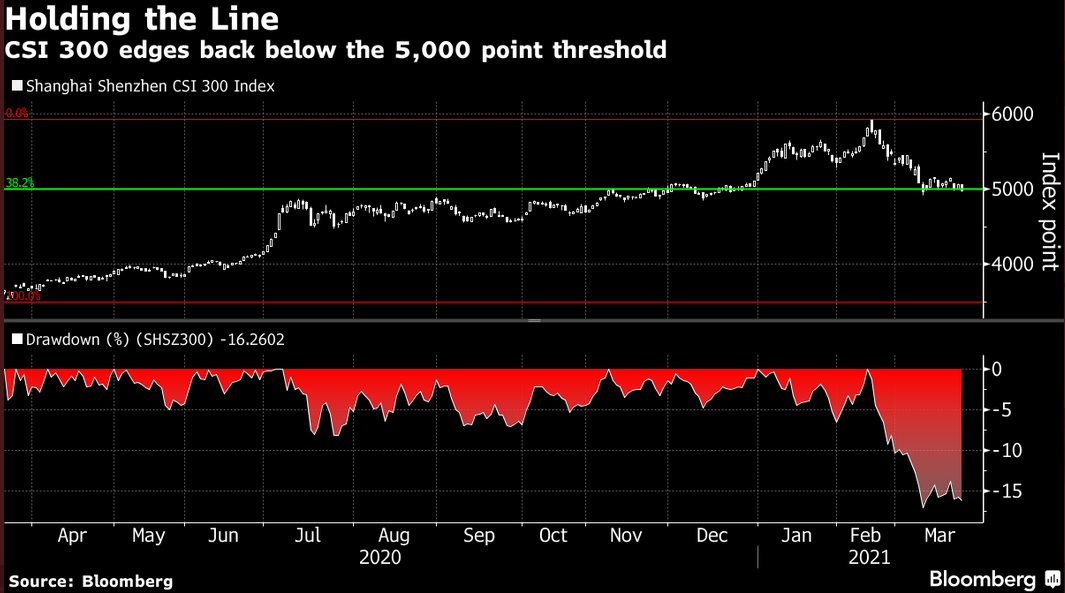
Furthermore, investors continue to ignore warnings from other markets. Falling by more than 14% from its February peak, China’s CSI 300 – which replicates the performance of the largest 300 stocks listed on the Shanghai and Shenzhen Stock Exchanges – has seen investors exit everything from raw materials to e-cigarette stocks. Furthermore, the CSI 300 is currently dangling at the 38.2% Fibonacci retracement level (the green line below), a key level of technical support.
And because foreign markets aren’t the only variables sounding the alarm, Citigroup’s Economic Surprise Index – which measures whether economic indicators are outperforming or underperforming consensus estimates – has been in free fall since its June peak.
Please see below:
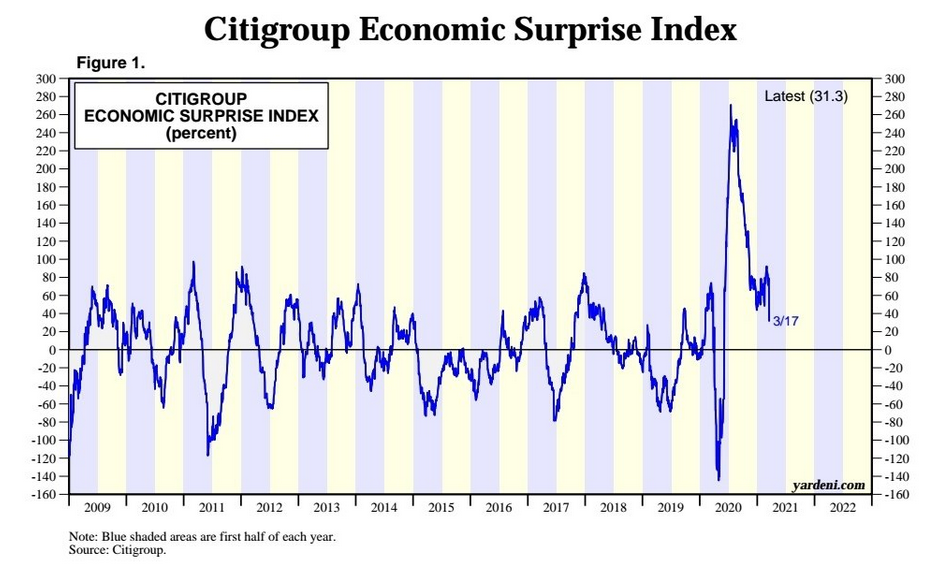
To explain, the sharp move higher on the right side of the chart occurred when depressed economic forecasts – due to the coronavirus pandemic – gave way to stronger ex-post results. However, because the original bounce was underpinned by unprecedented stimulus, soon after, the index completely rolled over. Thus, with everyone and their mother forecasting an economic renaissance in 2021, incoming data will likely also disappoint.
But what could really be the canary in the coal mine, corporate bonds are often equities’ kryptonite. Why so? Well, because equities are at the bottom of the capital structure, they often take their cues from assets that have higher bankruptcy protection. For example, senior secured bonds have the highest priority, while in fixed-income land, high yield bonds have the lowest priority. And because additional rates of interest are meant to compensate for the excess risk, high yield bonds often have wider corporate ‘credit spreads.’
On Mar. 5, I wrote:
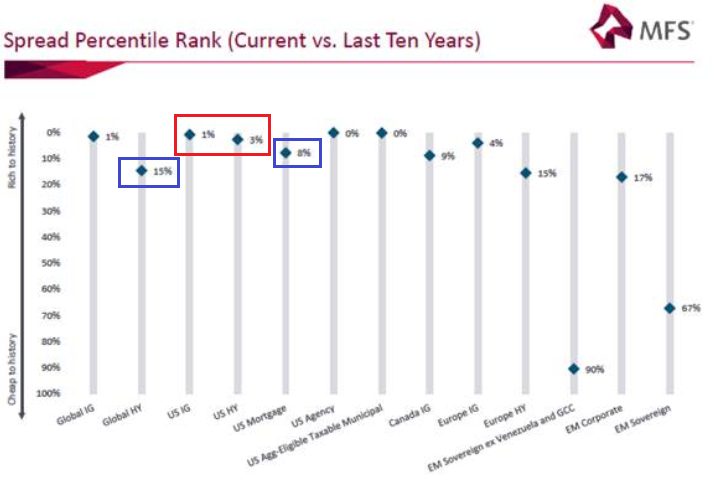
If you analyze the visual above, you can see that corporate spreads have begun to widen (increase). To explain, the blue diamonds above depict the percentile rank of current corporate spreads relative to their 10-year history. And despite U.S. investment grade (IG) and U.S. high yield (HY) spreads being extremely low (the red box above), global high yield spreads have risen to the 15th percentile, while U.S. mortgage spreads have risen to the 8th percentile (the blue boxes above).
A symptom of the U.S. Federal Reserve’s (FED) liquidity-induced daze, U.S. high yield credit spreads are in the 3rd percentile relative to their 10-year history. For context, the reading implies that U.S. high yield credit spreads were either equal to, or less than, their current rank 3% of the time over the last decade.
But with the USD Index’s ability to turn things upside down, U.S. high yield credit spreads could be about to sneak up on investors.
Please see below:
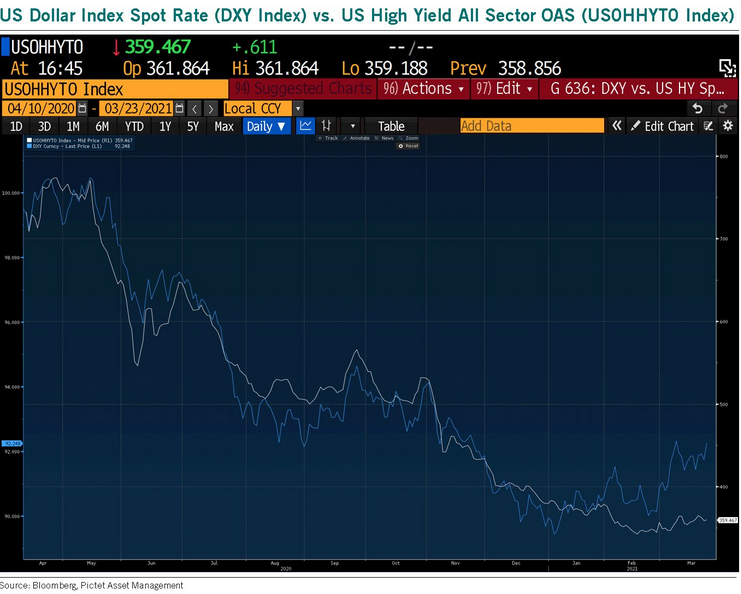
To explain, U.S. high yield credit spreads tend to track the performance of the USD Index. On a downward spiral since April 2020, if you analyze the right side of the chart, you can see that the USD Index has already begun to decouple. Thus, if U.S. high yield credit spreads follow, the move will likely raise alarm bells across U.S. equities.
As further evidence of the USD Index’s influence, the iShares MSCI Emerging Markets Index ETF (XEM) exhibits a strong negative correlation with the greenback. Case in point: the rolling 120-day correlation is currently – 0.74 (the red circle below).
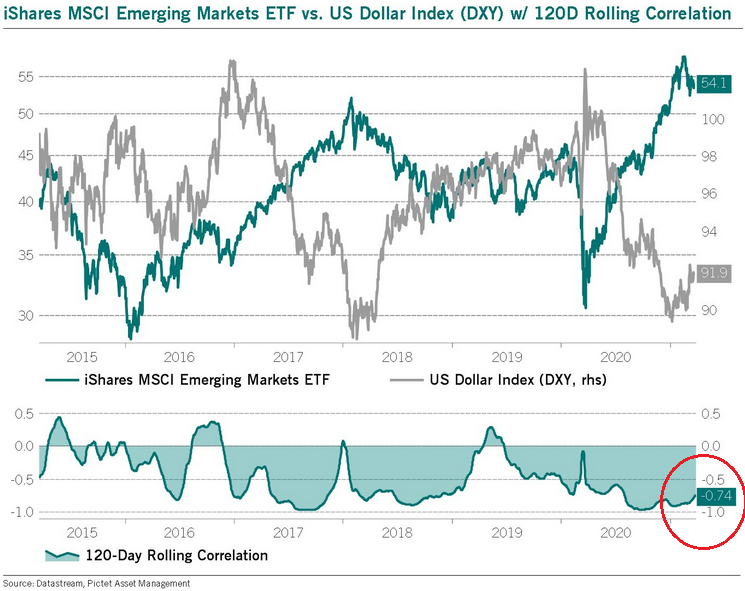
And why is this the case?
Well, because the majority of global trade is conducted in U.S. dollars and dollar-denominated debt held by foreign corporates is extremely high, when the greenback strengthens, not only does it increase EM corporate’s input costs, it also increases their outstanding debt obligations and their quarterly interest expenses (on a currency-adjusted basis, due to the conversion rate).
Thus, while the relationship doesn’t directly affect U.S. companies, it has an indirect effect due to weaker global economic growth, lower global profitability, rising global credit spreads and the financial-market stress that often coincides when the former three occur.
As another potential headwind, the U.S. Federal Deficit as a percentage of GDP (~15%) ended 2020 at its highest level since 1945.
Please see below:
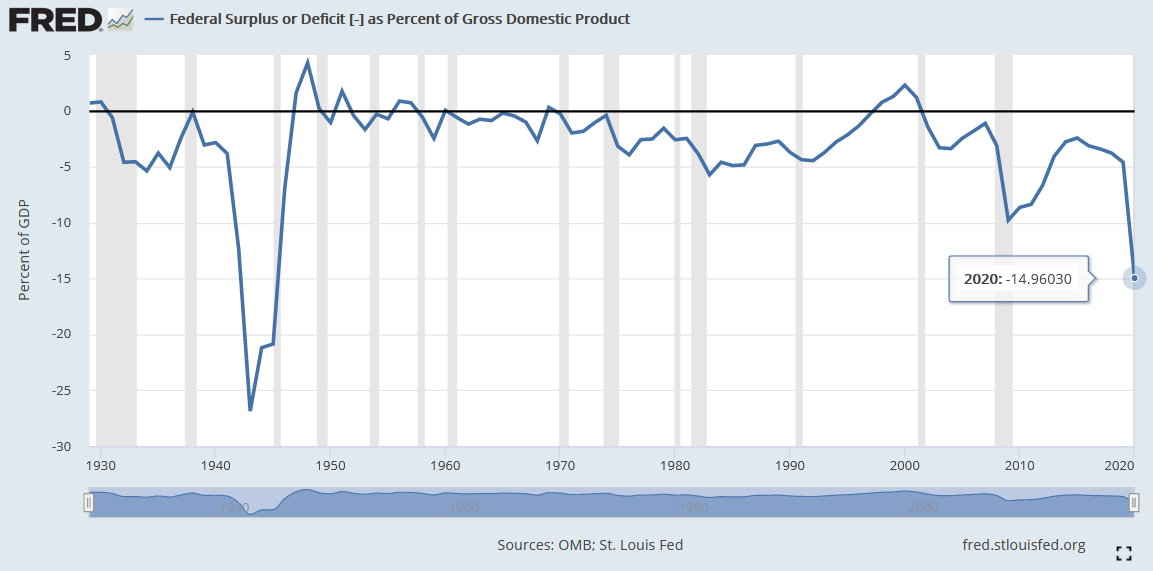
Now … if 2020 has taught us anything, it’s that investors don’t care about debt.
However, to finance these immense obligations, U.S. President Joe Biden pledged to raise the corporate tax rate and ensure that wealthy citizens pay their fair share.
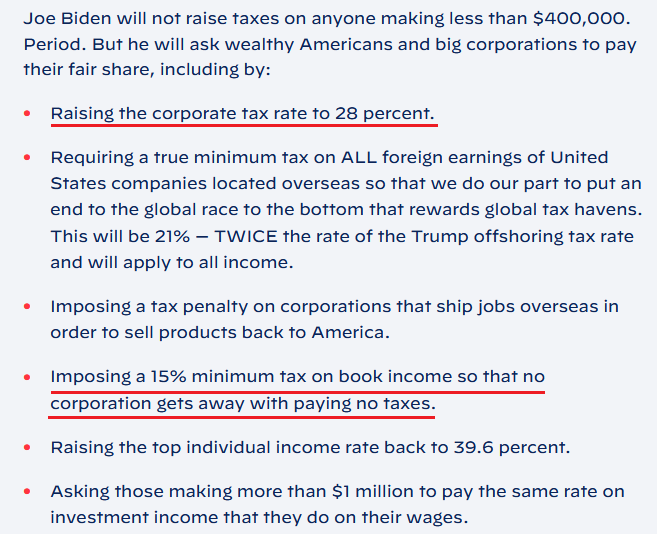 Source: JoeBiden.com
And speaking before U.S. Congress on Mar. 23, U.S. Treasury Secretary Janet Yellen hinted that raising the corporate tax rate will be a necessary evil in order to shrink the deficit.
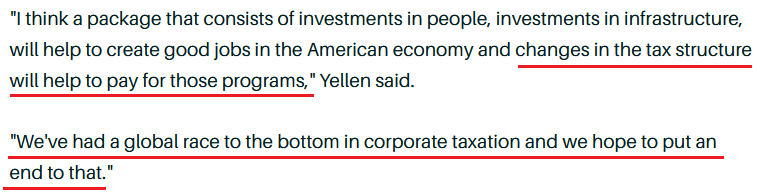 Source: Barrons
To that point, a group of 250 CEO’s actually sent a letter to New York Governor Andrew Cuomo on Mar. 22, urging the Democratic lawmaker not to increase state income taxes. The group included JPMorgan CEO Jamie Dimon, Citigroup CEO Jane Fraser, Morgan Stanley CEO James Gorman and BlackRock Chairman Larry Fink. As a result, Wall Street heavyweights are behaving like the writing is already on the wall.
Turning to the PMs, equity-market stress often elicits a negative response. If you analyze the table below, you can see that NASDAQ 100 drawdowns of more than 2.00% tend to unnerve the PMs. Moreover, if you exclude silver’s short squeeze on Jan. 29 and the NASDAQ 100’s relatively ‘quiet’ 2.63% drawdown on Feb. 22, bouts of equity volatility significantly impact the PMs (especially the miners).
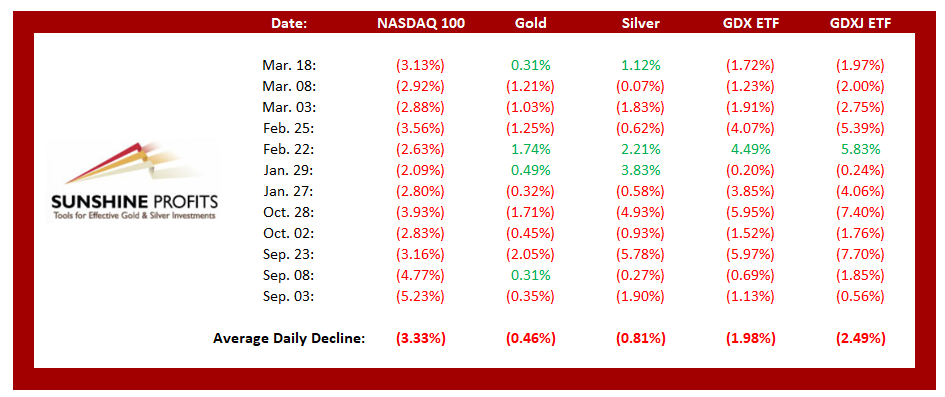
In addition, because equity volatility often coincides with a surging USD Index (and vice versa), the dynamic is a double-edged sword for the PMs.
If that wasn’t enough, non-commercial (speculative) futures traders are unwinding their EUR/USD longs at a frantic pace. Shedding nearly 12,000 contracts last week, speculators have reduced their EUR/USD long positions by 32,644 contracts since Mar. 2 and increased their EUR/USD short positions by 15,745 contracts. And remember, the EUR/USD accounts for nearly 58% of the movement of the USD Index.
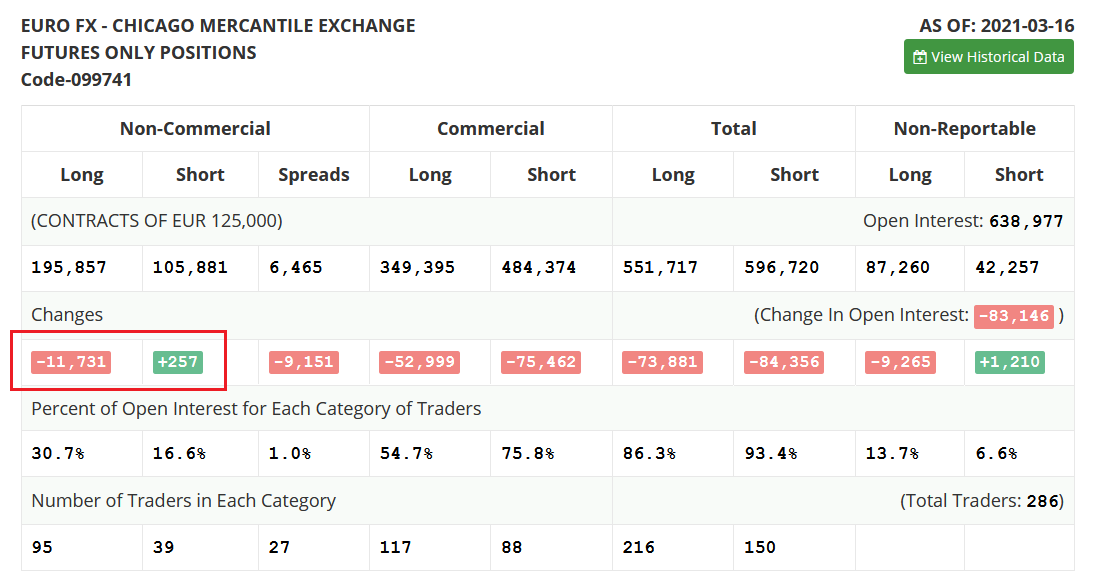 Source: COT
In conclusion, the PMs’ weakness on Mar. 23 is likely to persist. With water boiling beneath the surface of the currency market, the bond market and the stock market, a reversal of historical anomalies could be particularly unkind to the PMs. Thus, with a buying opportunity likely to present itself in the coming months, patience is a virtue. However, until the USD Index has its say, being long the PMs offers more risk than reward.
Overview of the Upcoming Part of the Decline
- It seems to me that we are already after the initial bottom and the initial correction. If not, then it seems likely to me that the corrective upswing will be completed within a week. It’s more likely that the next big move lower is already underway, though.
- After miners slide once again in a meaningful and volatile way, but silver doesn’t (and it just declines moderately), I plan to switch from short positions in miners to short positions in silver (this could take another 1-2 weeks to materialize). I plan to exit those short positions when gold shows substantial strength relative to the USD Index, while the latter is still rallying. This might take place with gold close to $1,450 - $1,500 and the entire decline (from above $1,700 to about $1,475) would be likely to take place within 1-12 weeks and I would expect silver to fall hardest in the final part of the move. This moment (when gold performs very strongly against the rallying USD and miners are strong relative to gold – after gold has already declined substantially) is likely to be the best entry point for long-term investments in my view. This might happen with gold close to $1,475, but it’s too early to say with certainty at this time. In other words, the entire decline could take between 1 and 12 weeks, while silver declines particularly fast in the final 1-2 weeks.
- If gold declines even below $1,500 (say, to ~$1350 or so), then it could take another 10 weeks or so for it to bottom, but this is not what I view as a very likely outcome.
- As a confirmation for the above, I will use the (upcoming or perhaps we have already seen it?) top in the general stock market as the starting point for the three-month countdown. The reason is that after the 1929 top, gold miners declined for about three months after the general stock market started to slide. We also saw some confirmations of this theory based on the analogy to 2008. All in all, the precious metals sector would be likely to bottom about three months after the general stock market tops . If the mid-February 2020 top was the final medium-term top, then it seems that we might expect the precious metals sector to bottom in mid-May or close to May’s end.
- The above is based on the information available today and it might change in the following days/weeks.
Letters to the Editor
Q: Thank you for all your analysis. I am a tech geek when it comes to charts, but the analysis you provide goes so far beyond what I would be doing if I were looking at the charts on my own. So, thanks.
I have a question regarding silver. When you intend to switch from gold to silver, which instrument will you be using on your updates? I have looked at the list of ETFs and such but there are so many to look at. I realize you cannot give specific analysis on all the various options and I have enjoyed the detailed material on the GDX; it has been great. But which silver instrument do you plan on using for the daily analysis, as you are currently doing for gold, namely using the GDX?
A: Thank you, I very much appreciate your kind words. On a side note, I’m not taking my own “tech geekiness” to the extreme (I hope), but I did discover a few gadgets that you (or other readers) might find useful. The things that I’m trying to optimize for are happiness, focus, and productivity, and two gadgets that I found useful are the Muse band and Touchpoint wristbands. The former is based on a pretty advanced tech, while the latter seems quite simple, but both seem to work. I’m not affiliated with those companies in any way (no referral program, etc.)
Moving on to your question about silver, I will continue to use the silver continuous futures contract and the SLV ETF in my analyses. When we have positions in silver, I will be most likely providing trading indications (profit-take and perhaps stop-loss level if one is justified in my view) for silver’s continuous contract as well as for a leveraged instrument that one could use if they seek leverage.
I would like to emphasize that I’m using the GDX as a proxy for gold stocks, not for gold. Well, indirectly, the GDX is in a way also a proxy for gold, but it’s not a clear one. A clear proxy for gold would be, for example, the GLD ETF, which I’m also using from time to time, if I need to compare moves in gold and gold miners and I want to have the same exchanges and opening/closing hours on both.
The price analysis is more informative in case of silver’s continuous futures contract than in the case of any ETF (in most cases), because it’s trading almost 24h/day. By looking at just the U.S.-trading ETFs, we would be missing most of the price action. Every now and then there are indications from volume, or we might see a specific similarity in the ETFs like SLV or GLD, but in most cases, the price itself is most important.
If there was a continuous futures contract for mining stocks that would be popular and liquid, I’d use it for my analysis. But there is none, so I’m using the GDX. In case of more long-term moves, I’m usually using the HUI Index, because the GDX has some fees that can distort the technical picture in the long run (the tiny daily fees add up over the course of the years). In the case of very long-term moves, I’m usually using the XAU Index, as it’s been trading for even longer than the HUI. XAU includes both gold and silver, so comparing it to gold is not a clear apples-to-apples comparison, though.
Q: Hi PR,
One word: “Geez there are some negative bloody people in the world” :). I profited from your call of going long. Thank you. I wouldn’t have been able to make that call myself. Thank you again.
By the way, I don’t short gold or silver as I am a relatively new investor with not much of an idea. I trust your analysis though – I am a gold bull and would be lost without your analysis. I cashed in as previously mentioned when you called a top in gold around August of last year and have learnt to be patient, and I am waiting for a bottom to be called. I know gold and silver may fall significantly from here, from your analysis. You already predicted it to fall from well over 1950 to 1700 and people were laughing at that call.
Thank you for all of your effort. Btw, I have a brand-new Fat Boy Harley on its way from Milwaukee and will send a photo of the bike when it arrives. Your team had a lot to do with the purchase. I am learning as a new investor to be patient – very patient.
Thanks again.
Glenn.
A: That’s awesome! I’m very happy that the results of our work have contributed to your new Fat Boy and the upcoming experiences that you’re going to have with it. I was in the Milwaukee Harley Museum a few years ago where I checked out multiple motorcycles – all beautiful, but the Fat Boy model was one of those that caught my eye for longer than others.
The above doesn’t include a question, but I’m adding it to the “Letters” section to show that it’s perfectly fine not to participate in a given shorting opportunity if one doesn’t feel confident in it – and still reap profits in the long run – for instance, by re-entering the long positions at more favorable prices.
On a side note, whenever I get a message from someone who is concerned about their investments, I don’t really view it as “negative” per se. People have different risk tolerance levels, and some are more emotional than others (which is not a bad thing either - it might make investing somewhat more difficult, but it can make other things much better), so it’s natural that every now and then I will be getting messages from people who are worried about the status of their savings. It’s perfectly fine.
Summary
To summarize, the PMs’ medium-term decline is well underway, and based on the recent performance of the USD Index, gold and mining stocks, it seems that the corrective upswing is already over (or about to be over). The next big move lower seems to be already underway or about to start.
In addition, because we’re likely entering the “winter” part of the Kondratiev cycle (just like in 1929 and then the 1930s), the outlook for the precious metals’ sector remains particularly bearish during the very first part of the cycle, when cash is king.
The confirmed breakout in the USD Index is yet another confirmation of the bearish outlook for the precious metals market.
After the sell-off (that takes gold to about $1,450 - $1,500), we expect the precious metals to rally significantly. The final part of the decline might take as little as 1-5 weeks, so it's important to stay alert to any changes.
Most importantly, please stay healthy and safe. We made a lot of money last March and it seems that we’re about to make much more on this March decline, but you have to be healthy to enjoy the results.
As always, we'll keep you - our subscribers - informed.
By the way, we’re currently providing you with a possibility to extend your subscription for a year, two years or even three years with a special 20% discount. This discount can be applied right away, without the need to wait for your next renewal – if you choose to secure your premium access and complete the payment upfront. The boring time in the PMs is definitely over and the time to pay close attention to the market is here. Naturally, it’s your capital, and the choice is up to you, but it seems that it might be a good idea to secure more premium access now, while saving 20% at the same time. Our support team will be happy to assist you in the above-described upgrade at preferential terms – if you’d like to proceed, please contact us.
To summarize:
Trading capital (supplementary part of the portfolio; our opinion): Full speculative short positions (300% of the full position) in mining stocks are justified from the risk to reward point of view with the following binding exit profit-take price levels:
Mining stocks (price levels for the GDXJ ETF): binding profit-take exit price: $24.12; stop-loss: none (the volatility is too big to justify a stop-loss order in case of this particular trade)
Alternatively, if one seeks leverage, we’re providing the binding profit-take levels for the JDST (2x leveraged) and GDXD (3x leveraged – which is not suggested for most traders/investors due to the significant leverage). The binding profit-take level for the JDST: $39.87; stop-loss for the JDST: none (the volatility is too big to justify a SL order in case of this particular trade); binding profit-take level for the GDXD: $94.87; stop-loss for the GDXD: none (the volatility is too big to justify a SL order in case of this particular trade).
For-your-information targets (our opinion; we continue to think that mining stocks are the preferred way of taking advantage of the upcoming price move, but if for whatever reason one wants / has to use silver or gold for this trade, we are providing the details anyway.):
Silver futures upside profit-take exit price: unclear at this time - initially, it might be a good idea to exit, when gold moves to $1,512.
Gold futures upside profit-take exit price: $1,512.
Long-term capital (core part of the portfolio; our opinion): No positions (in other words: cash
Insurance capital (core part of the portfolio; our opinion): Full position
Whether you already subscribed or not, we encourage you to find out how to make the most of our alerts and read our replies to the most common alert-and-gold-trading-related-questions.
Please note that we describe the situation for the day that the alert is posted in the trading section. In other words, if we are writing about a speculative position, it means that it is up-to-date on the day it was posted. We are also featuring the initial target prices to decide whether keeping a position on a given day is in tune with your approach (some moves are too small for medium-term traders, and some might appear too big for day-traders).
Additionally, you might want to read why our stop-loss orders are usually relatively far from the current price.
Please note that a full position doesn't mean using all of the capital for a given trade. You will find details on our thoughts on gold portfolio structuring in the Key Insights section on our website.
As a reminder - "initial target price" means exactly that - an "initial" one. It's not a price level at which we suggest closing positions. If this becomes the case (like it did in the previous trade), we will refer to these levels as levels of exit orders (exactly as we've done previously). Stop-loss levels, however, are naturally not "initial", but something that, in our opinion, might be entered as an order.
Since it is impossible to synchronize target prices and stop-loss levels for all the ETFs and ETNs with the main markets that we provide these levels for (gold, silver and mining stocks - the GDX ETF), the stop-loss levels and target prices for other ETNs and ETF (among other: UGL, GLL, AGQ, ZSL, NUGT, DUST, JNUG, JDST) are provided as supplementary, and not as "final". This means that if a stop-loss or a target level is reached for any of the "additional instruments" (GLL for instance), but not for the "main instrument" (gold in this case), we will view positions in both gold and GLL as still open and the stop-loss for GLL would have to be moved lower. On the other hand, if gold moves to a stop-loss level but GLL doesn't, then we will view both positions (in gold and GLL) as closed. In other words, since it's not possible to be 100% certain that each related instrument moves to a given level when the underlying instrument does, we can't provide levels that would be binding. The levels that we do provide are our best estimate of the levels that will correspond to the levels in the underlying assets, but it will be the underlying assets that one will need to focus on regarding the signs pointing to closing a given position or keeping it open. We might adjust the levels in the "additional instruments" without adjusting the levels in the "main instruments", which will simply mean that we have improved our estimation of these levels, not that we changed our outlook on the markets. We are already working on a tool that would update these levels daily for the most popular ETFs, ETNs and individual mining stocks.
Our preferred ways to invest in and to trade gold along with the reasoning can be found in the how to buy gold section. Furthermore, our preferred ETFs and ETNs can be found in our Gold & Silver ETF Ranking.
As a reminder, Gold & Silver Trading Alerts are posted before or on each trading day (we usually post them before the opening bell, but we don't promise doing that each day). If there's anything urgent, we will send you an additional small alert before posting the main one.
Thank you.
Przemyslaw Radomski, CFA
Founder, Editor-in-chief

