

Briefly: in our opinion, full (300% of the regular position size) speculative short positions in mining stocks are justified from the risk/reward point of view at the moment of publishing this Alert.
What a difference a few hours can make! During yesterday’s (Mar. 11) early hours I was writing how gold is showing strength given what’s going on in gold, only to report to you exactly the opposite a few hours before the end of yesterday’s session. Does it mean that the markets are erratic and unpredictable?
No, it doesn’t mean that, even though it’s not possible to predict the market’s each and every move. What it means is that the sentiment has likely shifted and this change in gold’s relative performance is exactly what we saw when it ended it’s early 2018 correction (when the USDX ended its own pullback).
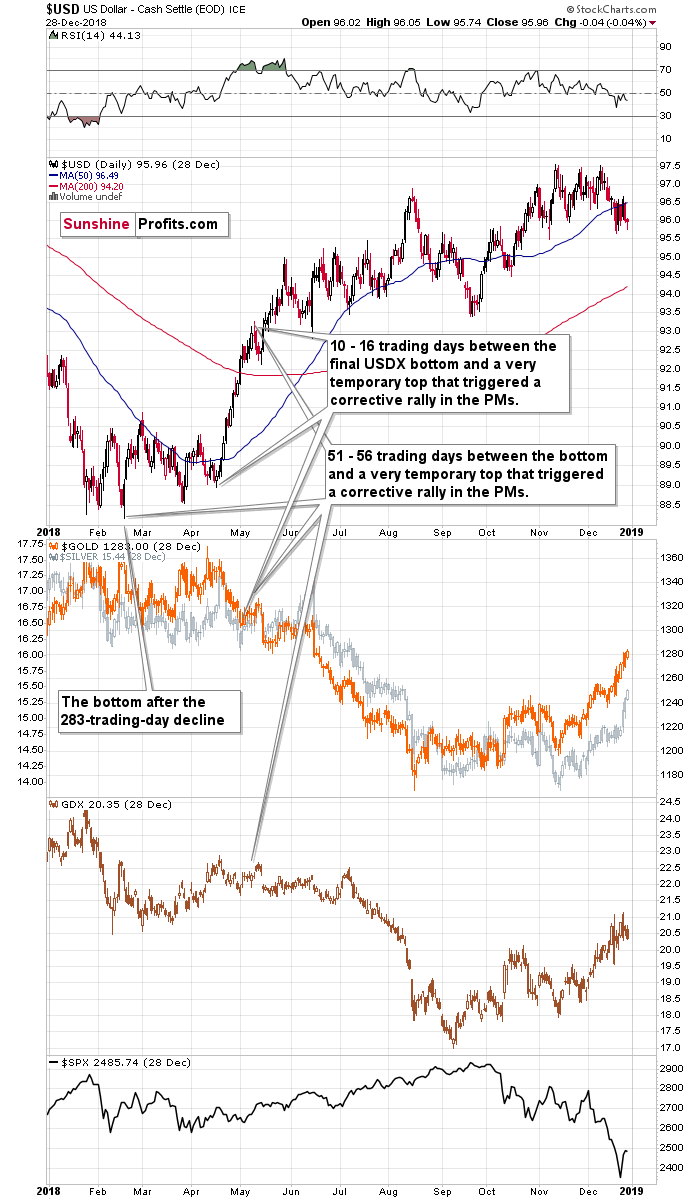
It might not be clearly visible on the above chart, but back in May 2018 gold topped one day before the USD Index bottomed. This means that it showed weakness relative to the USDX right before declining significantly. We saw the same thing yesterday.
Also, please note that the pullback in the USD Index took 4 trading days, and since the price moves are now (in 2020 and 2021) about 20% quicker than they were in 2017 and 2018, it would be natural to expect the pullback to take 3 trading days instead of 4. The decline ended when the USDX moved briefly below its previous low and then moved back up.
Well, the USD Index was in its third day of the decline yesterday and here’s what it did in the overnight trading.
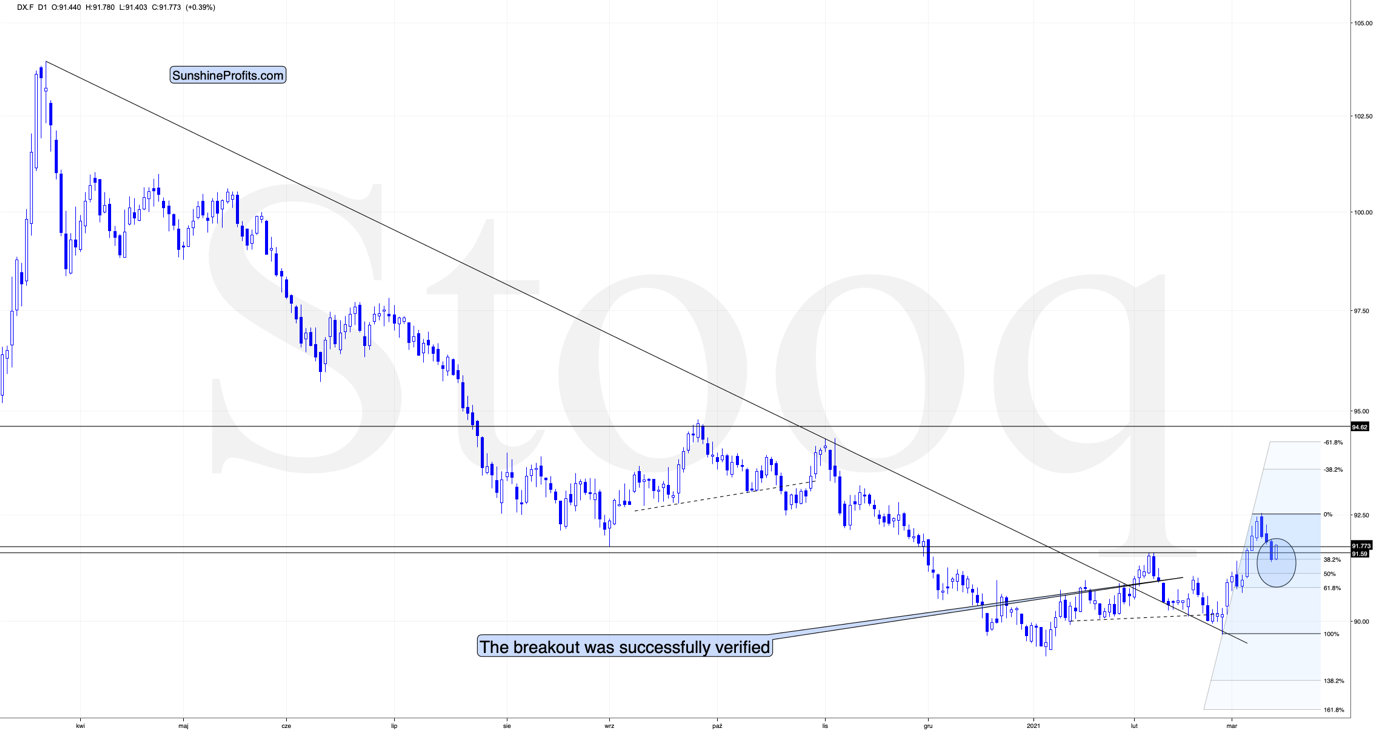
Yesterday, the USDX moved briefly below its February high and it reversed after touching the early-March high. In today’s overnight trading, it moved back above the February high, which means that the corrective decline might be completely over.
If so, then the precious metals market would be likely to decline without looking back.
And that’s what gold seems to be doing in the last couple of hours.
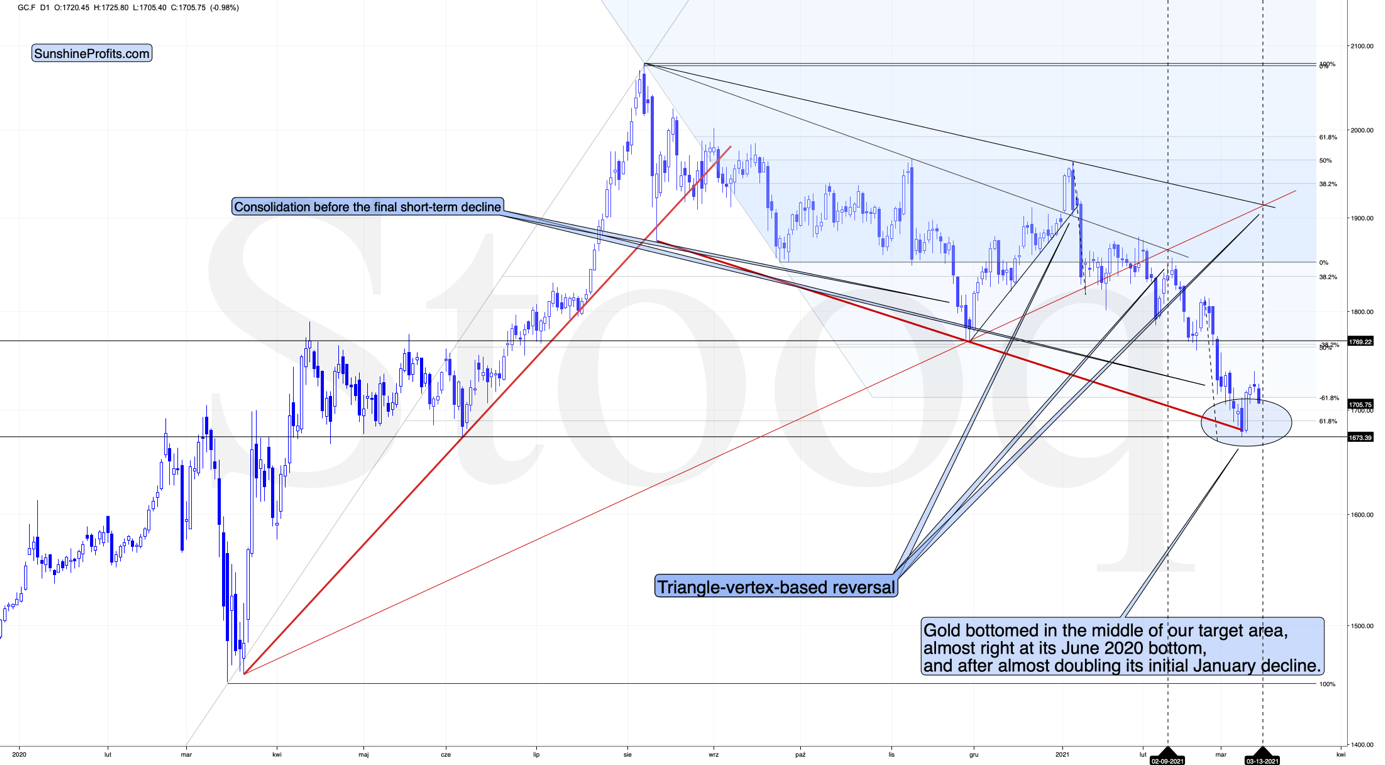
After forming a bearish reversal yesterday, gold declined. Was that the final short-term top?
It’s not crystal-clear, because gold didn’t reach any important resistance level yesterday. Still, if the USD Index completed its corrective upswing, gold’s likely to fall anyway.
Yes, there is the possibility that gold could rally along with the USD Index, and it did so many times in the past. However, just because it (relatively infrequently) happened in the past, doesn’t mean that’s it’s going to take place shortly. Conversely, based on yesterday’s reversal in gold despite the USD’s decline, we got an indication of the exact opposite. Gold is likely to magnify the USD’s movement but in the opposite direction. So far today, it’s been doing exactly that – the USDX is up by 0.45% while gold is down by 1.02%.
In yesterday’s intraday Gold & Silver Trading Alert, I wrote not only about the USD Index and gold’s relative performance, but also about other factors. One of them was the performance of the general stock market. I wrote the following:
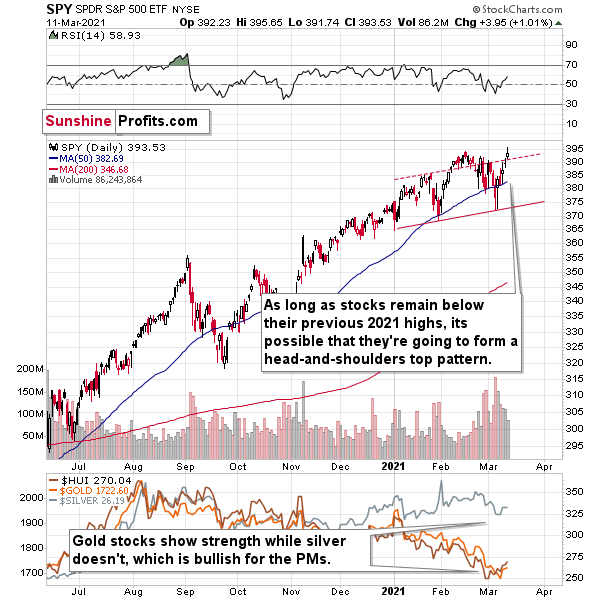
The general stock market was likely to rally, perhaps as high as to the rising line that’s parallel to the neckline of the hypothetical 2021 head and shoulders pattern. That’s exactly the line that it reached today.
Moreover, if this head-and-shoulders pattern is to be upheld, stocks (S&P 500) shouldn’t rally above its previous high and they just moved very close to it. Consequently – while it’s far from being certain – we might have just seen a top or one might be formed shortly.
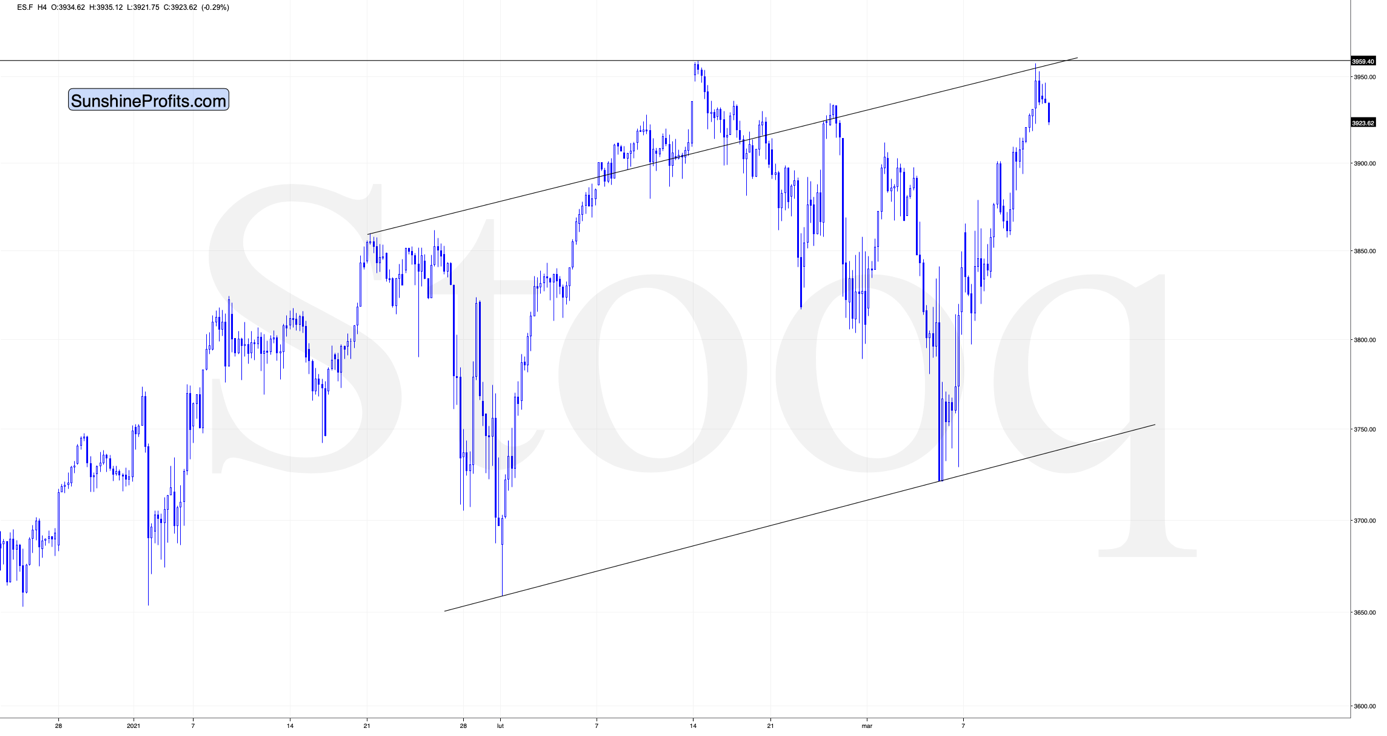
As you can see on the above chart, the S&P 500 futures (the above chart features the index futures, not the index) didn’t move to a new high and they reversed after moving to the combination of resistance provided by the rising resistance line and the previous high.
Consequently, we might have just seen a top in stocks, which would be the right shoulder of a medium-term head-and-shoulders pattern. The implications would be very bearish.
Then again, in case of the index (not futures) and in case of the SPY ETF, we actually saw moves to new highs yesterday.
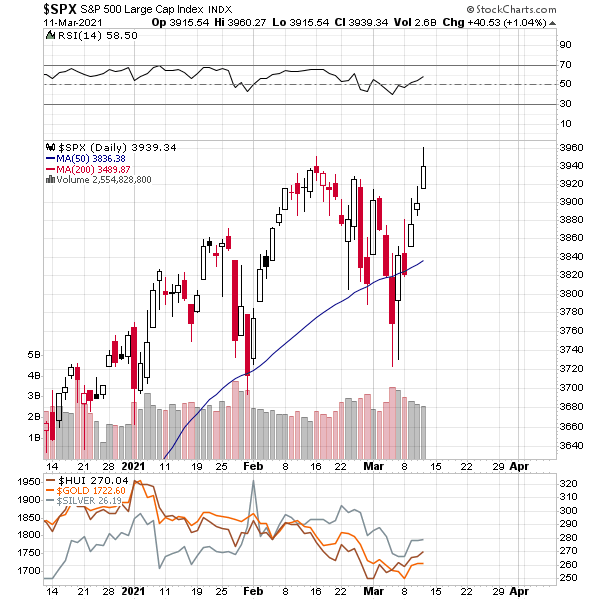
The move above the previous high was not big, but it was present. What happens next depends on today’s session. Based on the overnight futures movement, it seems that we might see an invalidation of the breakouts, which would be a sell signal for the index and for the SPY ETF.
However, it would mean that THE top in stocks was yesterday, and not about a month ago. This, in turn, means that the analogy to the previous declines might point to the final bottom in the precious metals market forming in mid-June or late-June instead of being formed in mid-May or late-May. As a reminder, it could be the case that PMs bottom about 3 – 3.5 months after the stock market tops.
Unfortunately, other indices don’t add much clarity.
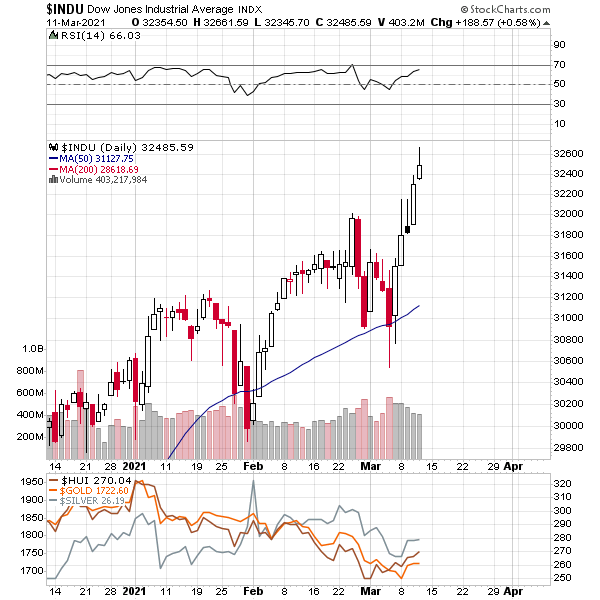
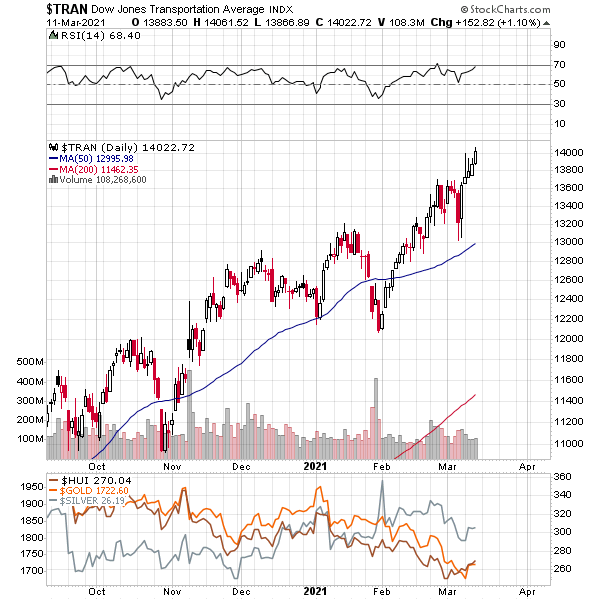
The Dow Jones Industrial and Transportation Averages soared to new highs yesterday.
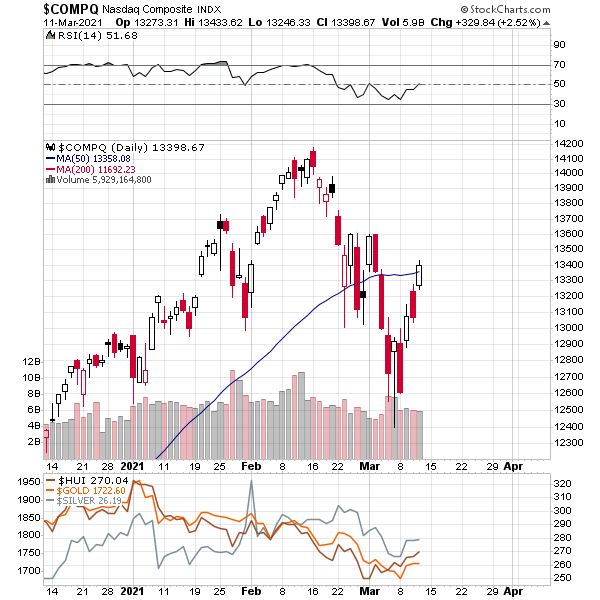
However, the NASDAQ – the previously strongest index – didn’t move to new highs and the rally that it generated this month was quite weak.
If the breakout in the S&P 500 Index is invalidated today, the implications will be bearish, but there’s no clarity regarding the implications regarding the 3-month time analogy. It seems to me that (as long as S&P 500 invalidates its breakout today) the mid-February date is more important as the topping date as that’s when the strongest market (tech stocks) topped.
It will be most important to measure gold’s relative strength compared to the USD Index as well as miners’ and silver’s relative strength to gold while watching the gold price levels, when determining the next major buying opportunity than to blindly trust the 3-3.5-month rule. Still, the latter might be a useful confirmation to the former.
The likelihood of seeing a top in the general stock market stems also from the fact that the USD Index is likely to rally further, thus making U.S. exports less competitive.
This, in turn, means that junior mining stocks and the ETFs based on them (e.g., the GDXJ ETF) are likely to decline more than senior mining stocks and their related ETFs (e.g., the GDX ETF).
Still, let’s take a look at charts featuring both.
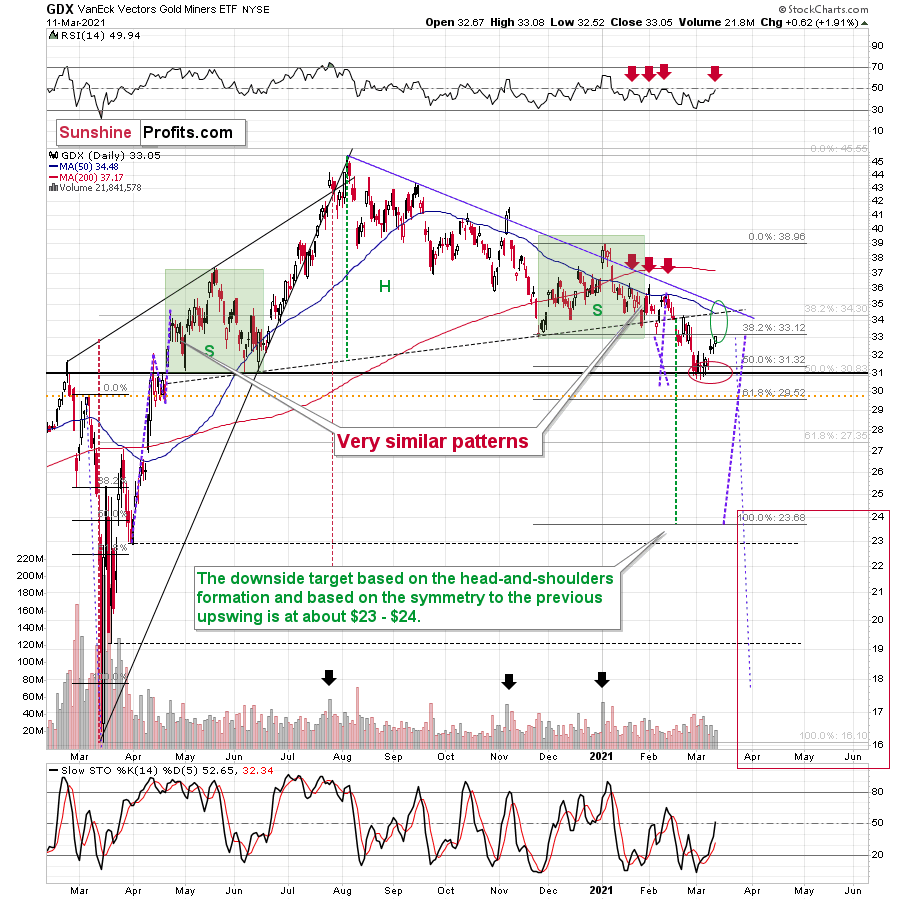
The GDX ETF didn’t move to the strongest combination of nearby resistance levels, but it did flash a few bearish signs, anyway.
The resistance that it reached was notable as it moved to its November 2020 low. Consequently, “it makes sense” for the mining stocks to have topped here.
In yesterday’s (Mar. 11) regular analysis, I wrote the following about the above chart:
Miners generally paused yesterday (Mar. 10), which is quite natural after a sharp daily rally. They closed the day slightly higher, but the RSI is not yet at 50 and the volume that accompanied yesterday’s small move up was nothing to call home about. It was just a pause, and the preceding short-term move is now likely to continue.
Yesterday’s volume was nothing to call home about, but the RSI moved to 49.94 – close enough to 50 to be viewed as a sell signal.
Moreover, please note that while spike-high volume would be a reversal indication, it’s not required for a top to form. The recent small tops formed without high volume.
Consequently, it could be the case that the top in the mining stocks is in, and that by selling GDX at $32.96 yesterday (March 11) we exited the long positions (and entered short ones) practically right at the top – a week after buying in the $30.80 - $31 area.
Before anyone asks, yes, miners were strong relative to gold yesterday, but it was practically the only thing that was positive about yesterday’s session and the USDX’s performance along with gold’s weakness seem more important.
Please keep in mind that every now and then miners very briefly (!) fake their strength (or weakness) relative to gold right before the reversal. The 2016 rally started with a fake breakdown and fake underperformance of gold. So, while the continuous underperformance of miners (compared to gold) is very often bearish, a single day of strength or weakness might be a trap.
How low can the GDX ETF go? Our final downside target area ($15 – $24.5) is quite broad, because a lot depends on what the general stock market will do. I’ll be looking at gold for the key signs along with a few other factors (including the Gold Miners Bullish Percent Index) and determined the buying opportunity based on them – not necessarily based on the price of the GDX or GDXJ by itself.
Yes, this target is quite low, and thus might appear unrealistic, but let’s consider the following:
- Miners are slightly above their early-2020 high – just like gold.
- Gold is likely to decline to its 2020 lows or so
- General stock market might have just topped.
Considering all three above factors it’s clear that a move to even the 2020 lows is not out of the question.
And this means that junior miners might decline more than senior miners. A move from the current levels to the 2020 would imply a decline by about 50% in case of the GDX, and by about 60% in case of the GDXJ.
Speaking of the GDXJ, let’s take a look at its chart.
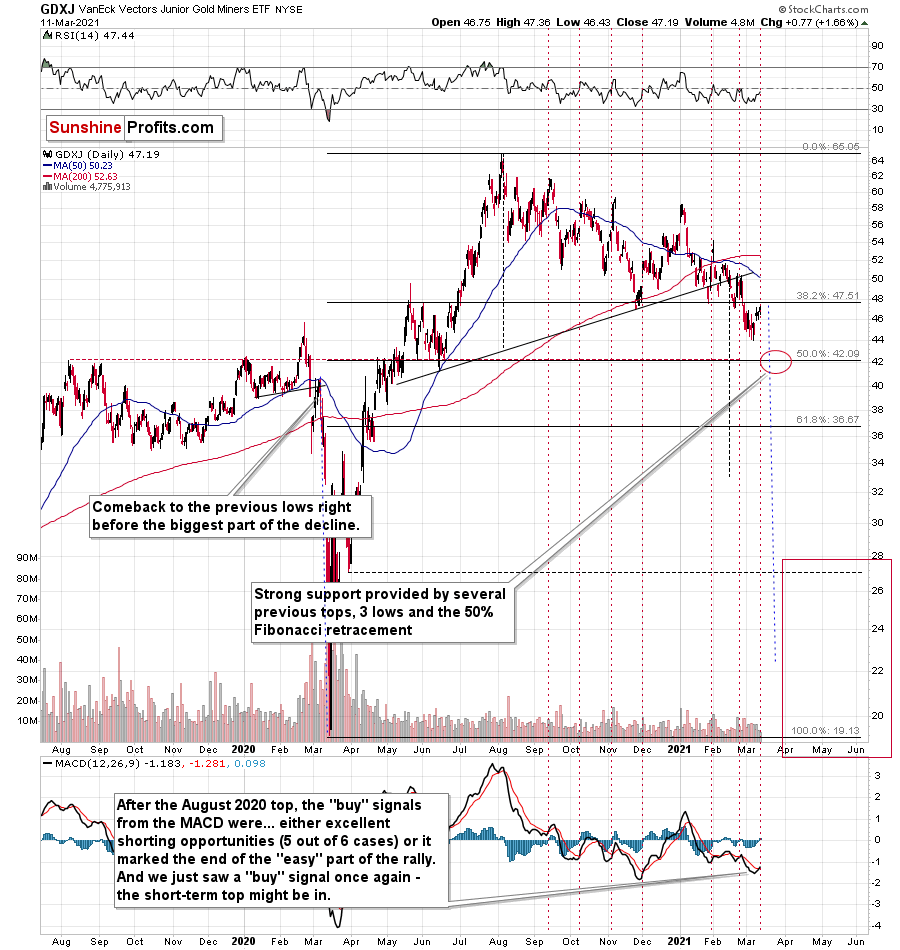
The most interesting thing on the above chart is a big red warning flag for beginner investors. The flag reads: “verify the efficiency of a given tool on a given market, before applying it”.
The bottom part of the above chart features the MACD indicator. Normally, when the indicator line (black) crosses its signal line (red), we have a signal. If it’s moves above the signal line, it’s a buy sign, and if it moves below it, it’s a sell sign.
But.
If one actually looks at what happened after the previous “buy signals” in the recent months, they will see that in 5 out of 6 cases, these “buy signals” practically marked the exact tops, thus being very effective sell signals! In the remaining case, it was a good indication that the easy part of the corrective upswing was over.
I’m not only describing the above due to its educational value, but because we actually saw a “buy signal” from the MACD, which was quite likely really a sell signal. Today’s pre-market decline in gold (and the move lower in the GDXJ in the London trading) seems to confirm it.
So, how low can the GDXJ go? As it is the case with the GDX, a lot depends on the general stock market and our final target area is quite broad (between $18 and $26), and the key indications will come from other markets and the way they behave relative to each other.
There’s an interim (and strong) support provided by the $42.5 level, which might trigger a corrective upswing, but since we have just seen one, it’s far from being certain that we’ll see another corrective upswing so soon. This could be another opportunity to profit on a long position in the gold miners, but we can’t say that we’ll definitely go long at that time – at least not based on the information that we have available right now. Naturally, we’ll keep monitoring the situation and send out regular (and intraday) Alerts with details as more information becomes available.
Having said that, let’s take a look at the market from the more fundamental angle.
Fundamental Frailty (Part 2)
As you’ve likely noticed, I spend a lot of time analyzing the EUR/USD – that’s because the currency pair accounts for nearly 58% of the movement in the USD Index. And due to Europe’s economic underperformance and the relative outprinting by the European Central Bank (ECB), a sharp rerating of the EUR/USD could be the engine that drives the USD Index back above 94.5
For some time, I’ve warned that the ECB’s bond-buying program was likely to accelerate. On Jan. 22, I wrote:
The ECB decreased its bond purchases toward the end of December (2020), Then, once January hit (2021), it was back to business as usual. As a result, the ECB’s attempt to scale back its asset purchases was (and will be) short-lived. And as the economic conditions worsen, the money printer will be working overtime for the foreseeable future.
And with Eurozone fundamentals continuing to deteriorate, I added on Mar. 9:
The ECB’s splurge could begin as early as this week. With Eurozone bond yields already on the rise and the debt-ridden economy unlikely to tolerate a sustained ascension, the ECB’s weekly PEPP purchases (pandemic emergency purchase program) are likely to accelerate.
And what happened?
Well, on Mar. 11, the ECB stuck another fundamental dagger into the heart of the euro. Lamenting the rise in European bond yields, ECB President Christine Lagarde told reporters that “market interest rates have increased since the start of the year, which poses a risk …. Sizeable and persistent increases in these market interest rates, when left unchecked, could translate into a premature tightening of financing conditions.”
And why is she so worried?
Well, if you analyze the chart below, you can see that Goldman Sachs’ Financial Conditions Index (FCI) has moved moderately higher. For context, the FCI is derived by calculating the weighted-average impact of the ECB’s overnight lending rate, sovereign bond yields, corporate bond spreads, equity prices and cross-border trade conditions.
Please see below:
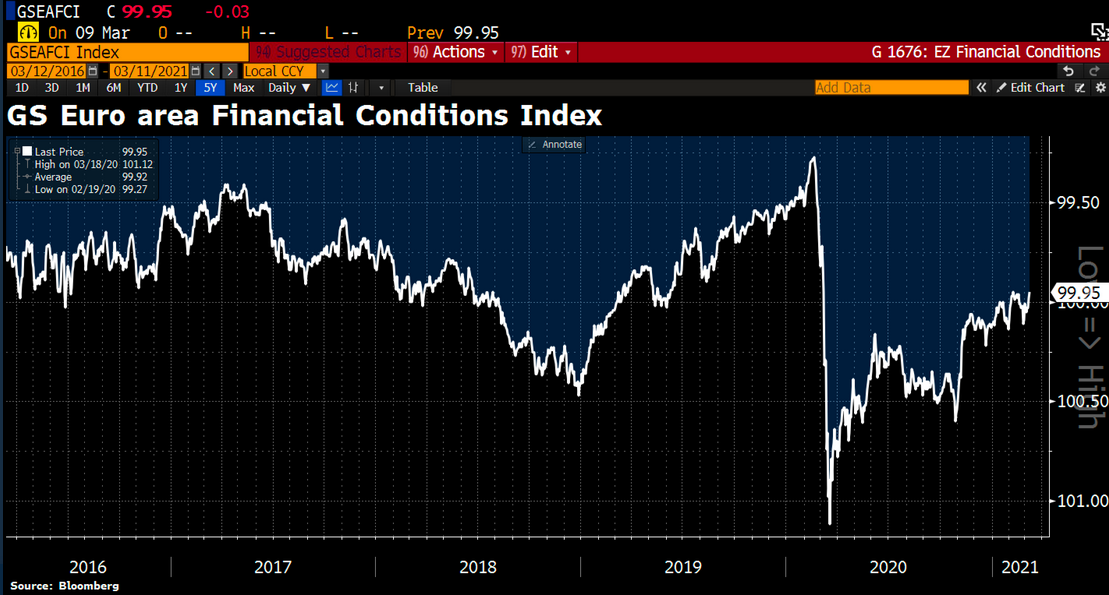
To explain, when the white line above is falling, it creates an environment where money is cheap, abundant and easy for corporations to obtain. Conversely, when the white line is rising, it creates the opposite environment. As you can see, excess liquidity has begun to evaporate.
So, what was the ECB’s response?
 Source: ECB
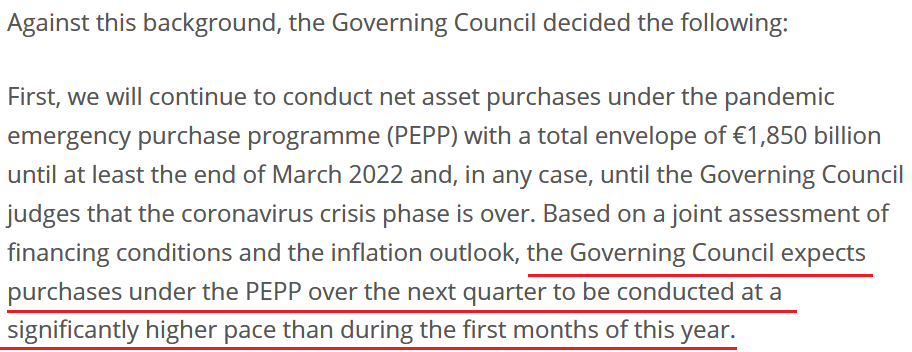
As expected, the ECB’s weekly PEPP purchases will now “be conducted at a significantly higher pace.”
Far from news for those that have been paying attention, Europe is extremely allergic to higher bond yields. Just yesterday, I wrote that rising Eurozone interest rates remain extremely unlikely. And because a picture is worth a thousand words, notice the reaction from the German 10-Year Government Bond yield?
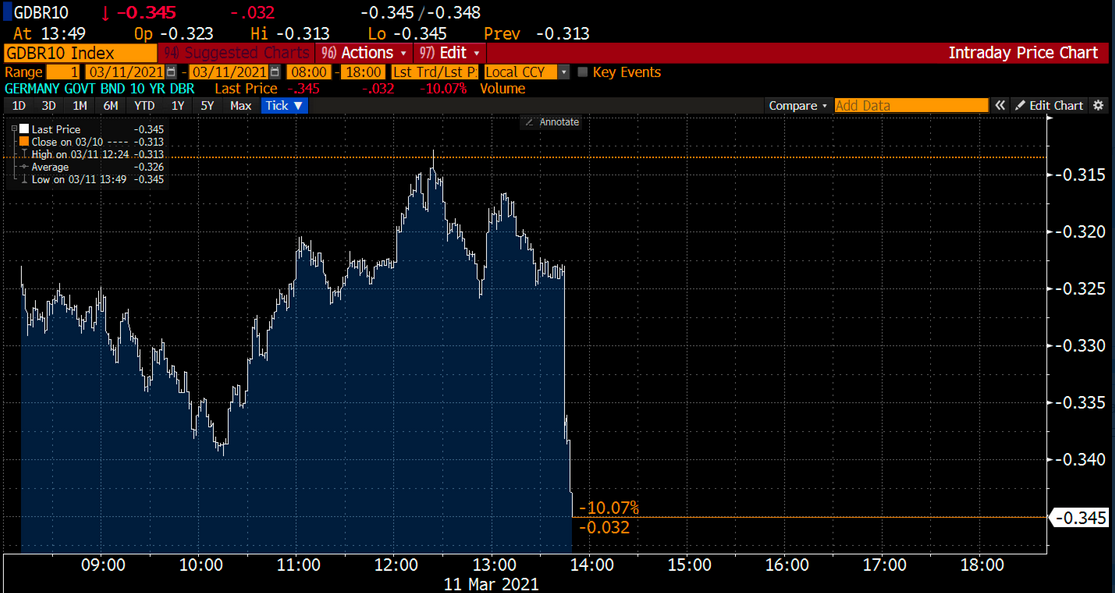 Source: Holger Zschaepitz
Moving in lockstep, the Italian 10-Year Government Bond yield also followed suit.
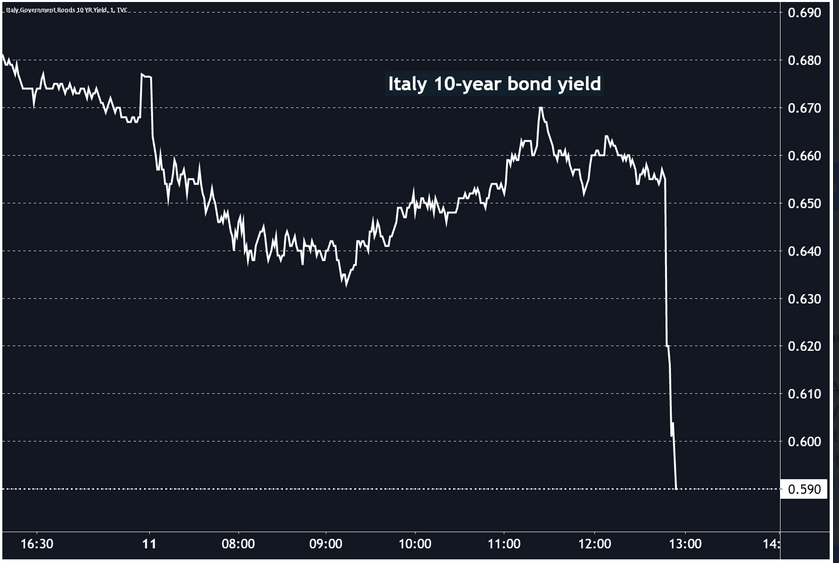 Source: Jeroen Blokland
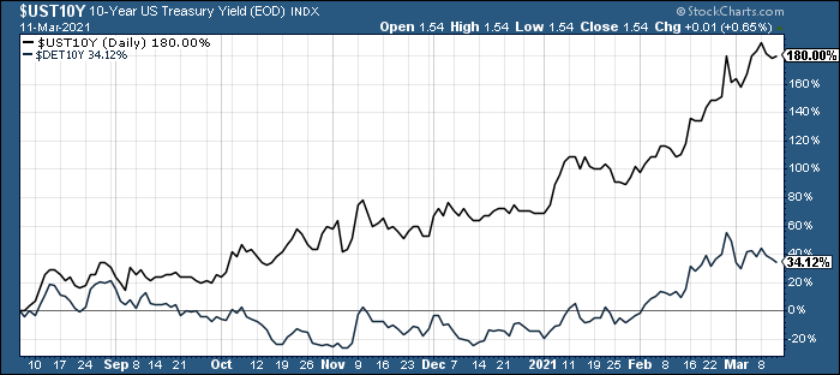
In stark contrast, the U.S. 10-Year Treasury yield actually rallied on Mar. 11. And demonstrating material outperformance, since bottoming on Aug. 6, the benchmark has raced past the German 10-Year Government Bond yield.
Please see below:
What’s more, European lawmakers seem to believe that an economic resurgence is forthcoming. Projecting 3.8% GDP growth in 2021 – headlined by 5.5% growth in France (Europe’s second-largest economy behind Germany) – European officials believe that fiscal support will unleash pent-up demand once the coronavirus pandemic subsides.
For context, I wrote on Feb. 11:
Wishing, wanting and hoping, European lawmakers anticipate that more than €300 billion in excess household savings will lead to an economic renaissance in 2021. However, when you break it down, the balance only amounts to 4% of annual household income. Thus, the short-term bounce (if any) won’t last very long.
And to that point, if you analyze the chart below, you can see that excess household savings in the Eurozone are now less than $84 billion.
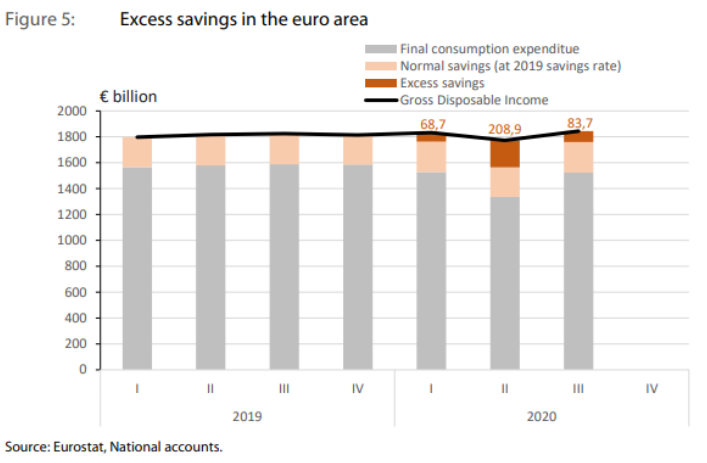
To explain, the brown bars above represent excess household savings in the Eurozone. And from the second-quarter to the third quarter of 2020, European households have spent nearly 60% of their Q2 excess savings. Thus, at this pace, there won’t be any “excess savings” left.
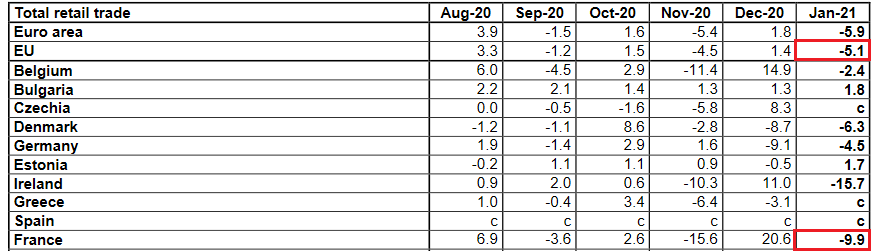
Also signaling economic weakness, the slump in Eurozone retail sales (released on Mar. 4) shows that consumers are spending their money on necessities and not discretionary items that boost GDP.
Please see below:
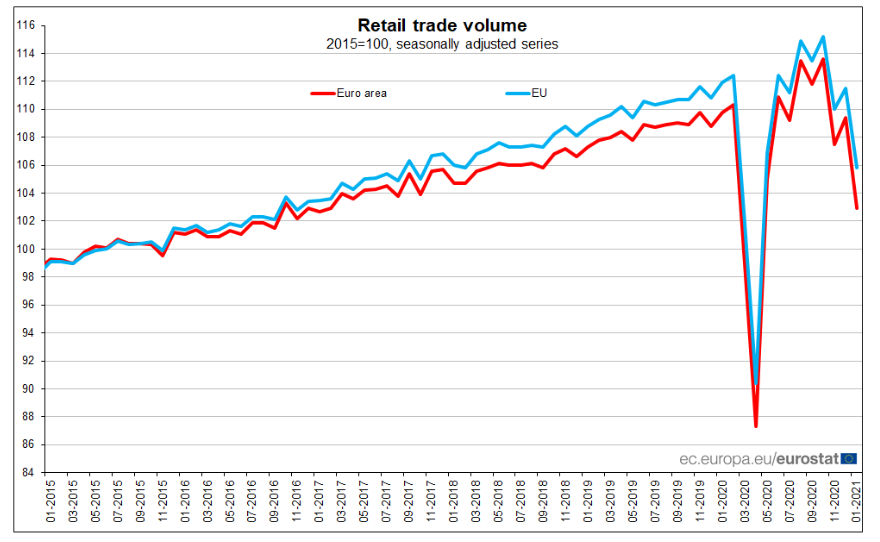
Falling off a cliff, Eurozone retail sales declined by 5.1% in January. Even more revealing, France (– 9.9%) – which is projected to be a beacon of Eurozone growth in 2021 – underperformed the bloc average, with December’s momentum quickly fading in January.
 Source: Eurostat
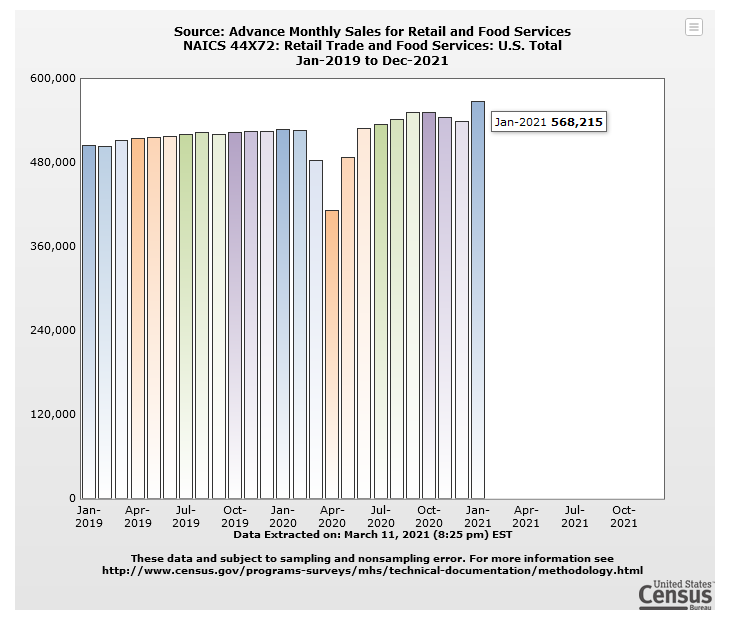
On the flip side, U.S. retail sales rose by 5.3% in January (5.1% excluding food).
Please see below:
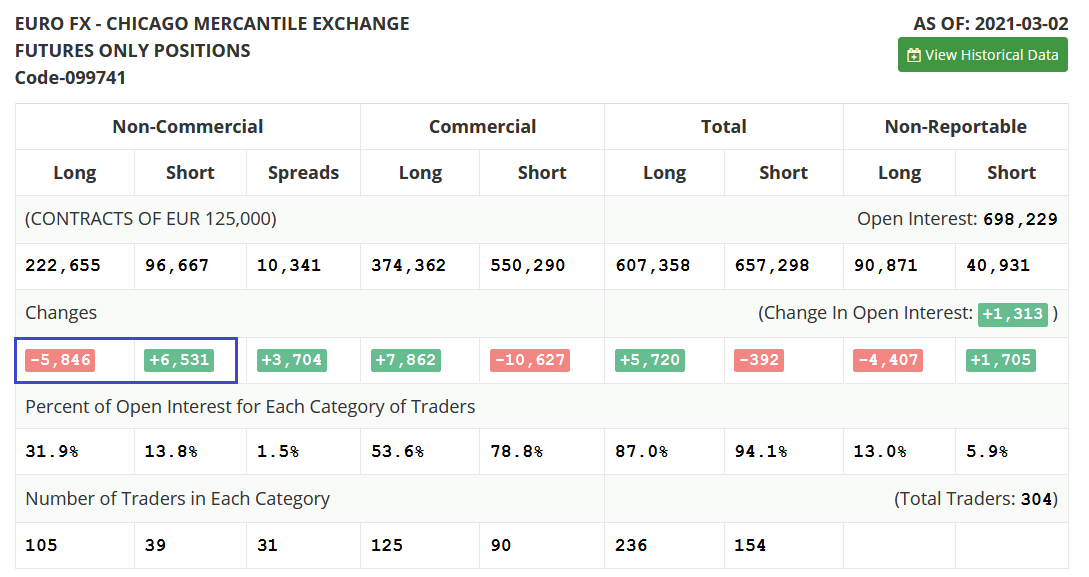
And while fundamentals continue to chip away at the EUR/USD, activity in the futures and options markets are signaling a shift in sentiment. Remember, narratives overpower fundamentals in the short-term, thus, changing opinions is like trying to fill a glass from a dripping faucet. However, the pressure may be rising.
Case in point: the latest Commitments of Traders (COT) report shows that non-commercial futures traders (speculators) have increased the EUR/USD short positions by more than 6,500 contracts, while reducing their EUR/USD long positions by nearly 5,900 contracts (the blue box below).
 Source: COT
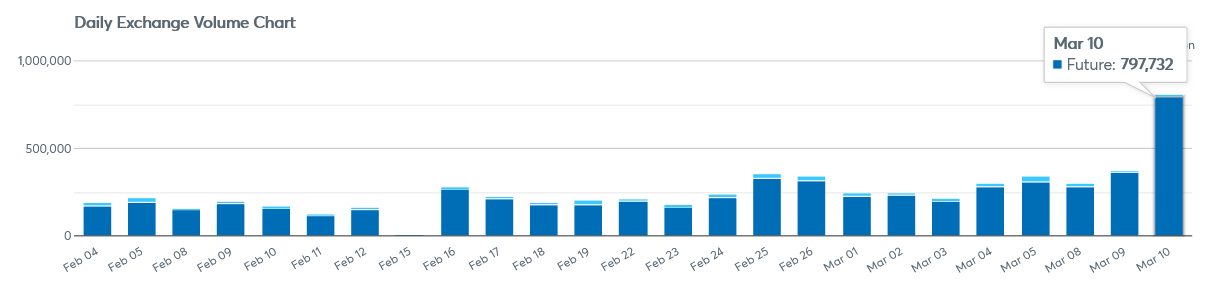
Even more interesting, EUR/USD futures’ volume exploded on Mar. 10. If you analyze the right side of the chart below, you can see that an abnormal number of contracts exchanged hands.
 Source: CME Group
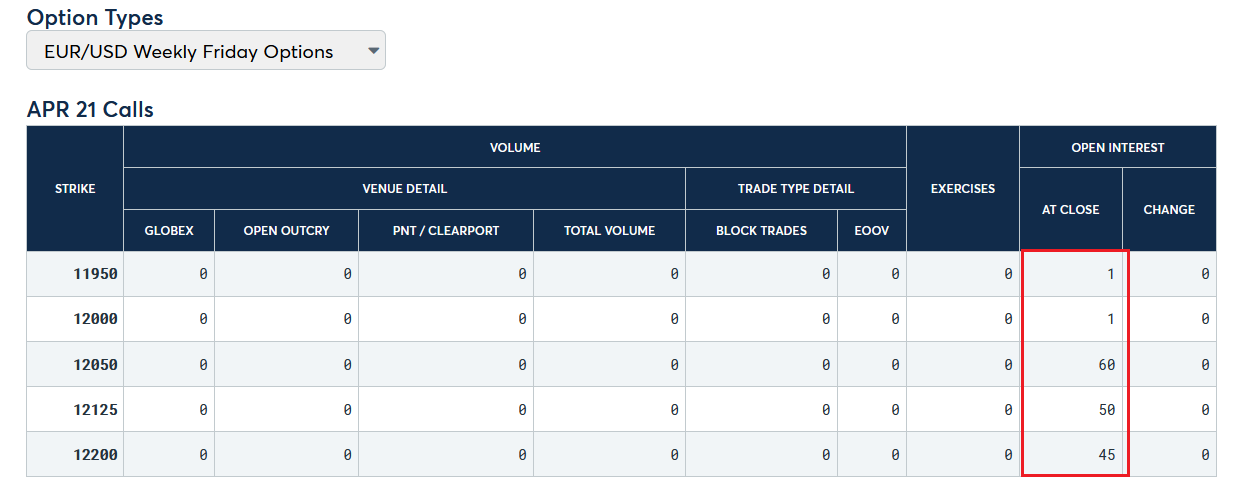
And while the volume data doesn’t tell us whether these are bullish or bearish bets on the EUR/USD, the CME Group’s options data signals that it’s the latter. If you analyze the graphic below, you can see that there is little open interest for bullish bets of 1.1950 or above.
 Source: CME Group
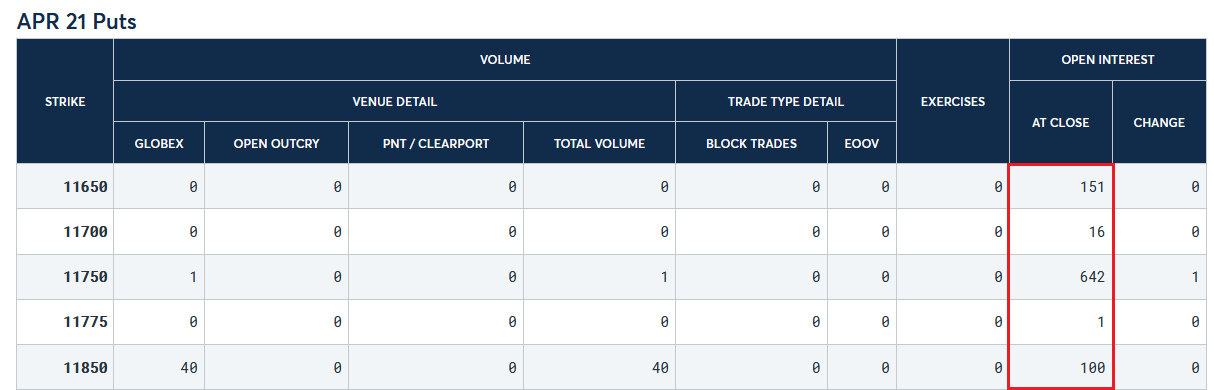
In stark contrast, there is plenty of open interest for bearish bets of 1.1850 or below – with 1.1750 the most popular (642 contracts still outstanding).
 Source: CME Group
In conclusion, the EUR/USD continues to swim against the fundamental current. And while daydreams of a Eurozone economic boom propel European equity bourses to new highs, the misguided optimism has also lifted the euro. However, with the USD Index already verifying its medium-term breakout and a boost from the EUR/USD likely to push it beyond the 94.5 level, the PMs medium-term outlook remains profoundly bearish. And while their correlations with the S&P 500 remains supportive in the short-term (which I predicted would be the case this week), a severe correction of U.S. equities increases the likelihood of a significant slide over the next few months.
Overview of the Upcoming Part of the Decline
- It seems to me that we are already after the initial bottom and the initial correction. If not, then it seems likely to me that the corrective upswing will be completed within a week. It’s more likely that the next big move lower is already underway, though.
- After miners slide once again in a meaningful and volatile way, but silver doesn’t (and it just declines moderately), I plan to switch from short positions in miners to short positions in silver (this could take another 1-2 weeks to materialize). I plan to exit those short positions when gold shows substantial strength relative to the USD Index, while the latter is still rallying. This might take place with gold close to $1,450 - $1,500 and the entire decline (from above $1,700 to about $1,475) would be likely to take place within 1-12 weeks and I would expect silver to fall hardest in the final part of the move. This moment (when gold performs very strongly against the rallying USD and miners are strong relative to gold – after gold has already declined substantially) is likely to be the best entry point for long-term investments in my view. This might happen with gold close to $1,475, but it’s too early to say with certainty at this time. In other words, the entire decline could take between 1 and 12 weeks, while silver declines particularly fast in the final 1-2 weeks.
- If gold declines even below $1,500 (say, to ~$1350 or so), then it could take another 10 weeks or so for it to bottom, but this is not what I view as a very likely outcome.
- As a confirmation for the above, I will use the (upcoming or perhaps we have already seen it?) top in the general stock market as the starting point for the three-month countdown. The reason is that after the 1929 top, gold miners declined for about three months after the general stock market started to slide. We also saw some confirmations of this theory based on the analogy to 2008. All in all, the precious metals sector would be likely to bottom about three months after the general stock market tops . If the mid-February 2020 top was the final medium-term top, then it seems that we might expect the precious metals sector to bottom in mid-May or close to May’s end.
- The above is based on the information available today and it might change in the following days/weeks.
Letters to the Editor
Q: Gold has risen with the dollar many times before – even in 2016. The S&P breaks resistance today and has a breakout. Maybe we get a pull back to 3650 but we do have a breakout to 4400 at least for starters.
A: As I explained earlier today, gold is doing exactly the opposite of what it should be doing if it was to indicate that it’s going to rally along with the USD Index. There will be times when they rally together – and in fact, I think that seeing this after a big slide will be a very important bullish confirmation – but we are not there yet.
Stocks could rally here, but it seems that the PMs would decline anyway because of what’s going on in the USD Index and how gold reacts to it. And since at the moment of writing these words, S&P 500 futures are down by 0.67%, the next big move lower could have already started – we’ll see.
Q: Thanks for the alert I took a position in April gold contracts CGJ12 pretty close to the bottom and closed the position 3-10-2021. I was kicking myself this morning because I left money on the table, but I did not like the movement of gold – it felt like it was at the top. It would be helpful to know the intermediate top in gold before the decline, perhaps with an Alert for those of us that want to go short in the futures market. Are we at the top now?
A: It would have definitely been helpful to know the intermediate top in gold before the decline – and the same applies to mining stocks. And we had indicated the targets beforehand. Still, one cannot “get married” to a certain outlook and should always be looking for things that might invalidate it. That’s what I found yesterday, and I reported it accordingly. Based on today’s pre-market decline in gold, it seems that it was a good decision to take profits off the table yesterday and get back on the short side of the market.
Q: Thank you for remembering me. I appreciate that. Do you expect a violent fall or a calm/gradual fall?
A: I’m happy to reply to the questions that I receive in order to maximize the chance that everyone will be able to benefit thanks to my analyses. I think that the decline will get more volatile close to its end (perhaps in the second half of April and in May) and it might be more measured for the next few weeks. Perhaps this would correspond to a steadier decline to $1,600, but then a fast and brief slide below $1,500. It’s unclear at this time, but it seems that the intermediate support levels might become clearer as gold moves lower.
Right now, it doesn’t seem to be a good idea to plan trading another small counter-trend rally, but if such an opportunity presents itself and several markets show signs of an upcoming reversal, we might go long once again.
Summary
To summarize, the PMs’ medium-term decline is well underway, and based on the recent performance of the USD Index, general stock market and gold’s relative weakness vs. the USDX (along with a few other indications from mining stocks) it seems that the corrective upswing is already over. The next big move lower seems to be already underway.
Given today’s pre-market decline it could be the case that the top in the mining stocks is in, and that by selling GDX at $32.96 yesterday (March 11) you exited the long positions (and entered short ones) practically right at the top – a week after buying in the $30.80 - $31 area (practically right at the bottom) – congratulations on a great trade.
In addition, because we’re likely entering the “winter” part of the Kondratiev cycle (just like in 1929 and then the 1930s), the outlook for the precious metals’ sector remains particularly bearish during the very first part of the cycle, when cash is king.
The confirmed breakout in the USD Index is yet another confirmation of the bearish outlook for the precious metals market.
After the sell-off (that takes gold to about $1,450 - $1,500), we expect the precious metals to rally significantly. The final part of the decline might take as little as 1-5 weeks, so it's important to stay alert to any changes.
Most importantly, please stay healthy and safe. We made a lot of money last March and it seems that we’re about to make much more on this March decline, but you have to be healthy to enjoy the results.
As always, we'll keep you - our subscribers - informed.
By the way, we are opening a possibility to extend one's subscription for a year, two years or even three years with a special 20% discount. This discount can be applied right away, without the need to wait for your next renewal – if you choose to secure your premium access and complete the payment upfront. The boring time in the PMs is definitely over and the time to pay close attention to the market is here. Naturally, it’s your capital, and the choice is up to you, but it seems that it might be a good idea to secure more premium access now, while saving 20% at the same time. Our support team will be happy to assist you in the above-described upgrade at preferential terms – if you’d like to proceed, please contact us..
To summarize:
Trading capital (supplementary part of the portfolio; our opinion): Full speculative short positions (300% of the full position) in mining stocks are justified from the risk to reward point of view with the following binding exit profit-take price levels:
Mining stocks (price levels for the GDXJ ETF): binding profit-take exit price: $24.12; stop-loss: none (the volatility is too big to justify a stop-loss order in case of this particular trade)
Alternatively, if one seeks leverage, we’re providing the binding profit-take levels for the JDST (2x leveraged) and GDXD (3x leveraged – which is not suggested for most traders/investors due to the significant leverage). The binding profit-take level for the JDST: $39.87; stop-loss for the JDST: none (the volatility is too big to justify a SL order in case of this particular trade); binding profit-take level for the GDXD: $94.87; stop-loss for the GDXD: none (the volatility is too big to justify a SL order in case of this particular trade).
For-your-information targets (our opinion; we continue to think that mining stocks are the preferred way of taking advantage of the upcoming price move, but if for whatever reason one wants / has to use silver or gold for this trade, we are providing the details anyway.):
Silver futures upside profit-take exit price: unclear at this time - initially, it might be a good idea to exit, when gold moves to $1,512.
Gold futures upside profit-take exit price: $1,512.
Long-term capital (core part of the portfolio; our opinion): No positions (in other words: cash
Insurance capital (core part of the portfolio; our opinion): Full position
Whether you already subscribed or not, we encourage you to find out how to make the most of our alerts and read our replies to the most common alert-and-gold-trading-related-questions.
Please note that we describe the situation for the day that the alert is posted in the trading section. In other words, if we are writing about a speculative position, it means that it is up-to-date on the day it was posted. We are also featuring the initial target prices to decide whether keeping a position on a given day is in tune with your approach (some moves are too small for medium-term traders, and some might appear too big for day-traders).
Additionally, you might want to read why our stop-loss orders are usually relatively far from the current price.
Please note that a full position doesn't mean using all of the capital for a given trade. You will find details on our thoughts on gold portfolio structuring in the Key Insights section on our website.
As a reminder - "initial target price" means exactly that - an "initial" one. It's not a price level at which we suggest closing positions. If this becomes the case (like it did in the previous trade), we will refer to these levels as levels of exit orders (exactly as we've done previously). Stop-loss levels, however, are naturally not "initial", but something that, in our opinion, might be entered as an order.
Since it is impossible to synchronize target prices and stop-loss levels for all the ETFs and ETNs with the main markets that we provide these levels for (gold, silver and mining stocks - the GDX ETF), the stop-loss levels and target prices for other ETNs and ETF (among other: UGL, GLL, AGQ, ZSL, NUGT, DUST, JNUG, JDST) are provided as supplementary, and not as "final". This means that if a stop-loss or a target level is reached for any of the "additional instruments" (GLL for instance), but not for the "main instrument" (gold in this case), we will view positions in both gold and GLL as still open and the stop-loss for GLL would have to be moved lower. On the other hand, if gold moves to a stop-loss level but GLL doesn't, then we will view both positions (in gold and GLL) as closed. In other words, since it's not possible to be 100% certain that each related instrument moves to a given level when the underlying instrument does, we can't provide levels that would be binding. The levels that we do provide are our best estimate of the levels that will correspond to the levels in the underlying assets, but it will be the underlying assets that one will need to focus on regarding the signs pointing to closing a given position or keeping it open. We might adjust the levels in the "additional instruments" without adjusting the levels in the "main instruments", which will simply mean that we have improved our estimation of these levels, not that we changed our outlook on the markets. We are already working on a tool that would update these levels daily for the most popular ETFs, ETNs and individual mining stocks.
Our preferred ways to invest in and to trade gold along with the reasoning can be found in the how to buy gold section. Furthermore, our preferred ETFs and ETNs can be found in our Gold & Silver ETF Ranking.
As a reminder, Gold & Silver Trading Alerts are posted before or on each trading day (we usually post them before the opening bell, but we don't promise doing that each day). If there's anything urgent, we will send you an additional small alert before posting the main one.
Thank you.
Przemyslaw Radomski, CFA
Founder, Editor-in-chief

