

Briefly: in our opinion, full (300% of the regular position size) speculative short positions in mining stocks are justified from the risk/reward point of view at the moment of publishing this Alert.
Today’s analysis is going to be relatively brief, as practically everything that I wrote in yesterday's (Mar. 22) flagship analysis remains up-to-date. Nevertheless, I want to update you on the barely visible, but perhaps very important development that took place yesterday and that is taking place today.
Let’s start with a brief overview of what happened yesterday in the daily charts.
The overview will be in fact very short, because practically nothing changed in the case of gold and mining stocks. The sell signal from the stochastic indicator is now more visible, but I already wrote about it yesterday, so – again – nothing really new.
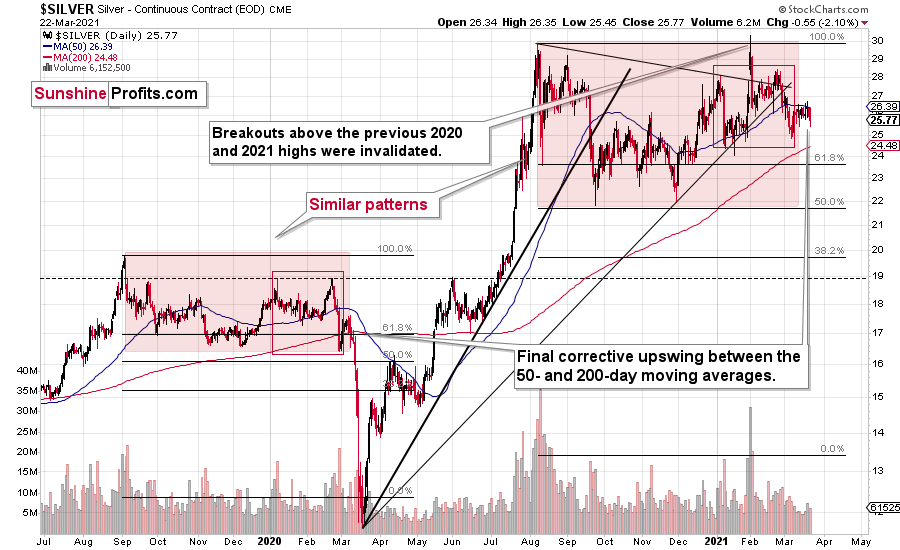
Silver moved lower in a more visible manner, which might be surprising to some investors (especially those that went long based on the “silver short squeeze” movement almost two months ago), but it’s not surprising to me. If the history repeats itself to a considerable degree, then it’s not odd to see the same kind of performance that we saw in the similar stage of a given price move.
In this case, I already discussed the self-similarity present in the silver market, and I marked the similar patterns with red rectangles. The current situation seems similar to early March 2020, when silver was just starting a major decline while being between its 50- and 200-day moving average. Let’s keep in mind that gold actually moved to a new high in early March, and silver was very far from doing so. Back then, silver underperformed, so it’s no wonder that it’s underperforming right now. While the silver shortage was the topic of the day for many days about two months ago, it seems that more bearish headlines will soon be more popular.
At this point you might be wondering if this indicates bullishness as miners did not show significant weakness yesterday. The answer is “no”, because this kind of relative performance would be important only after a clearly visible decline. We are currently after a clearly visible corrective upswing.
The daily decline in silver is not the thing that I previously described as “barely visible, but perhaps very important”.
It’s the breakdowns that are key here.
We saw breakdowns in both gold and mining stocks, and while it’s almost not visible in the daily charts, it is visible in the 4-hour charts (each candlestick is based on 4 hours).
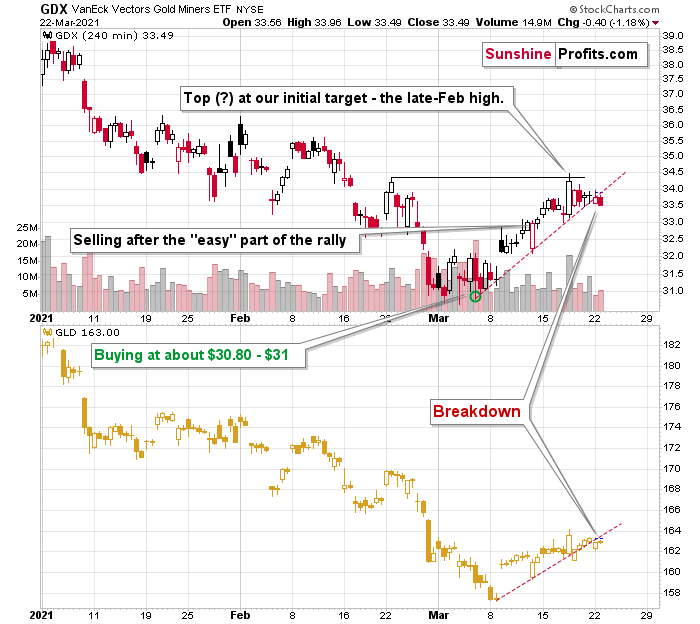
The above 4-hour GDX chart clearly shows that the value of this ETF moved – and closed the day – below the rising red support line. In fact, the same happened in the GLD ETF in the bottom part of the chart.
This breakdown is not yet confirmed, but it seems to be the first small crack in an enormous, bearish dam.
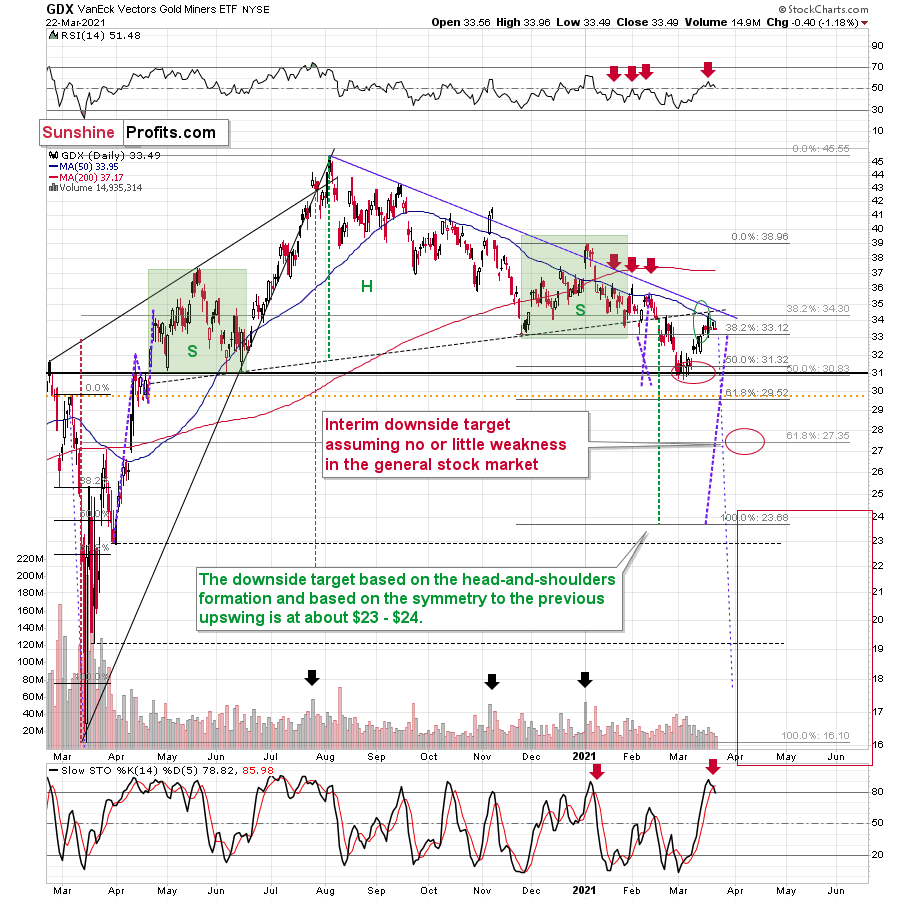
On a side note, please note that the GDX topped practically in exact tune with my original expectations. On March 10 (when we were already long), I wrote the following:
Even though gold moved lower in early March, gold miners stopped declining after reaching my target area based several techniques – most importantly the 50% Fibonacci retracement based on the entire 2020 rally, and the previous lows and highs. Just as miners’ relative weakness had previously heralded declines for the entire precious metals sector, their strength meant that a rally was about to start. And that’s just what we saw yesterday (Mar. 9).
Ultimately, it seems that the above corrections will result in the GDX ETF moving to about $34 or so.
The resistance levels in the $34 - $35 area are provided by:
- The late-February 2020 high
- The rising neck level of the previously completed head and shoulders pattern
- The analogy to how big miners’ correction was in April (assuming that the mirror similarity continues)
- The declining blue resistance line
- The 50-day moving average
Additionally, please note that the last few local tops were accompanied by RSI at about 50. The latter is currently below 45, suggesting that this rally has more potential, but that it’s not particularly extreme.
At this point one might wonder if exiting the positions earlier, close to $33, was indeed a good idea. Since this is an opportune moment for a thought experiment, let’s discuss it.
We now know that miners moved higher and (likely) topped a bit above $34. If, on March 11, we had known that the miners would rally even more, it would have been a much better idea to wait with taking profits off the table for several more days. However, it’s impossible to know exactly what will happen in the future and it’s now easy to say with the benefit of hindsight that this or that would have been the best choice after all.
However, since the supply of time machines is very limited, we cannot use information that was not available at the moment of making the decision to discuss whether that decision was good or not.
Using an analogy, would drunk driving for many miles have been a good idea if one didn’t hit anybody and was able to arrive home in one piece? Absolutely not. That would be a terrible decision, because of the ridiculous amount of unnecessary risk that one would have taken based on this very decision. The fact that nobody got hit and that the driver didn’t hurt themselves would have been pure luck, which would be unlikely to be repeated many times, if one made the same decision over and over again.
In the case of mathematics or physics, where probability isn’t involved, one can judge the decisions based on the outcomes. 2+2=4, so if one’s outcome if this equation was 7, then this is clearly wrong. If one thinks that dropping a heavy object on one’s head is a good idea, one would soon learn – based on the effect – that this is a bad idea and a bad decision.
What is the thing that makes the situations described in both the above-mentioned paragraphs different as night and day? The certainty or uncertainty of outcomes – in other words, probability.
The bottom line is that one can judge decisions based on outcomes only if probability isn’t involved. If it is, one needs to take only the information available at the time of making the decision in order to determine whether a given decision or idea (including gold investment ideas) was good or not. This applies to non-investment situations as well.
Let’s get back to the investment world. Our original plan was to get out after the “easy” part of the rally was over and based on information available on March 11 – that “easy” part of the rally was indeed over. Based on what happened on that day and in the prior days, the decision to close this position was justified – in my view, and if I saw exactly the same situation unfolding in the future, I would be making exactly the same decision. Just because the price then moved higher in the following days, doesn’t mean that this decision became a bad one. It was a rally, but it was not the easy part of the rally, and while it actually happened, that was not enough to keep betting on it.
I don’t expect the market to move higher for much longer (if at all). In fact, the above chart and the one below provide a good indication that the decline has already started or is about to start.
The final chart for today is the one featuring gold’s 4-hour candlesticks.
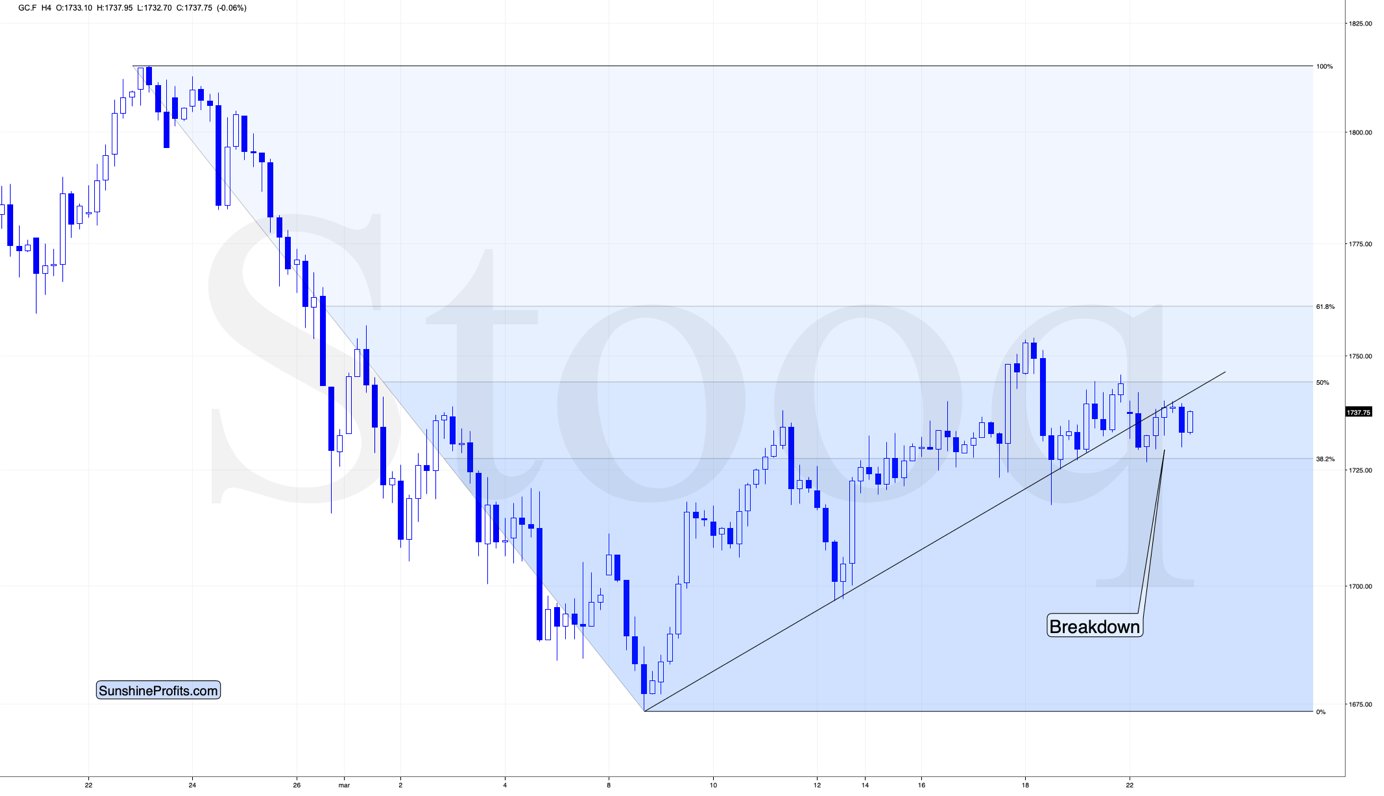
Gold has not only broken below its rising, short-term support line, but it’s been verifying this breakdown for about 24 hours without invalidating it. If gold manages to stay below the support line, the latter will turn into resistance, and we’ll likely see the start of another powerful slide.
Overview of the Upcoming Part of the Decline
- It seems to me that we are already after the initial bottom and the initial correction. If not, then it seems likely to me that the corrective upswing will be completed within a week. It’s more likely that the next big move lower is already underway, though.
- After miners slide once again in a meaningful and volatile way, but silver doesn’t (and it just declines moderately), I plan to switch from short positions in miners to short positions in silver (this could take another 1-2 weeks to materialize). I plan to exit those short positions when gold shows substantial strength relative to the USD Index, while the latter is still rallying. This might take place with gold close to $1,450 - $1,500 and the entire decline (from above $1,700 to about $1,475) would be likely to take place within 1-12 weeks and I would expect silver to fall hardest in the final part of the move. This moment (when gold performs very strongly against the rallying USD and miners are strong relative to gold – after gold has already declined substantially) is likely to be the best entry point for long-term investments in my view. This might happen with gold close to $1,475, but it’s too early to say with certainty at this time. In other words, the entire decline could take between 1 and 12 weeks, while silver declines particularly fast in the final 1-2 weeks.
- If gold declines even below $1,500 (say, to ~$1350 or so), then it could take another 10 weeks or so for it to bottom, but this is not what I view as a very likely outcome.
- As a confirmation for the above, I will use the (upcoming or perhaps we have already seen it?) top in the general stock market as the starting point for the three-month countdown. The reason is that after the 1929 top, gold miners declined for about three months after the general stock market started to slide. We also saw some confirmations of this theory based on the analogy to 2008. All in all, the precious metals sector would be likely to bottom about three months after the general stock market tops . If the mid-February 2020 top was the final medium-term top, then it seems that we might expect the precious metals sector to bottom in mid-May or close to May’s end.
- The above is based on the information available today and it might change in the following days/weeks.
Letters to the Editor
Q: I am in that very uncomfortable position again, where I have used the information in your research to deploy some capital that would realize a nice gain in the event that precious metal miners (the GDX and GDXJ) would drop and DUST and JDST would rise.
Everybody who reversed positions after the last call for a “pop” up in gold, is underwater…. Should we dollar cost average in as the GDX and GDXJ continue to rise? I don’t want to miss a drop in the GDX to the 15-24 range…. Because the way I am positioned, that would really be superb!
Same thing for the GDXJ. If it moved somewhere under 28…. That would be great.
I do hope this does not turn into another 4–6-week time frame that gets pushed out every week. Are we just waiting for a market crash that the Fed seems to know how to handle?
A: Indeed, it’s never comfortable or pleasant to have a position that doesn’t become profitable immediately (or shortly) after one enters it. However, please keep in mind that while I was able to get in the previous long position almost right at the bottom, it doesn’t mean that it’s something that can be regularly expected – neither from me, nor from anyone else. Getting in close to bottoms and getting out close to tops (or entering shorts close to tops) is all that one can realistically expect (and that is a lot by itself, anyway), but expecting one’s position to become profitable immediately is practically a guarantee for one to be disappointed in most cases, regardless of the source of the analysis.
As a comparison, it’s easy to get depressed while looking at Instagram pictures of people who theoretically (based on the pictures that are fine-tuned and adjusted) are leading perfectly happy lives in their perfectly beautiful, healthy and sexy bodies. The point is that just as the immediately profitable positions, these pictures are almost always staged, fake, or exaggerated in one way or the other (by the way, did you know that the ice cream that you see in ads are actually mashed potatoes? The ice cream would melt too soon under the hot studio lights before they managed to shoot the material). But the feeling of disappointment or depression stemming from the comparison to unrealistic standards can be very real. In life it could lead to depression, in investments, to dropping a good system in the search for a perfect one (that doesn’t exist).
I wouldn’t call a position that was just entered and that didn’t immediately become profitable as being “underwater”, because it’s too early to tell what the outcome of the decision to go short is. I wrote about the “easy part” of the rally being over, while writing that it was still possible for the miners (and the rest of the precious metals sector) to move higher in the short run. That wasn’t the part of the rally worth betting on, and given the strength of the medium-term downtrend (and all the indications that I’m outlining in the flagship analyses, for example yesterday’s issue). Theoretically, even a -0.01% result implies a position being “underwater”, but this word has very negative connotations. If you stay underwater too long, the consequences are extremely bad. But if a position stays in slightly negative territory while the outlook stays the same, and the reasons due to which it was opened in the first place remain intact, then it has no implications whatsoever. In my view – and as I explained today and yesterday – we are in this waiting (or topping) period, and the outlook stays completely intact.
I’d say that those who cashed in their profits from their previous long position are now waiting for the next big (and even more profitable) move while being well prepared for it in advance (contrary to those who will try to get aboard the short positions once they are convinced enough by the bearish narrative at much lower price levels and with much worse profit potential).
Are we waiting for a market crash? No. A market crash would speed things up, but everything needed for the PMs to slide is already here. The USD Index was extremely oversold on a medium-term basis and it has just started to move back up. It confirmed its breakout and it is exactly at this moment when the risk to reward seems most promising. This, plus the situation in the interest rates is a perfectly bearish storm for the PMs. It’s already happening, no additional trigger is necessary. A decline in stocks would give miners (and then silver) an extra push, but it’s not required for the PMs to decline.
Q: Can you please give a little information on RSI 14 and the stochastic oscillator (that black/red line). How does it work and what does the black line above the red mean and vice versa? Are they correlated with each other? Thanks in advance.
A: There are many places on the Internet that will provide you with more detailed information on these indicators. We have our own overview of the RSI indicator (click for more info), but we haven’t prepared one for the stochastic indicator yet. This overview of the stochastic indicator seems quite useful, though.
Q: Can you recommend a CDN silver short ETF, and an exit price... and an exit price for HGD? Thank you again. Yes, the currency exchange is a problem for us.
A: I can’t “recommend” any individual investment vehicle – I can’t provide investment advice. In my opinion, one Canadian inverse silver ETF that you might find useful is the HZD (Horizon Betapro Silver -2x Daily Bear ETF). I don’t have an exit target for silver for this trade, so I don’t have one for its leveraged proxy. The situation with silver’s ultimate (or intermediate) downside targets is too unclear for me to provide one. If I had one, I’d exit the position in silver / silver ETF when gold moves to $1,512 (in USD terms).
As a reminder, I plan to switch from mining stocks to silver after the miners decline substantially, but silver doesn’t. I will most likely have a price target for silver at that time (but I don’t have it yet).
Q: Actually, my only question to you would be whether you foresaw the downturn last March in as good an advance as you apparently anticipate the upcoming event? If so, I choose to trust you!
A: Well, I’m not sure what kind of advance you would find sufficient, but last year, I entered short positions in gold, silver, and mining stocks on February 21, 2020 (analysis posted at 1:18 PM EST). I substantially increased the size thereof on February 25, 2020 (analysis posted at 6:23 AM EST).
…And yes, I closed the remaining short positions on March 13, 2020 (3:35 PM EST) and I went long at that time.
Summary
To summarize, the PMs’ medium-term decline is well underway, and based on the recent performance of the USD Index, gold and mining stocks, it seems that the corrective upswing is already over (or about to be over). The next big move lower seems to be already underway or about to start.
In addition, because we’re likely entering the “winter” part of the Kondratiev cycle (just like in 1929 and then the 1930s), the outlook for the precious metals’ sector remains particularly bearish during the very first part of the cycle, when cash is king.
The confirmed breakout in the USD Index is yet another confirmation of the bearish outlook for the precious metals market.
After the sell-off (that takes gold to about $1,450 - $1,500), we expect the precious metals to rally significantly. The final part of the decline might take as little as 1-5 weeks, so it's important to stay alert to any changes.
Most importantly, please stay healthy and safe. We made a lot of money last March and it seems that we’re about to make much more on this March decline, but you have to be healthy to enjoy the results.
As always, we'll keep you - our subscribers - informed.
By the way, we’re currently providing you with a possibility to extend your subscription for a year, two years or even three years with a special 20% discount. This discount can be applied right away, without the need to wait for your next renewal – if you choose to secure your premium access and complete the payment upfront. The boring time in the PMs is definitely over and the time to pay close attention to the market is here. Naturally, it’s your capital, and the choice is up to you, but it seems that it might be a good idea to secure more premium access now, while saving 20% at the same time. Our support team will be happy to assist you in the above-described upgrade at preferential terms – if you’d like to proceed, please contact us.
To summarize:
Trading capital (supplementary part of the portfolio; our opinion): Full speculative short positions (300% of the full position) in mining stocks are justified from the risk to reward point of view with the following binding exit profit-take price levels:
Mining stocks (price levels for the GDXJ ETF): binding profit-take exit price: $24.12; stop-loss: none (the volatility is too big to justify a stop-loss order in case of this particular trade)
Alternatively, if one seeks leverage, we’re providing the binding profit-take levels for the JDST (2x leveraged) and GDXD (3x leveraged – which is not suggested for most traders/investors due to the significant leverage). The binding profit-take level for the JDST: $39.87; stop-loss for the JDST: none (the volatility is too big to justify a SL order in case of this particular trade); binding profit-take level for the GDXD: $94.87; stop-loss for the GDXD: none (the volatility is too big to justify a SL order in case of this particular trade).
For-your-information targets (our opinion; we continue to think that mining stocks are the preferred way of taking advantage of the upcoming price move, but if for whatever reason one wants / has to use silver or gold for this trade, we are providing the details anyway.):
Silver futures upside profit-take exit price: unclear at this time - initially, it might be a good idea to exit, when gold moves to $1,512.
Gold futures upside profit-take exit price: $1,512.
Long-term capital (core part of the portfolio; our opinion): No positions (in other words: cash
Insurance capital (core part of the portfolio; our opinion): Full position
Whether you already subscribed or not, we encourage you to find out how to make the most of our alerts and read our replies to the most common alert-and-gold-trading-related-questions.
Please note that we describe the situation for the day that the alert is posted in the trading section. In other words, if we are writing about a speculative position, it means that it is up-to-date on the day it was posted. We are also featuring the initial target prices to decide whether keeping a position on a given day is in tune with your approach (some moves are too small for medium-term traders, and some might appear too big for day-traders).
Additionally, you might want to read why our stop-loss orders are usually relatively far from the current price.
Please note that a full position doesn't mean using all of the capital for a given trade. You will find details on our thoughts on gold portfolio structuring in the Key Insights section on our website.
As a reminder - "initial target price" means exactly that - an "initial" one. It's not a price level at which we suggest closing positions. If this becomes the case (like it did in the previous trade), we will refer to these levels as levels of exit orders (exactly as we've done previously). Stop-loss levels, however, are naturally not "initial", but something that, in our opinion, might be entered as an order.
Since it is impossible to synchronize target prices and stop-loss levels for all the ETFs and ETNs with the main markets that we provide these levels for (gold, silver and mining stocks - the GDX ETF), the stop-loss levels and target prices for other ETNs and ETF (among other: UGL, GLL, AGQ, ZSL, NUGT, DUST, JNUG, JDST) are provided as supplementary, and not as "final". This means that if a stop-loss or a target level is reached for any of the "additional instruments" (GLL for instance), but not for the "main instrument" (gold in this case), we will view positions in both gold and GLL as still open and the stop-loss for GLL would have to be moved lower. On the other hand, if gold moves to a stop-loss level but GLL doesn't, then we will view both positions (in gold and GLL) as closed. In other words, since it's not possible to be 100% certain that each related instrument moves to a given level when the underlying instrument does, we can't provide levels that would be binding. The levels that we do provide are our best estimate of the levels that will correspond to the levels in the underlying assets, but it will be the underlying assets that one will need to focus on regarding the signs pointing to closing a given position or keeping it open. We might adjust the levels in the "additional instruments" without adjusting the levels in the "main instruments", which will simply mean that we have improved our estimation of these levels, not that we changed our outlook on the markets. We are already working on a tool that would update these levels daily for the most popular ETFs, ETNs and individual mining stocks.
Our preferred ways to invest in and to trade gold along with the reasoning can be found in the how to buy gold section. Furthermore, our preferred ETFs and ETNs can be found in our Gold & Silver ETF Ranking.
As a reminder, Gold & Silver Trading Alerts are posted before or on each trading day (we usually post them before the opening bell, but we don't promise doing that each day). If there's anything urgent, we will send you an additional small alert before posting the main one.
Thank you.
Przemyslaw Radomski, CFA
Founder, Editor-in-chief

