

Briefly: in our opinion, full (200% of the regular size of the position) speculative short positions in gold, silver and mining stocks are justified from the risk/reward perspective at the moment of publishing this alert.
There were not many changes in gold, silver and mining stocks on Friday, and not much has changed in terms of the weekly closing prices either. Gold and gold stocks closed modestly higher, and silver was up by $0.01 last week (after declining $0.01 in the previous week). Some data sources point to $0.02 movement in both weeks, but the overall implication is the same – nothing really happened since gold soared most likely due to Trump’s comments. What can we infer from this silence? Much more than it seems at the first sight.
We previously wrote that the news-based rallies tend to be very temporary and are likely to be reversed. The rally was not reversed yet, but it didn’t continue either. On a stand-alone basis (if nothing else happened other than Trump’s “crazy” comments) that would be a neutral factor with a slight bullish bias as the back and forth trading without a decline would validate the move. But, looking at the performance of the general stock market and still high values of the VIX (stock market volatility index), it’s impossible to say that nothing else is happening. People are still viewing times as uncertain and this is a factor that is likely delaying gold’s decline.
This kind of reaction is most likely only initial. We’ve done the research and we discussed the VIX’s spikes in the previous Alerts. The bottom line is that in the vast majority of cases (at least in the recent years), the spikes in stock market’s volatility are excellent shorting opportunities for precious metals. The PMs are likely to move higher only temporarily, and they already did. The next big move should therefore be lower. Naturally, if something unexpected happens that scares the investors, gold’s decline could be delayed even more, but it’s unlikely that such events would keep on emerging. The trend is down, so gold is likely to decline either based on some kind of trigger (for instance based on a breakout in the USD Index) or even without it – when the volatility in stocks declines and people start selling gold as they no longer feel the need to hedge themselves against the risk in the stock market.
Let’s keep in mind that there are already several factors in place that suggest a decline from the current levels. Moreover, we have just seen an additional one.
Mining Stocks’ Signals
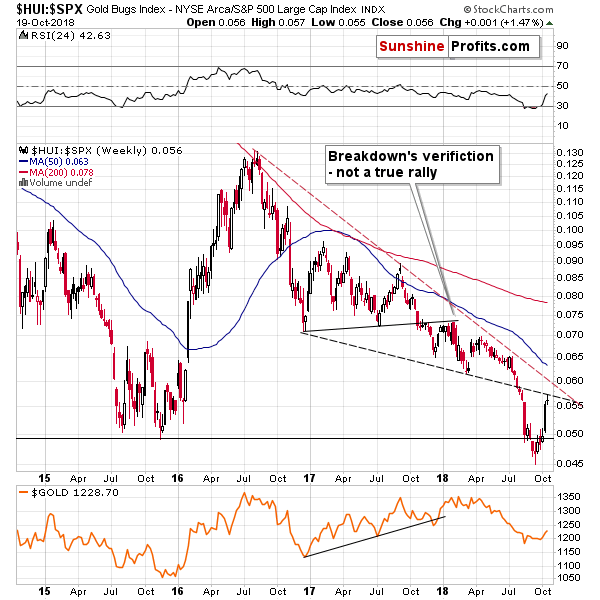
The mining stocks to the general stock market ratio just moved to the declining medium-term resistance line and didn’t manage to break above it. This means that the recent rally was possibly a verification of the breakdown (there is no proof of anything else as there was no invalidation).
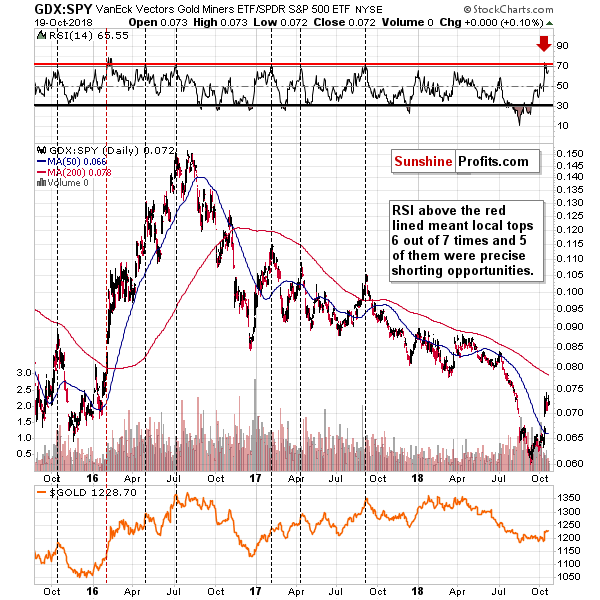
Moreover, on a short-term basis, we have a sell signal from the RSI indicator based on the ratio between miners and other stocks. This signal has been very effective in the past few years, so it’s something that should make one consider opening short positions, not closing them.
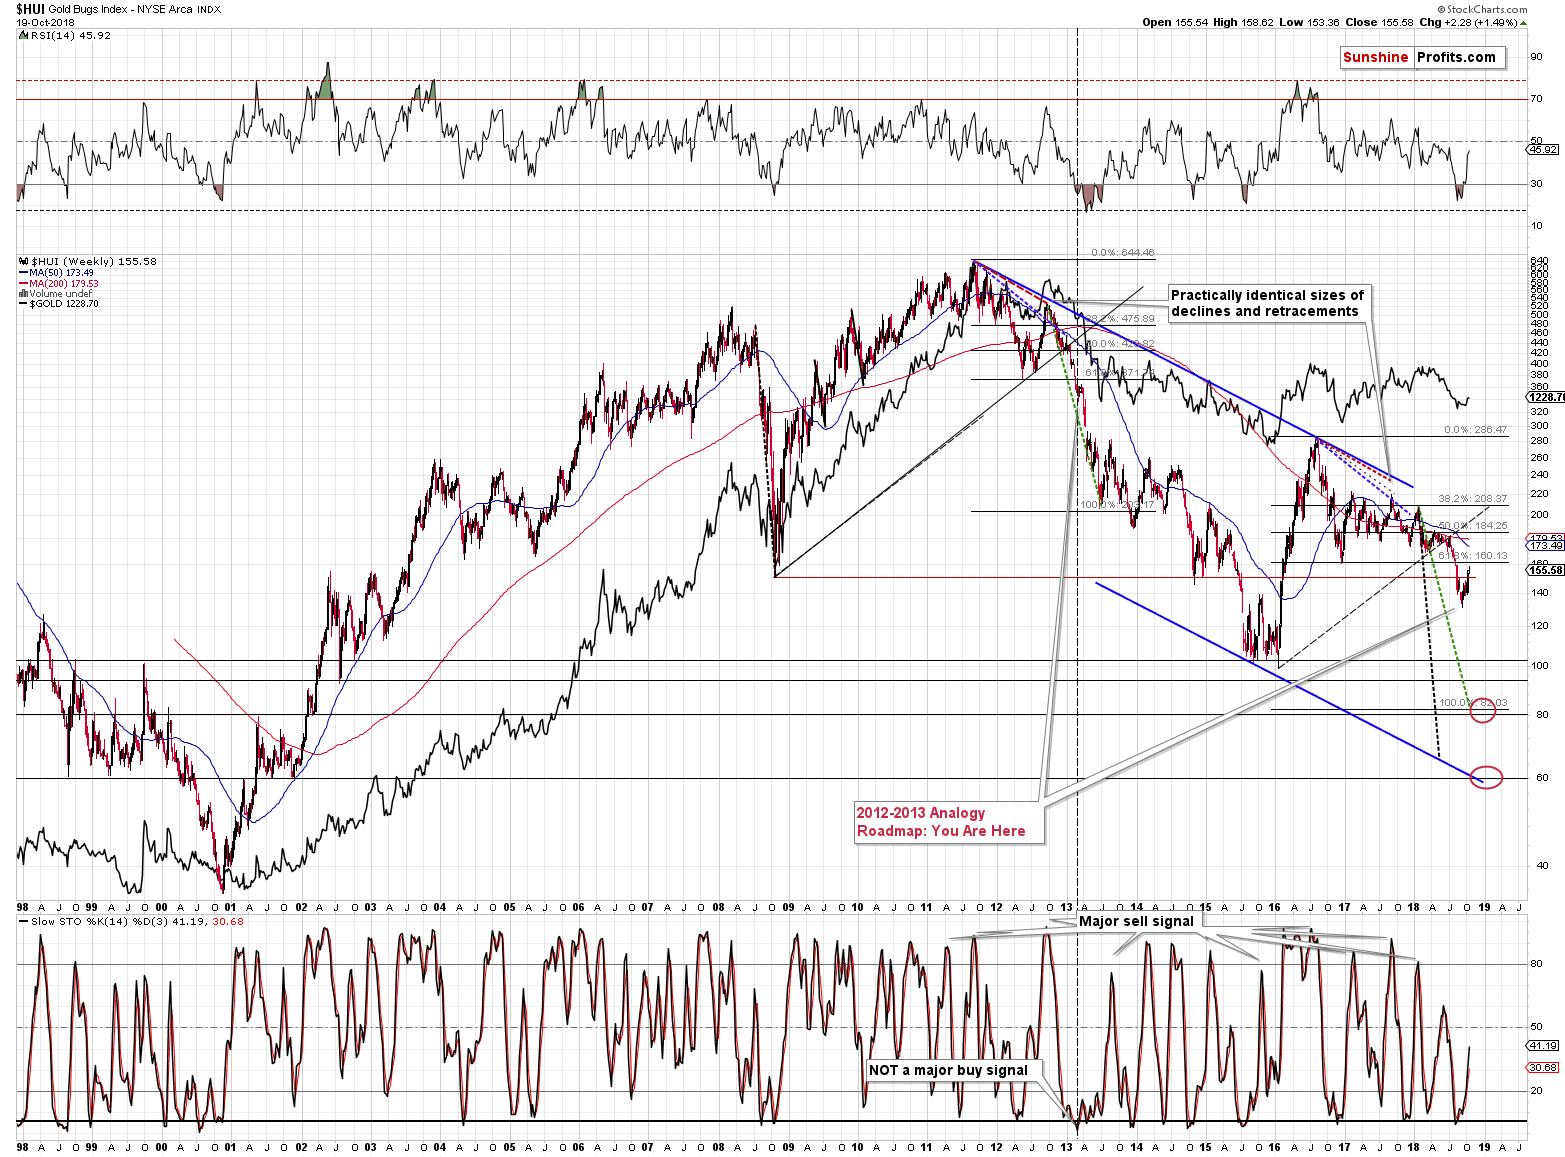
While we’re discussing the mining stocks, please note that the situation that we saw recently is still similar to what happened in 2013 before the biggest part of the decline. Sure, the corrective upswing is now bigger than what we saw in early April 2013, but overall the similarity remains in place. There was no breakout back above the previous lows (late 2016 lows) just as there was no similar action in 2013 (the mid-2012 low).
The new bearish signal that we mentioned earlier, came from a different part of the mining stocks sector – silver stocks.
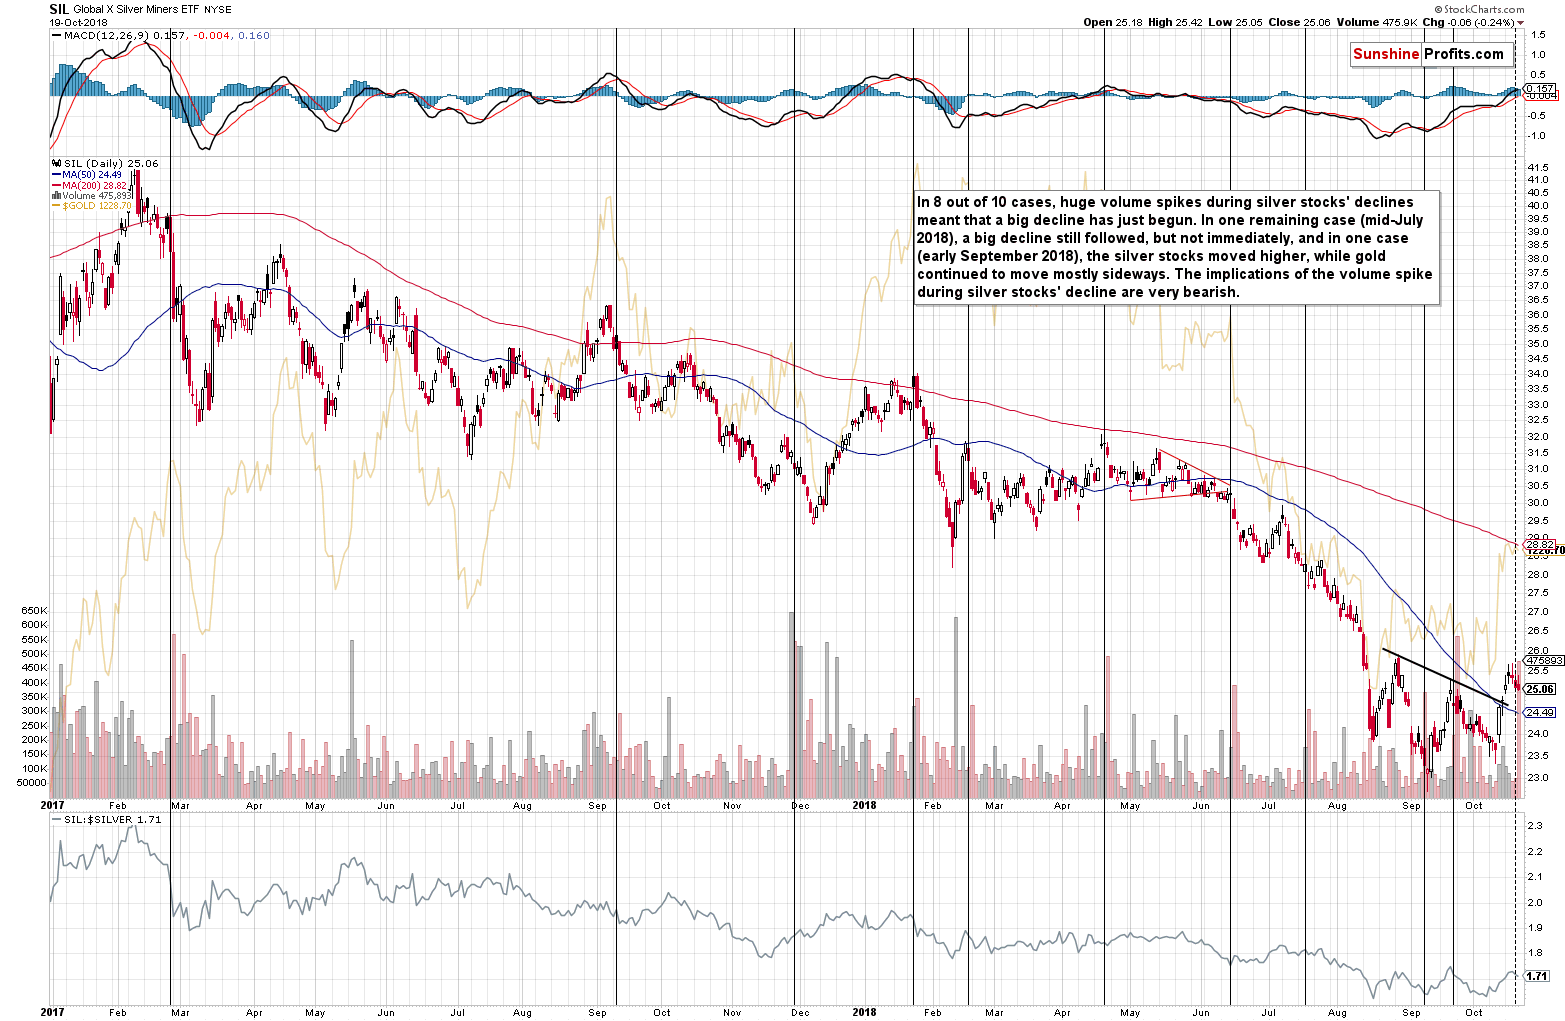
We just saw a spike in the volume of silver stocks during their daily decline. Why is this important? Because in the recent past it almost always meant lower PM prices.
In 8 out of 10 cases, huge volume spikes during silver stocks' declines meant that a big decline has just begun. In one remaining case (mid-July 2018), a big decline still followed, but not immediately, and in one case (early September 2018), the silver stocks moved higher, while gold continued to move mostly sideways. The implications of the volume spike during silver stocks' decline are very bearish.
Let’s stay with silver for a while.
Silver’s Signal and Analogy
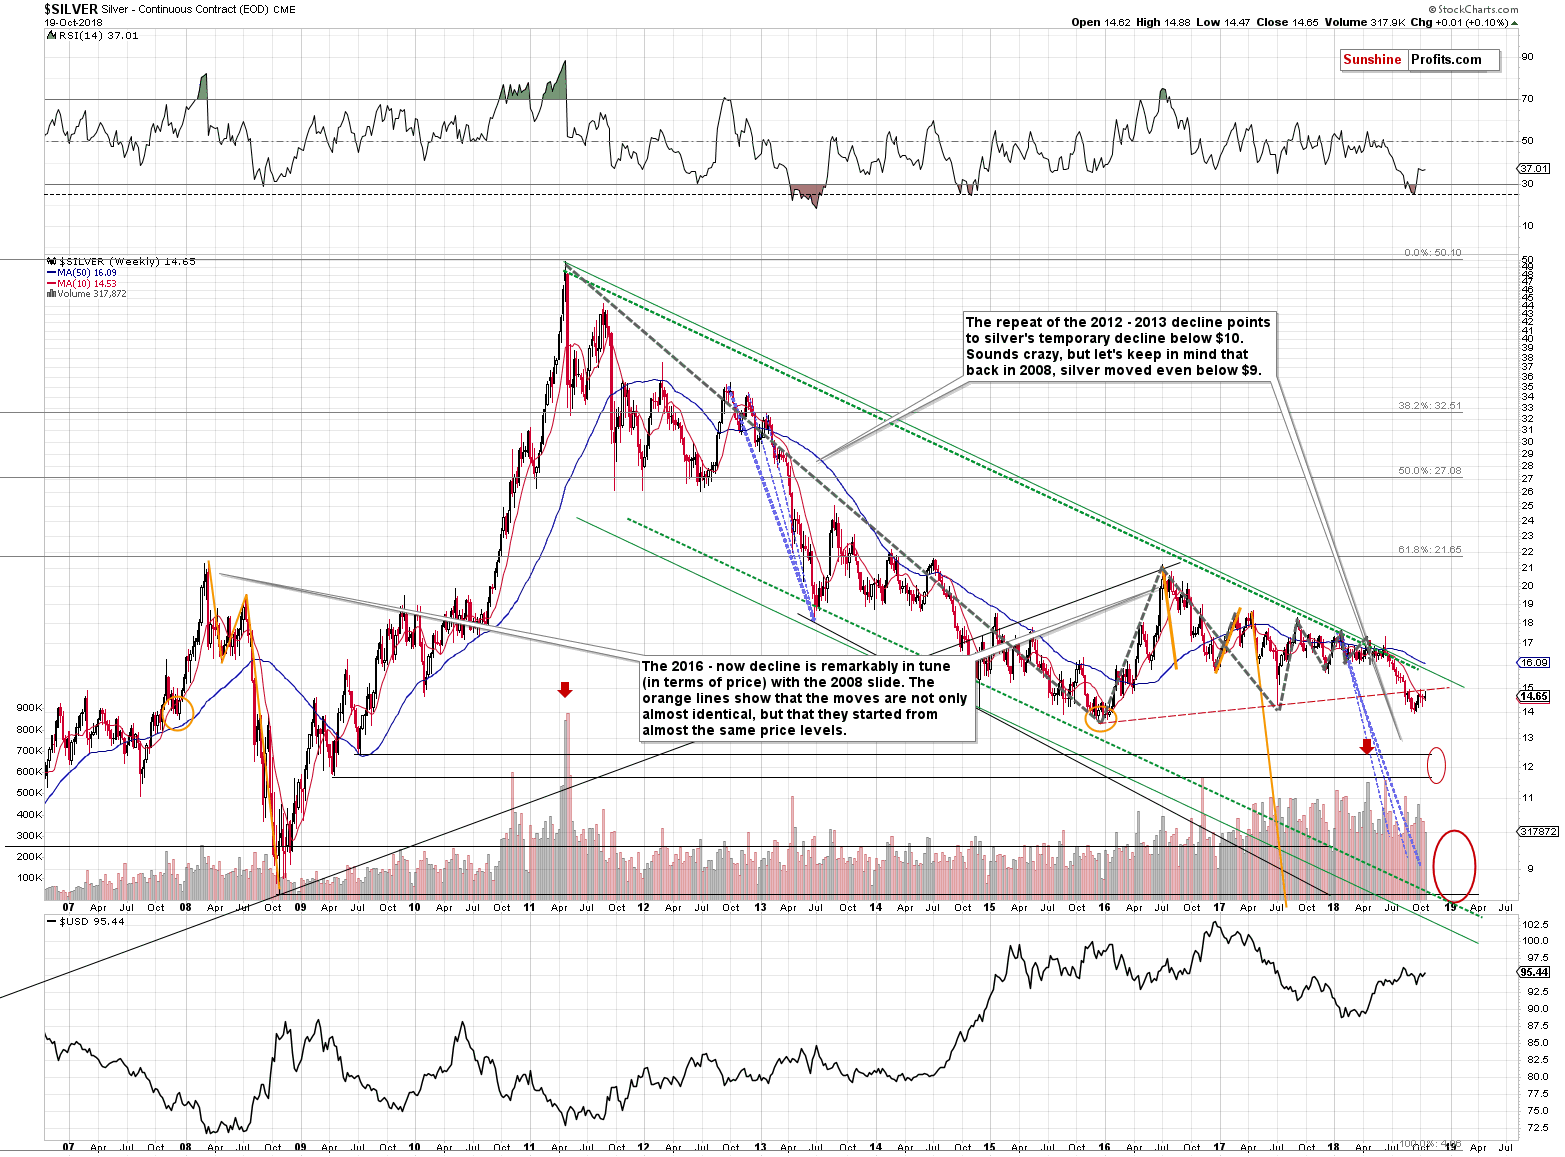
The white metal is after a major breakdown and consolidation below the previously broken line. This factor alone is what makes a sizable decline likely. But the thing that we would like to emphasize is the corrective upswing is what makes the current situation similar to what happened before mid-April, 2013. The current action in silver does not invalidate the now-2013 link – it fits it.
Compared to the price of gold, silver also has bearish implications. In particular, the sell signal that’s based on the pace of the recent quick rally in the ratio.
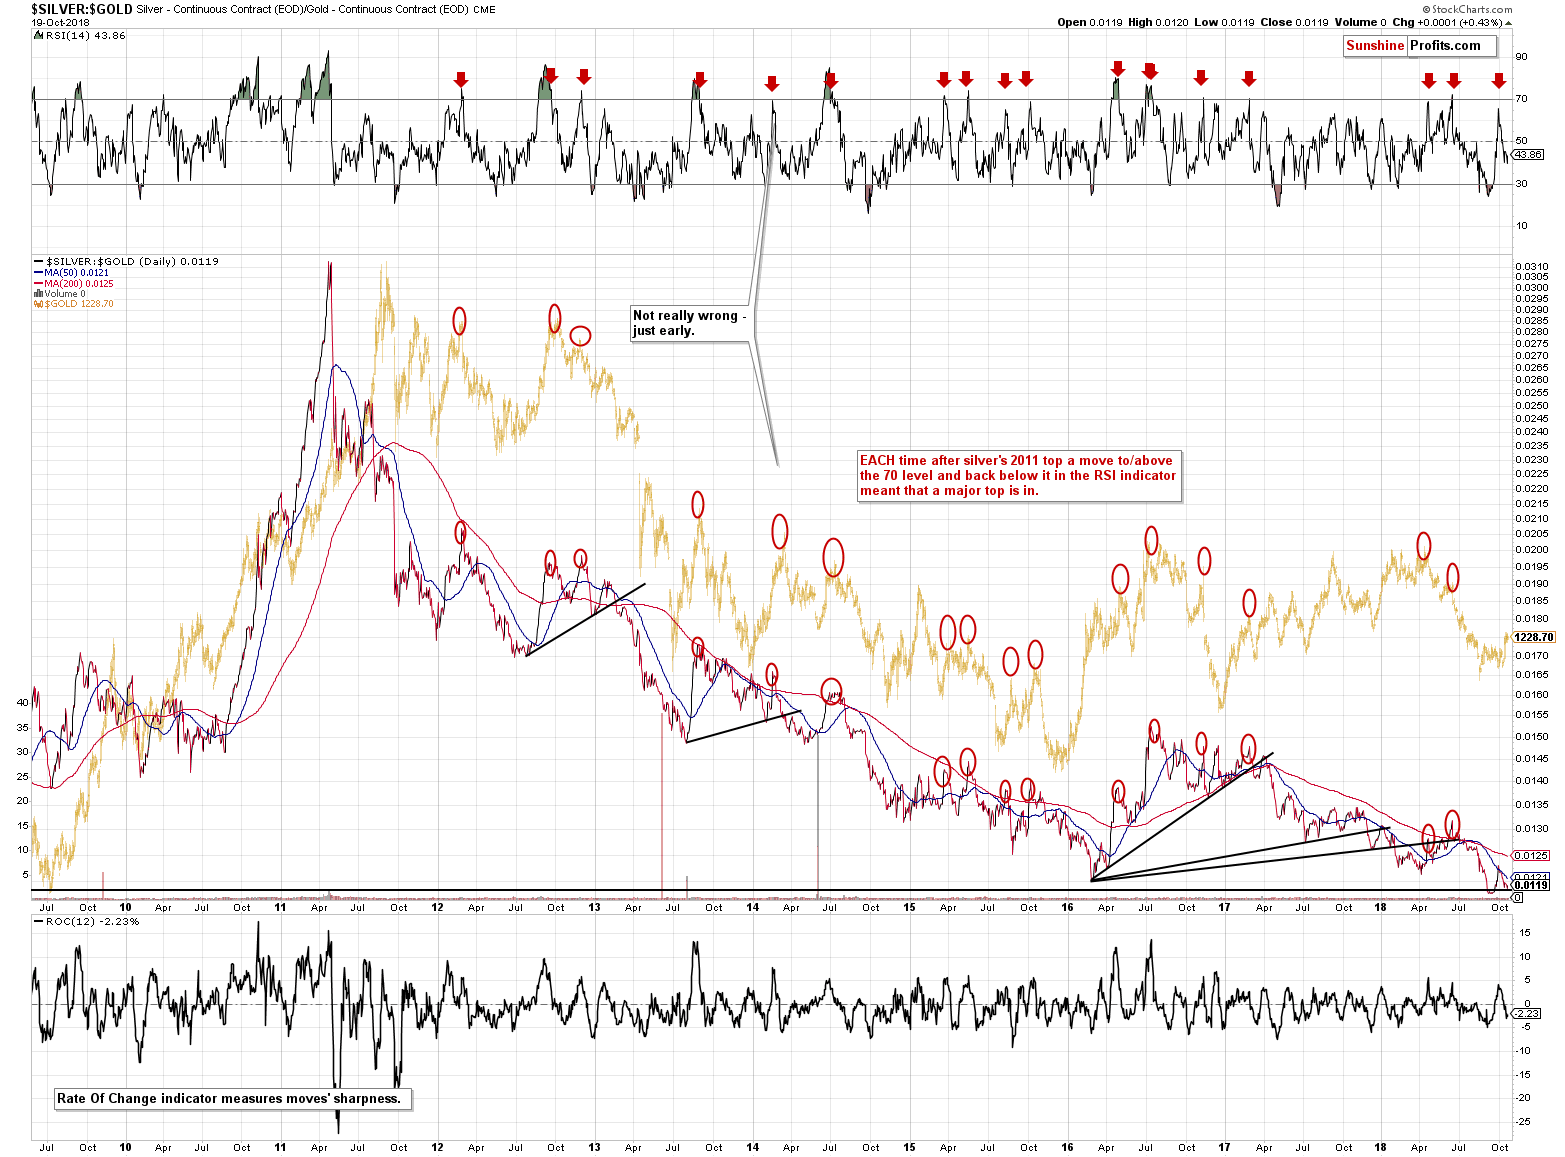
The red arrows mark cases when the RSI was above or very close to the 70 level and then declined. In practically all cases major declines followed, even if they didn’t start right away. This is a very strong indication that the next big move is going to be to the downside, not to the upside.
Forex Implications
In Friday’s regular daily Alert, we wrote the following about the current link between the PMs and the USDX and the price pattern in the latter:
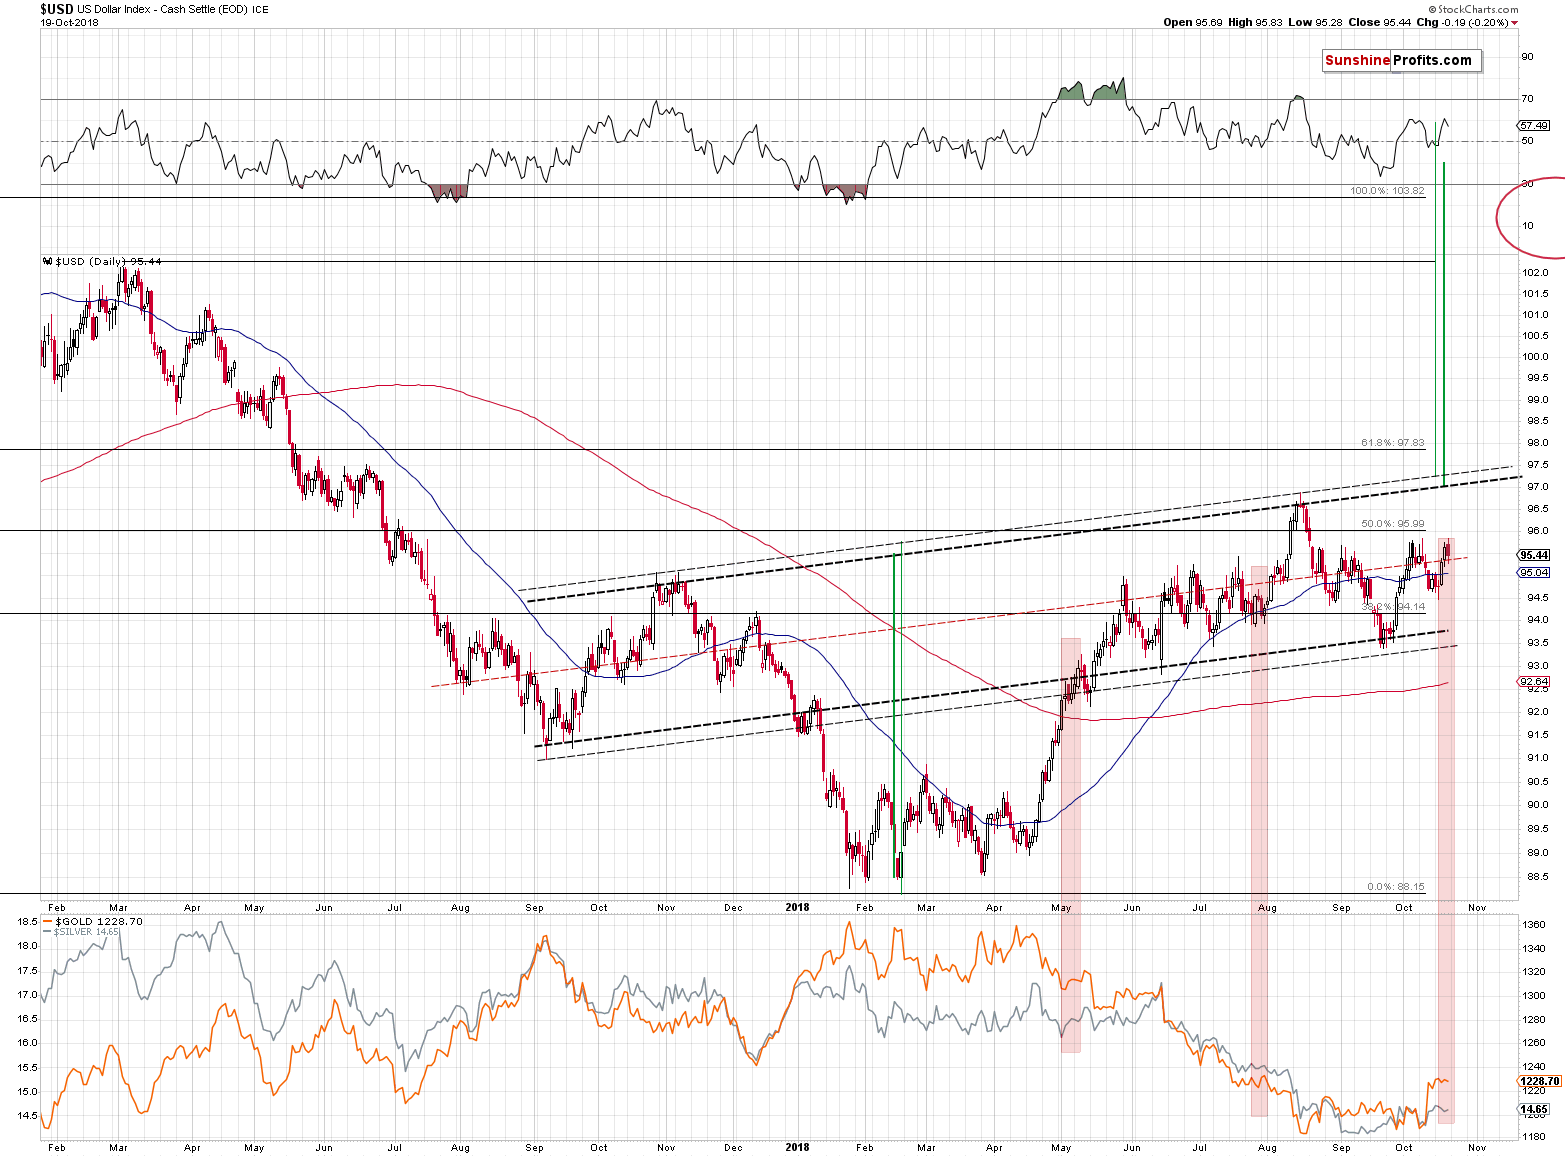
(…) It’s reflecting what happened during the previous decline. The April – May rally is similar to the December 2017 – January 2018 decline (reflection thereof) and the November 2017 top appears analogous to the August 2018 top.
The pattern’s existence is still the most important take-away from the above chart, but there’s one more that we would like to address. Namely, the current lack of action in the PMs relative to USD’s upswing doesn’t have to be bullish for the former. One reason is that gold tends to react to breakouts or breakouts in the USDX more than it reacts to regular price moves, and the other reason is that we saw something similar twice in the recent past.
Starting with the latter reason, the USD Index moved higher along with the PMs in early May. The situation quickly moved back to normal and gold declined in a profound way in the following weeks. The second similar case took place in late July. Gold didn’t rally along with the USDX, but it declined in a very insignificant manner, showing relative strength. It didn’t take long for gold to resume its downtrend.
Why was this the case? Most likely because the long-term factors are more important than the short-term ones and if they are not in tune, the long-term ones are likely to overpower the short-term ones, even though the short-term ones seem to be winning initially. We may be seeing the same thing also this time.
The USD Index is still within the rising trend channel and breakout above it (97 – 97.3) should definitely have major impact on the PM prices. But we don’t have to wait for so long. The USD Index is now right at the previous October high and very close to the September high. A decisive breakout above these highs could already be enough to trigger substantial reaction in the PMs. If we see this kind of breakout and PMs fail to react it might be an indication that gold, silver and mining stocks may need to correct higher before resuming their downtrend. For now, the outlook remains bearish.
In Friday’s intraday follow-up, we added:
(…) we saw something interesting in case of the USD Index and its link with the precious metals sector. Namely, today the USD Index moved lower, but the PMs are not visibly higher. This is important, because it confirms our analysis from today’s regular Alert. The precious metals investors and traders are likely not reacting to USD’s movement because they don’t view the current upswing as anything groundbreaking. The USDX remains below the previous highs and it might appear (in those investors’ and traders’ eyes) ready to decline once again. Just as the preceding rally was not exciting, today’s decline also appears to be “normal” and not worth acting upon.
The above means that supposedly bullish implications of the fact that gold had rallied along with USD, are not so bullish after all. If they were, gold should have responded to today’s weakness in the USDX with a visible rally, and it definitely didn’t.
Even though gold did practically nothing during the last few days, the analysis of the dynamics in the gold-USD link is critical. Gold’s willingness to react to the signals that it gets from other markets is one of the things that has been useful as a signal for many years without a decline in its usefulness (unlike the CoT reports, for instance, which were very effective about 15 years ago, but are not so reliable now). Consequently, monitoring the situation in this link is very important. There was a chance that the implications of this link were bullish, but this chance was practically invalidated by Friday’s action.
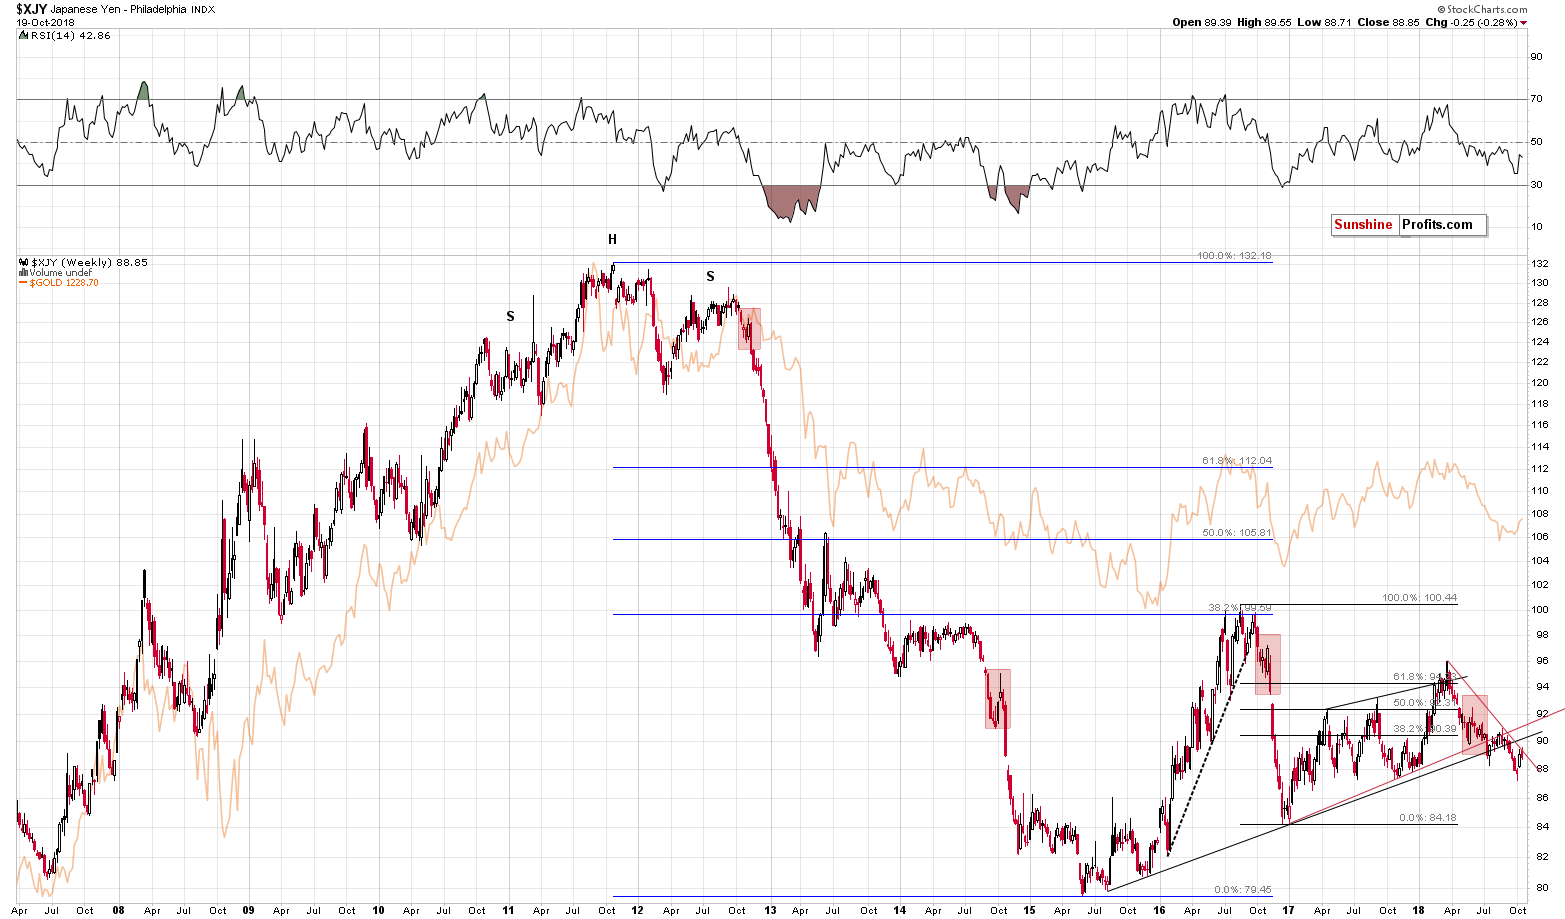
Let’s keep in mind that gold tends to follow yen more closely than it follows other currencies. And the yen just invalidated a small breakout above the declining medium-term resistance line. The outlook for the yen is now clearly bearish and the implications for the PMs are bearish as well.
Gold’s Upcoming Reversal
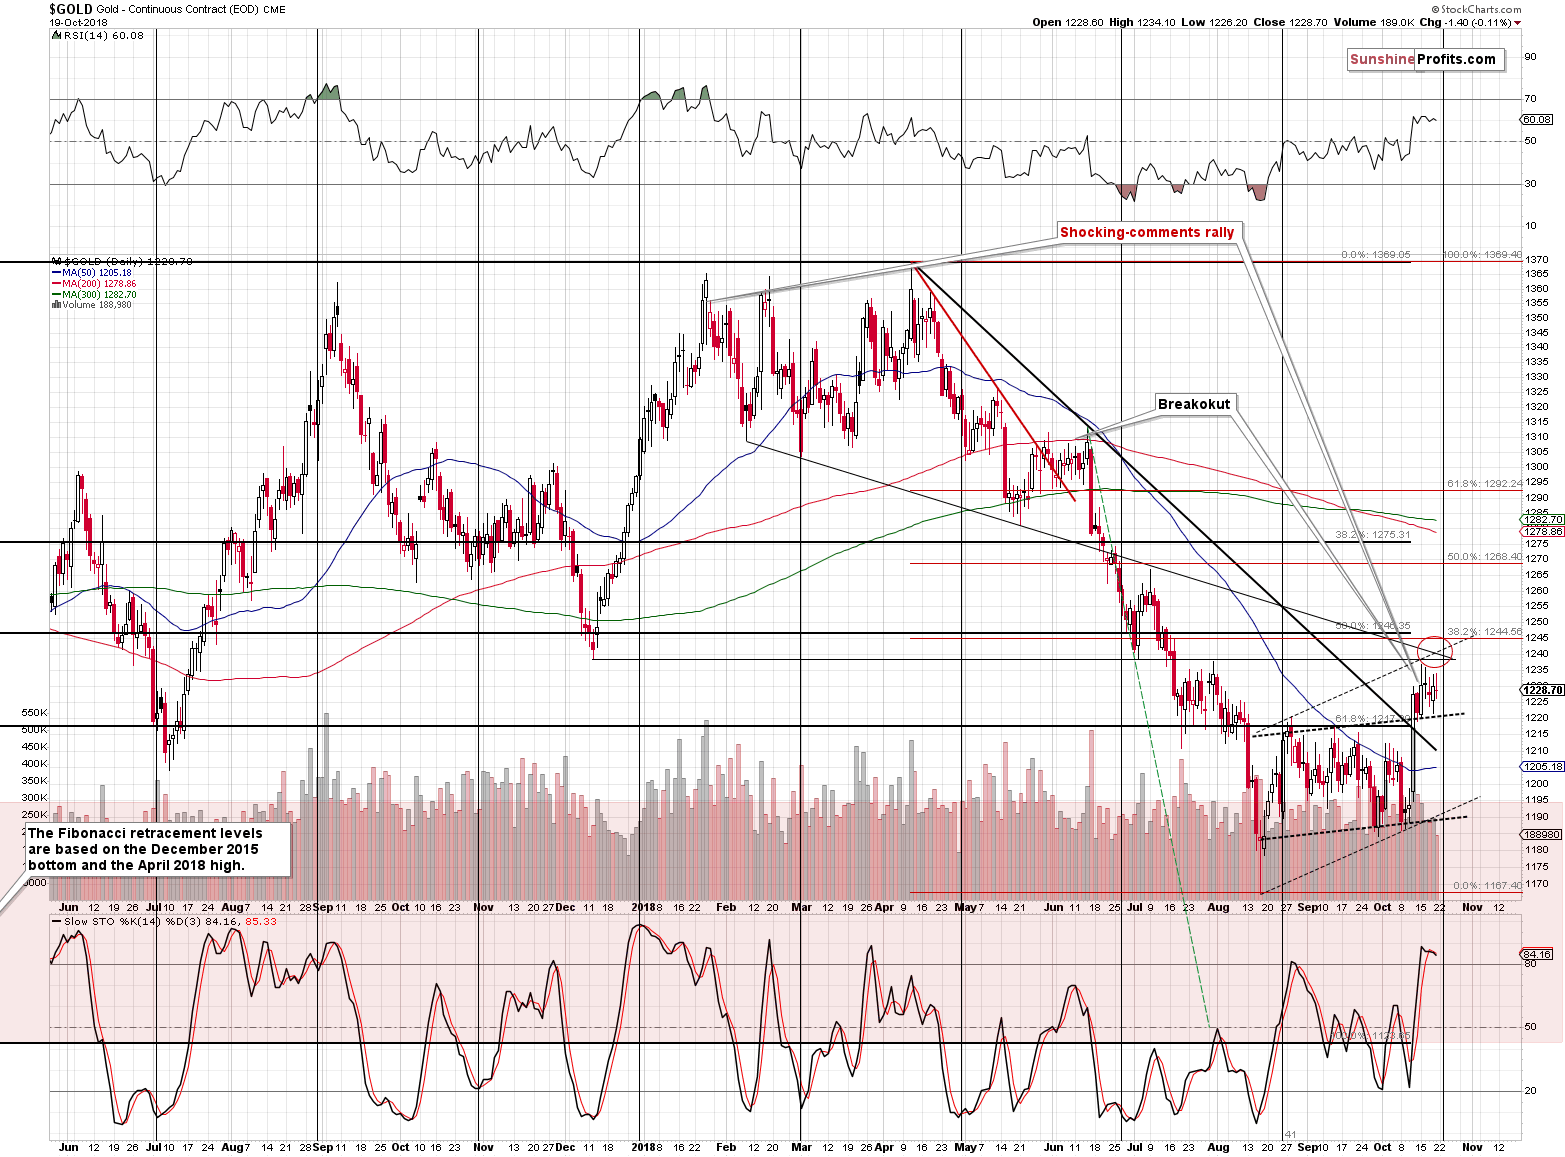
With all the bearish medium- and short-term factors in play, let’s not forget that the next cyclical turning point is just around the corner – on October 24th, which is this Wednesday.
The most recent short-term move was definitely up, so the implications are bearish. Let’s keep in mind that the turning points work on a near-to basis, so we might get a turnaround earlier or a day-two after this date. In short, gold is likely to reverse this week.
What is important, is that despite all the bearish factors, gold could still move a little higher before the reversal. It moved very close to our target area, so the top could be in, but we should not be surprised by a move to about $1,240 once again. The target area is based on the declining medium-term resistance line, the upper border of the rising flag pattern, the early July low and the December 2017 low. There are also two Fibonacci retracement levels, including the 38.2% retracement (about $1,245) based on the most recent decline. Reaching this level would also not change the outlook and it’s also something that could happen before the reversal and before the big decline resumes.
Important Analyses
Before summarizing, we would like to emphasize that we have recently posted several analyses that are very important and that one should keep in mind, especially in the next several weeks. If you haven’t had the chance of reading them previously, we encourage you to do so today:
- Dear Gold Investor - Letters from 2013 - Analogy to 2013, which should make it easier to trade the upcoming sizable upswing (if enough factors point to it, that is) and to enter the market close to the final bottom.
- Gold to Soar Above $6,000 - discussion of gold’s long-term upside target of $6,000.
- Preparing for THE Bottom in Gold: Part 6 – What to Buy - extremely important analysis of the portfolio structure for the next huge, multi-year rally in the precious metals.
- Preparing for THE Bottom in Gold: Part 7 – Buy-and-hold on Steroids - description of a strategy dedicated to significantly boosting one’s long-term investment returns while staying invested in the PM sector.
- Gold’s Downside Target, Upcoming Rebound, and Miners’ Buy Plan - details regarding the shape of the following price moves, a buying plan for mining stocks, and a brief discussion of the final price targets for the current decline.
- Gold: What Happened vs. What Changed - discussion of the latest extreme readings from gold’s CoT report
- Key Factors for Gold & Silver Investors - discussion of key, long-term factors that support the bearish outlook for PMs. We are often asked what makes us so bearish – this article is a reply to this question.
- The Upcoming Silver Surprise - two sets of price targets for gold, silver and mining stocks: the initial and the final one.
- Precious Metals Sector: It’s 2013 All Over Again - comparison between 2013 and 2018 throughout the precious metals sector, the general stock market and the USD Index. Multiple similarities point to the repeat of a 2013-style volatile decline in the PMs.
- Changing One's Mind - Why, When, and How – discussing the way of analyzing the market that helps to stay focused on the growing one’s capital while not being influenced by the loss aversion bias. This essay might be particularly useful in light of the recent upswing in the PMs.
Summary
Summing up, the breakout in gold is a bullish development for the short term, but the rally that was likely to be seen based on it, could have already taken place. There are multiple bearish signs in place that confirm that the rally is just a correction within a bigger decline and there are indications that point to a reversal taking place this week. All in all, it seems that the huge profits on our short positions will soon become enormous, even if it takes a few more days before that happens.
Also, we are moving the stop-loss level for gold $4 higher.
As always, we’ll keep you – our subscribers – informed.
To summarize:
Trading capital (supplementary part of the portfolio; our opinion): Full short positions (200% of the full position) in gold, silver and mining stocks are justified from the risk/reward perspective with the following stop-loss orders and exit profit-take price levels:
- Gold: profit-take exit price: $1,062; stop-loss: $1,257; initial target price for the DGLD ETN: $82.96; stop-loss for the DGLD ETN $49.27
- Silver: profit-take exit price: $12.72; stop-loss: $15.76; initial target price for the DSLV ETN: $46.97; stop-loss for the DSLV ETN $27.37
- Mining stocks (price levels for the GDX ETF): profit-take exit price: $13.12; stop-loss: $20.83; initial target price for the DUST ETF: $80.97; stop-loss for the DUST ETF $27.67
Note: the above is a specific preparation for a possible sudden price drop, it does not reflect the most likely outcome. You will find a more detailed explanation in our August 1 Alert. In case one wants to bet on junior mining stocks’ prices (we do not suggest doing so – we think senior mining stocks are more predictable in the case of short-term trades – if one wants to do it anyway, we provide the details), here are the stop-loss details and target prices:
- GDXJ ETF: profit-take exit price: $17.52; stop-loss: $31.23
- JDST ETF: initial target price: $154.97 stop-loss: $51.78
Long-term capital (core part of the portfolio; our opinion): No positions (in other words: cash)
Insurance capital (core part of the portfolio; our opinion): Full position
Important Details for New Subscribers
Whether you already subscribed or not, we encourage you to find out how to make the most of our alerts and read our replies to the most common alert-and-gold-trading-related-questions.
Please note that the in the trading section we describe the situation for the day that the alert is posted. In other words, it we are writing about a speculative position, it means that it is up-to-date on the day it was posted. We are also featuring the initial target prices, so that you can decide whether keeping a position on a given day is something that is in tune with your approach (some moves are too small for medium-term traders and some might appear too big for day-traders).
Plus, you might want to read why our stop-loss orders are usually relatively far from the current price.
Please note that a full position doesn’t mean using all of the capital for a given trade. You will find details on our thoughts on gold portfolio structuring in the Key Insights section on our website.
As a reminder – “initial target price” means exactly that – an “initial” one, it’s not a price level at which we suggest closing positions. If this becomes the case (like it did in the previous trade) we will refer to these levels as levels of exit orders (exactly as we’ve done previously). Stop-loss levels, however, are naturally not “initial”, but something that, in our opinion, might be entered as an order.
Since it is impossible to synchronize target prices and stop-loss levels for all the ETFs and ETNs with the main markets that we provide these levels for (gold, silver and mining stocks – the GDX ETF), the stop-loss levels and target prices for other ETNs and ETF (among other: UGLD, DGLD, USLV, DSLV, NUGT, DUST, JNUG, JDST) are provided as supplementary, and not as “final”. This means that if a stop-loss or a target level is reached for any of the “additional instruments” (DGLD for instance), but not for the “main instrument” (gold in this case), we will view positions in both gold and DGLD as still open and the stop-loss for DGLD would have to be moved lower. On the other hand, if gold moves to a stop-loss level but DGLD doesn’t, then we will view both positions (in gold and DGLD) as closed. In other words, since it’s not possible to be 100% certain that each related instrument moves to a given level when the underlying instrument does, we can’t provide levels that would be binding. The levels that we do provide are our best estimate of the levels that will correspond to the levels in the underlying assets, but it will be the underlying assets that one will need to focus on regarding the signs pointing to closing a given position or keeping it open. We might adjust the levels in the “additional instruments” without adjusting the levels in the “main instruments”, which will simply mean that we have improved our estimation of these levels, not that we changed our outlook on the markets. We are already working on a tool that would update these levels on a daily basis for the most popular ETFs, ETNs and individual mining stocks.
Our preferred ways to invest in and to trade gold along with the reasoning can be found in the how to buy gold section. Additionally, our preferred ETFs and ETNs can be found in our Gold & Silver ETF Ranking.
As a reminder, Gold & Silver Trading Alerts are posted before or on each trading day (we usually post them before the opening bell, but we don't promise doing that each day). If there's anything urgent, we will send you an additional small alert before posting the main one.
=====
Latest Free Trading Alerts:
Stocks were mixed on Friday, as investors hesitated following Thursday's downward reversal. The S&P 500 index remained below the level of 2,800. Is this just a downward correction or a new leg within the downtrend?
More Fluctuations - Bottom or Just Pause Before Another Sell-off?
In recent days, the British pound declined quite sharply against the greenback, which caused several negative developments. Will currency bears be strong enough to trigger further deterioration in the coming week?
Why Is the Weakness In GBP/USD Likely?
=====
Thank you.
Sincerely,
Przemyslaw Radomski, CFA
Founder, Editor-in-chief, Gold & Silver Fund Manager
Gold & Silver Trading Alerts
Forex Trading Alerts
Oil Investment Updates
Oil Trading Alerts

