

Briefly: in our opinion, full (200% of the regular size of the position) speculative short positions in gold, silver and mining stocks are justified from the risk/reward perspective at the moment of publishing this alert.
Gold, silver, and mining stocks once again tried to rally yesterday and once again they closed the session almost unchanged. Seems bearish at the first sight. Then again, the USD Index rallied for yet another day and precious metals didn’t decline despite of this, which appears to be a major bearish indication. Which of these signals should one trust?
None. The truth is that it’s not a matter of trust – it’s a matter of calculating probabilities for different scenarios and for outlook in general and adjusting one’s positions based on these adjustments. Consequently, both should be examined closely. Things are not always what they seem at the first sight and we care too much about your investments and trades to just blindly accept what “seems to be the case”.
Let’s start with the failed attempts of the PMs and miners to move higher.
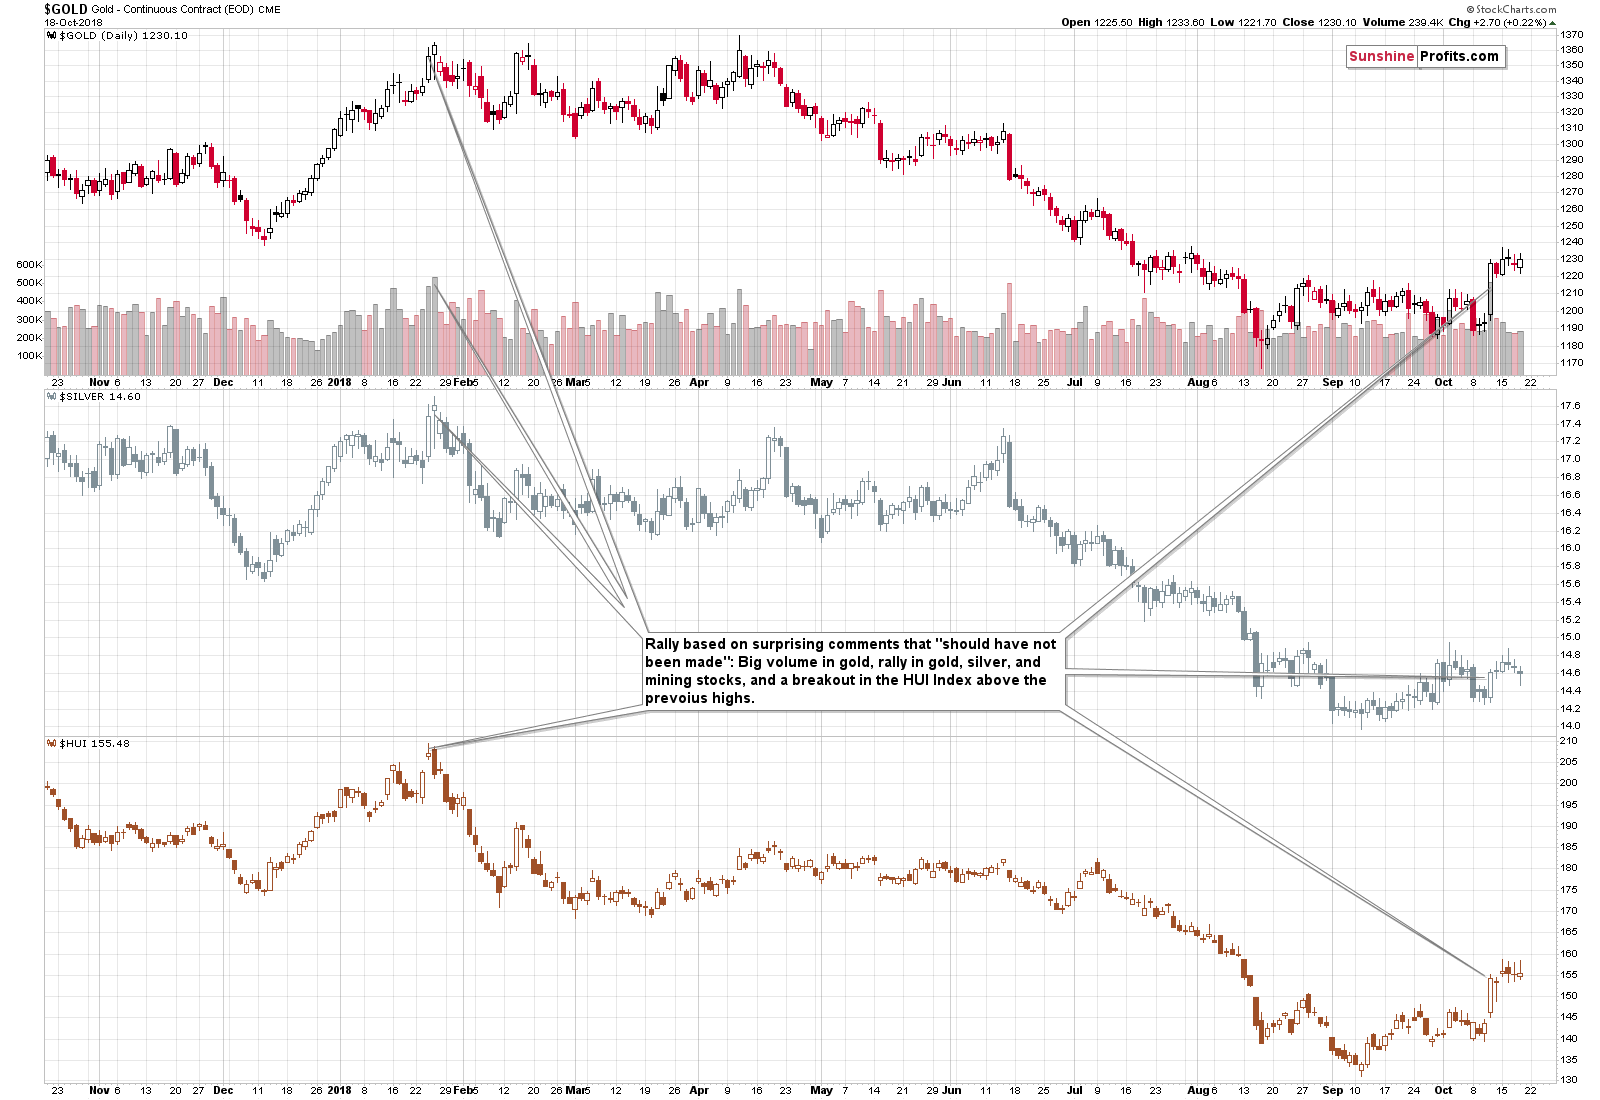
The situation is unique and quite normal at the same time. We saw the failed attempts of gold, silver and mining stocks to move higher, but the situation was never very similar to what we see now.
In general, the implications of what we’re seeing is bearish because there is not enough strength among the PM investors to push metals and miners higher. If the latter can’t move higher, then it might move lower once some kind of trigger arrives (or even if it doesn’t; but seeing it would speed things up).
After last week’s daily rally, we wrote that the rally may already be over or close to being over. At this time, this still remains to be the case – the prices didn’t move visibly higher.
In case of silver, we saw something similar to what we saw recently in early October, right before the big daily decline. But, we also saw something similar in early September, right before (and on) silver’s short-term bottom. The implications are somewhat mixed.
In case of gold, we saw something similar in early June, and – to some extent – in the third week of April. The implications are bearish.
In case of the HUI Index, the situation is more complicated, because there was no very similar case in the recent past. One of the similar cases is what we saw in the third week of April (that was a top), but the other case is what we saw in early October, which was a local bottom).
Overall, the very short-term implications of the above analogies are rather unclear, but they do suggest that outlook should clarify shortly.
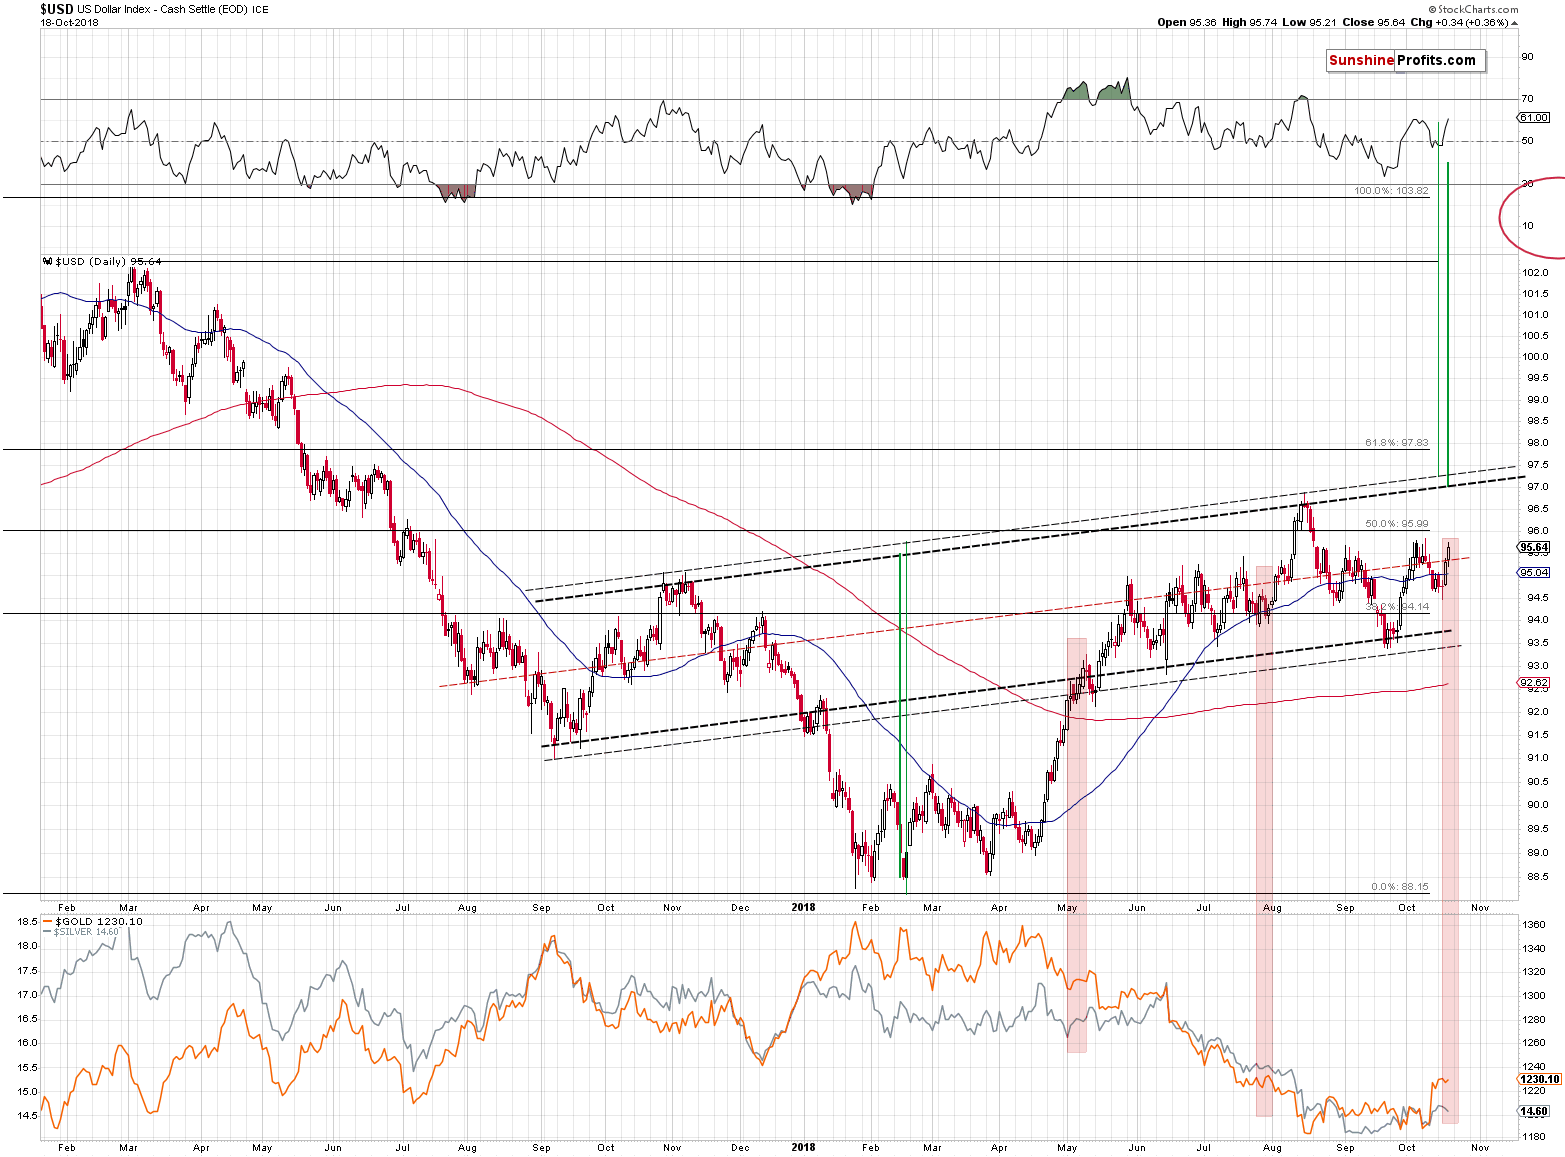
In the previous Alerts, we wrote the following about the situation in the USD Index:
(…) It’s reflecting what happened during the previous decline. The April – May rally is similar to the December 2017 – January 2018 decline (reflection thereof) and the November 2017 top appears analogous to the August 2018 top.
After we wrote about it for the first time a few weeks ago, the USD Index provided additional signs of this reflective pattern’s validity. The USD Index is now in a correction that takes it from the upper part (above the red line) of the trading channel to its lower part. In light of the above-mentioned pattern, this means that what we are seeing either the reflection of what happened in late August 2017 or in early August 2017. Or something in between – the analogy doesn’t have to be (and it wasn’t so far) extremely precise, only more or less so.
The important thing is that both August 2017 corrections started with intraday reversals. Since we have just seen one, it’s quite likely the case that the corrective decline in the USDX is over. The implications are bullish for the USD Index, which is, in turn, bearish for the precious metals sector.
What we saw yesterday was yet another confirmation of the above pattern. The USD Index rallied after the above-mentioned reversal and moved back to the middle of the rising channel marked with the red line. The technical road to the upper band of the channel is now open. The USDX may break above the channel (the current resistance is at 97 – 97.3) right away, or we may see an additional pause analogous to what we saw in the first half of August 2017. It could also be the case that the USDX moves sideways around the current levels and rallies then. The most important thing is that the reflective pattern remains in place and that it has very bullish implications for the following weeks. This means that the implications for the following weeks are very bearish for the precious metals sector.
The pattern’s existence is still the most important take-away from the above chart, but there’s one more that we would like to address. Namely, the current lack of action in the PMs relative to USD’s upswing doesn’t have to be bullish for the former. One reason is that gold tends to react to breakouts or breakouts in the USDX more than it reacts to regular price moves, and the other reason is that we saw something similar twice in the recent past.
Starting with the latter reason, the USD Index moved higher along with the PMs in early May. The situation quickly moved back to normal and gold declined in a profound way in the following weeks. The second similar case took place in late July. Gold didn’t rally along with the USDX, but it declined in a very insignificant manner, showing relative strength. It didn’t take long for gold to resume its downtrend.
Why was this the case? Most likely because the long-term factors are more important than the short-term ones and if they are not in tune, the long-term ones are likely to overpower the short-term ones, even though the short-term ones seem to be winning initially. We may be seeing the same thing also this time.
The USD Index is still within the rising trend channel and breakout above it (97 – 97.3) should definitely have major impact on the PM prices. But we don’t have to wait for so long. The USD Index is now right at the previous October high and very close to the September high. A decisive breakout above these highs could already be enough to trigger substantial reaction in the PMs. If we see this kind of breakout and PMs fail to react it might be an indication that gold, silver and mining stocks may need to correct higher before resuming their downtrend. For now, the outlook remains bearish.
Important Analyses
Before summarizing, we would like to emphasize that we have recently posted several analyses that are very important and that one should keep in mind, especially in the next several weeks. If you haven’t had the chance of reading them previously, we encourage you to do so today:
- Dear Gold Investor - Letters from 2013 - Analogy to 2013, which should make it easier to trade the upcoming sizable upswing (if enough factors point to it, that is) and to enter the market close to the final bottom.
- Gold to Soar Above $6,000 - discussion of gold’s long-term upside target of $6,000.
- Preparing for THE Bottom in Gold: Part 6 – What to Buy - extremely important analysis of the portfolio structure for the next huge, multi-year rally in the precious metals.
- Preparing for THE Bottom in Gold: Part 7 – Buy-and-hold on Steroids - description of a strategy dedicated to significantly boosting one’s long-term investment returns while staying invested in the PM sector.
- Gold’s Downside Target, Upcoming Rebound, and Miners’ Buy Plan - details regarding the shape of the following price moves, a buying plan for mining stocks, and a brief discussion of the final price targets for the current decline.
- Gold: What Happened vs. What Changed - discussion of the latest extreme readings from gold’s CoT report
- Key Factors for Gold & Silver Investors - discussion of key, long-term factors that support the bearish outlook for PMs. We are often asked what makes us so bearish – this article is a reply to this question.
- The Upcoming Silver Surprise - two sets of price targets for gold, silver and mining stocks: the initial and the final one.
- Precious Metals Sector: It’s 2013 All Over Again - comparison between 2013 and 2018 throughout the precious metals sector, the general stock market and the USD Index. Multiple similarities point to the repeat of a 2013-style volatile decline in the PMs.
- Changing One's Mind - Why, When, and How – discussing the way of analyzing the market that helps to stay focused on the growing one’s capital while not being influenced by the loss aversion bias. This essay might be particularly useful in light of the recent upswing in the PMs.
Summary
Summing up, the breakout in gold is a bullish development for the short term, but the rally that was likely to be seen based on it, could have already taken place. This is especially the case given the shape of Monday’s session in mining stocks – a clear reversal, the intraday outperformance of silver, and in light of the recent intraday reversal in the USD Index that was followed by a rally. All in all, it seems that the huge profits on our short positions will soon become enormous, even if it takes a few more days before that happens.
With the USD Index at its previous highs, ending week and platinum almost right at its 2016 low in terms of the weekly closing prices, it seems that quite a lot could change regarding the outlook based on today’s daily (and weekly) closing price. That’s why we will send you one additional Alert today before the session is over and we may adjust the size of the current position in it. We may increase or decrease it based on what we see today. As a reminder, the invalidation of the breakdown below the previous long-term bottom in platinum was the main reason behind decreasing the size of the current short position from 250% to 200% of the regular position size. With a new breakdown, the outlook may become more bearish once again. On the other hand, if USD continues to rally and PMs continue to show strength, the outlook could become less bearish for the short term.
As always, we’ll keep you – our subscribers – informed.
To summarize:
Trading capital (supplementary part of the portfolio; our opinion): Full short positions (200% of the full position) in gold, silver and mining stocks are justified from the risk/reward perspective with the following stop-loss orders and exit profit-take price levels:
- Gold: profit-take exit price: $1,062; stop-loss: $1,253; initial target price for the DGLD ETN: $82.96; stop-loss for the DGLD ETN $49.47
- Silver: profit-take exit price: $12.72; stop-loss: $15.76; initial target price for the DSLV ETN: $46.97; stop-loss for the DSLV ETN $27.37
- Mining stocks (price levels for the GDX ETF): profit-take exit price: $13.12; stop-loss: $20.83; initial target price for the DUST ETF: $80.97; stop-loss for the DUST ETF $27.67
Note: the above is a specific preparation for a possible sudden price drop, it does not reflect the most likely outcome. You will find a more detailed explanation in our August 1 Alert. In case one wants to bet on junior mining stocks’ prices (we do not suggest doing so – we think senior mining stocks are more predictable in the case of short-term trades – if one wants to do it anyway, we provide the details), here are the stop-loss details and target prices:
- GDXJ ETF: profit-take exit price: $17.52; stop-loss: $31.23
- JDST ETF: initial target price: $154.97 stop-loss: $51.78
Long-term capital (core part of the portfolio; our opinion): No positions (in other words: cash)
Insurance capital (core part of the portfolio; our opinion): Full position
Important Details for New Subscribers
Whether you already subscribed or not, we encourage you to find out how to make the most of our alerts and read our replies to the most common alert-and-gold-trading-related-questions.
Please note that the in the trading section we describe the situation for the day that the alert is posted. In other words, it we are writing about a speculative position, it means that it is up-to-date on the day it was posted. We are also featuring the initial target prices, so that you can decide whether keeping a position on a given day is something that is in tune with your approach (some moves are too small for medium-term traders and some might appear too big for day-traders).
Plus, you might want to read why our stop-loss orders are usually relatively far from the current price.
Please note that a full position doesn’t mean using all of the capital for a given trade. You will find details on our thoughts on gold portfolio structuring in the Key Insights section on our website.
As a reminder – “initial target price” means exactly that – an “initial” one, it’s not a price level at which we suggest closing positions. If this becomes the case (like it did in the previous trade) we will refer to these levels as levels of exit orders (exactly as we’ve done previously). Stop-loss levels, however, are naturally not “initial”, but something that, in our opinion, might be entered as an order.
Since it is impossible to synchronize target prices and stop-loss levels for all the ETFs and ETNs with the main markets that we provide these levels for (gold, silver and mining stocks – the GDX ETF), the stop-loss levels and target prices for other ETNs and ETF (among other: UGLD, DGLD, USLV, DSLV, NUGT, DUST, JNUG, JDST) are provided as supplementary, and not as “final”. This means that if a stop-loss or a target level is reached for any of the “additional instruments” (DGLD for instance), but not for the “main instrument” (gold in this case), we will view positions in both gold and DGLD as still open and the stop-loss for DGLD would have to be moved lower. On the other hand, if gold moves to a stop-loss level but DGLD doesn’t, then we will view both positions (in gold and DGLD) as closed. In other words, since it’s not possible to be 100% certain that each related instrument moves to a given level when the underlying instrument does, we can’t provide levels that would be binding. The levels that we do provide are our best estimate of the levels that will correspond to the levels in the underlying assets, but it will be the underlying assets that one will need to focus on regarding the signs pointing to closing a given position or keeping it open. We might adjust the levels in the “additional instruments” without adjusting the levels in the “main instruments”, which will simply mean that we have improved our estimation of these levels, not that we changed our outlook on the markets. We are already working on a tool that would update these levels on a daily basis for the most popular ETFs, ETNs and individual mining stocks.
Our preferred ways to invest in and to trade gold along with the reasoning can be found in the how to buy gold section. Additionally, our preferred ETFs and ETNs can be found in our Gold & Silver ETF Ranking.
As a reminder, Gold & Silver Trading Alerts are posted before or on each trading day (we usually post them before the opening bell, but we don't promise doing that each day). If there's anything urgent, we will send you an additional small alert before posting the main one.
=====
Latest Free Trading Alerts:
It was supposed to make gold rally. We mean, of course, the quantitative tightening. But one year after it started, the yellow metal still does not shine. We invite you to read our detailed analysis of the Fed’s balance sheet unwind and find out what does it imply for the gold market.
One Year after QT Started, Gold Still Unmoved
=====
Hand-picked precious-metals-related links:
PRECIOUS-Gold on track for third weekly gain as stocks retreat
London gold association plans to approve blockchain trackers
Asia Gold-India festival demand dims as price rally bites
=====
In other news:
U.S. Futures Gain as Europe Struggles; Dollar Dips: Markets Wrap
Euro stuck near two-month low as EU challenges Italy budget
Full Employment? The Economy Isn't Acting Like It
Japan inflation ticks up as oil rises but the central bank's target remains elusive
Exclusive: OPEC, allies struggle to fully deliver pledged oil output boost - internal document
Oil up but set for weekly loss on stock build, trade row
=====
Thank you.
Sincerely,
Przemyslaw Radomski, CFA
Founder, Editor-in-chief, Gold & Silver Fund Manager
Gold & Silver Trading Alerts
Forex Trading Alerts
Oil Investment Updates
Oil Trading Alerts

