

Briefly: in our opinion, full (300% of the regular position size) speculative short positions in mining stocks are justified from the risk/reward point of view at the moment of publishing this Alert.
Gold’s big reversal turned out to be a fake pattern as gold and mining stocks moved to new yearly intraday lows yesterday (Mar. 4). This means that the odds for seeing an immediate rally from here without another quick move lower, have diminished.
Let’s start with gold’s chart.
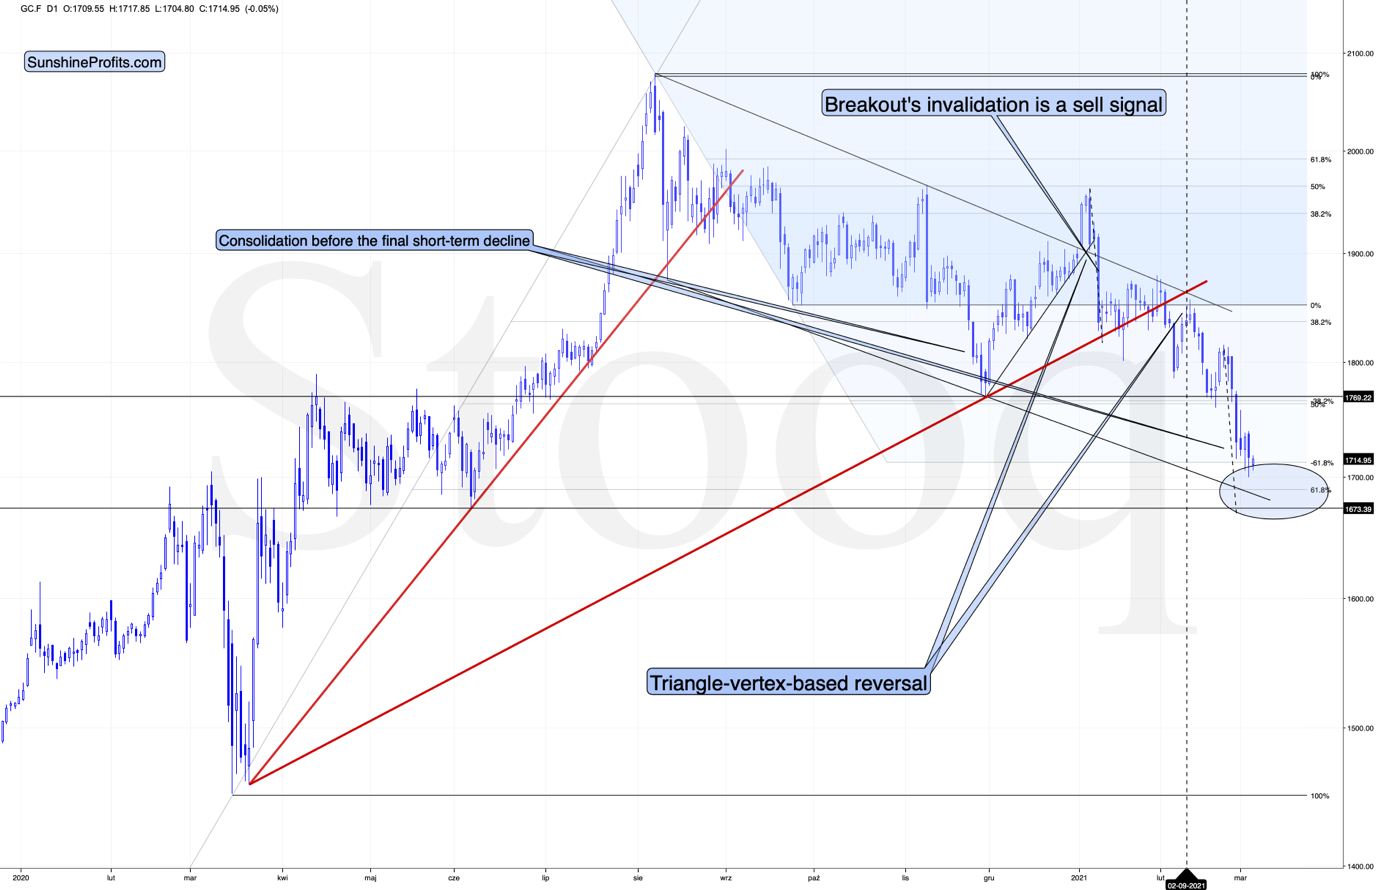
Figure 1 – COMEX Gold Futures (GC.F)
In short, gold is moving back and forth but with lower intraday lows. This kind of pause is bearish as it doesn’t show any meaningful strength of the yellow metal, especially that the USD Index didn’t move to new highs when gold moved to new lows.
Can the temporary bottom be in? Yes. Is it likely to be in? Not necessarily. Most likely it’s not in yet, because gold still hasn’t moved to its strong support levels.
The size of the first part of the move sometimes tends to be identical or near-identical to the size of the final move. The size of the initial, August decline was almost just like the November decline. Now, copying the January 2021 decline to the current situation (blue, dashed lines), provides us with the target at about $1,675.
The above price area coincides with the previous 2020 lows, and it’s also slightly below the 61.8% Fibonacci retracement based on the entire 2020 upswing. Gold would be likely to at least reach this retracement before forming the temporary bottom.
Consequently, it would not be surprising to see gold suffering another ~$50 decline before finding a short-term bottom. More importantly though, if the initial move lower coincides with an S&P 500 correction, it would be likely to push mining stocks and silver lower in a more visible way.
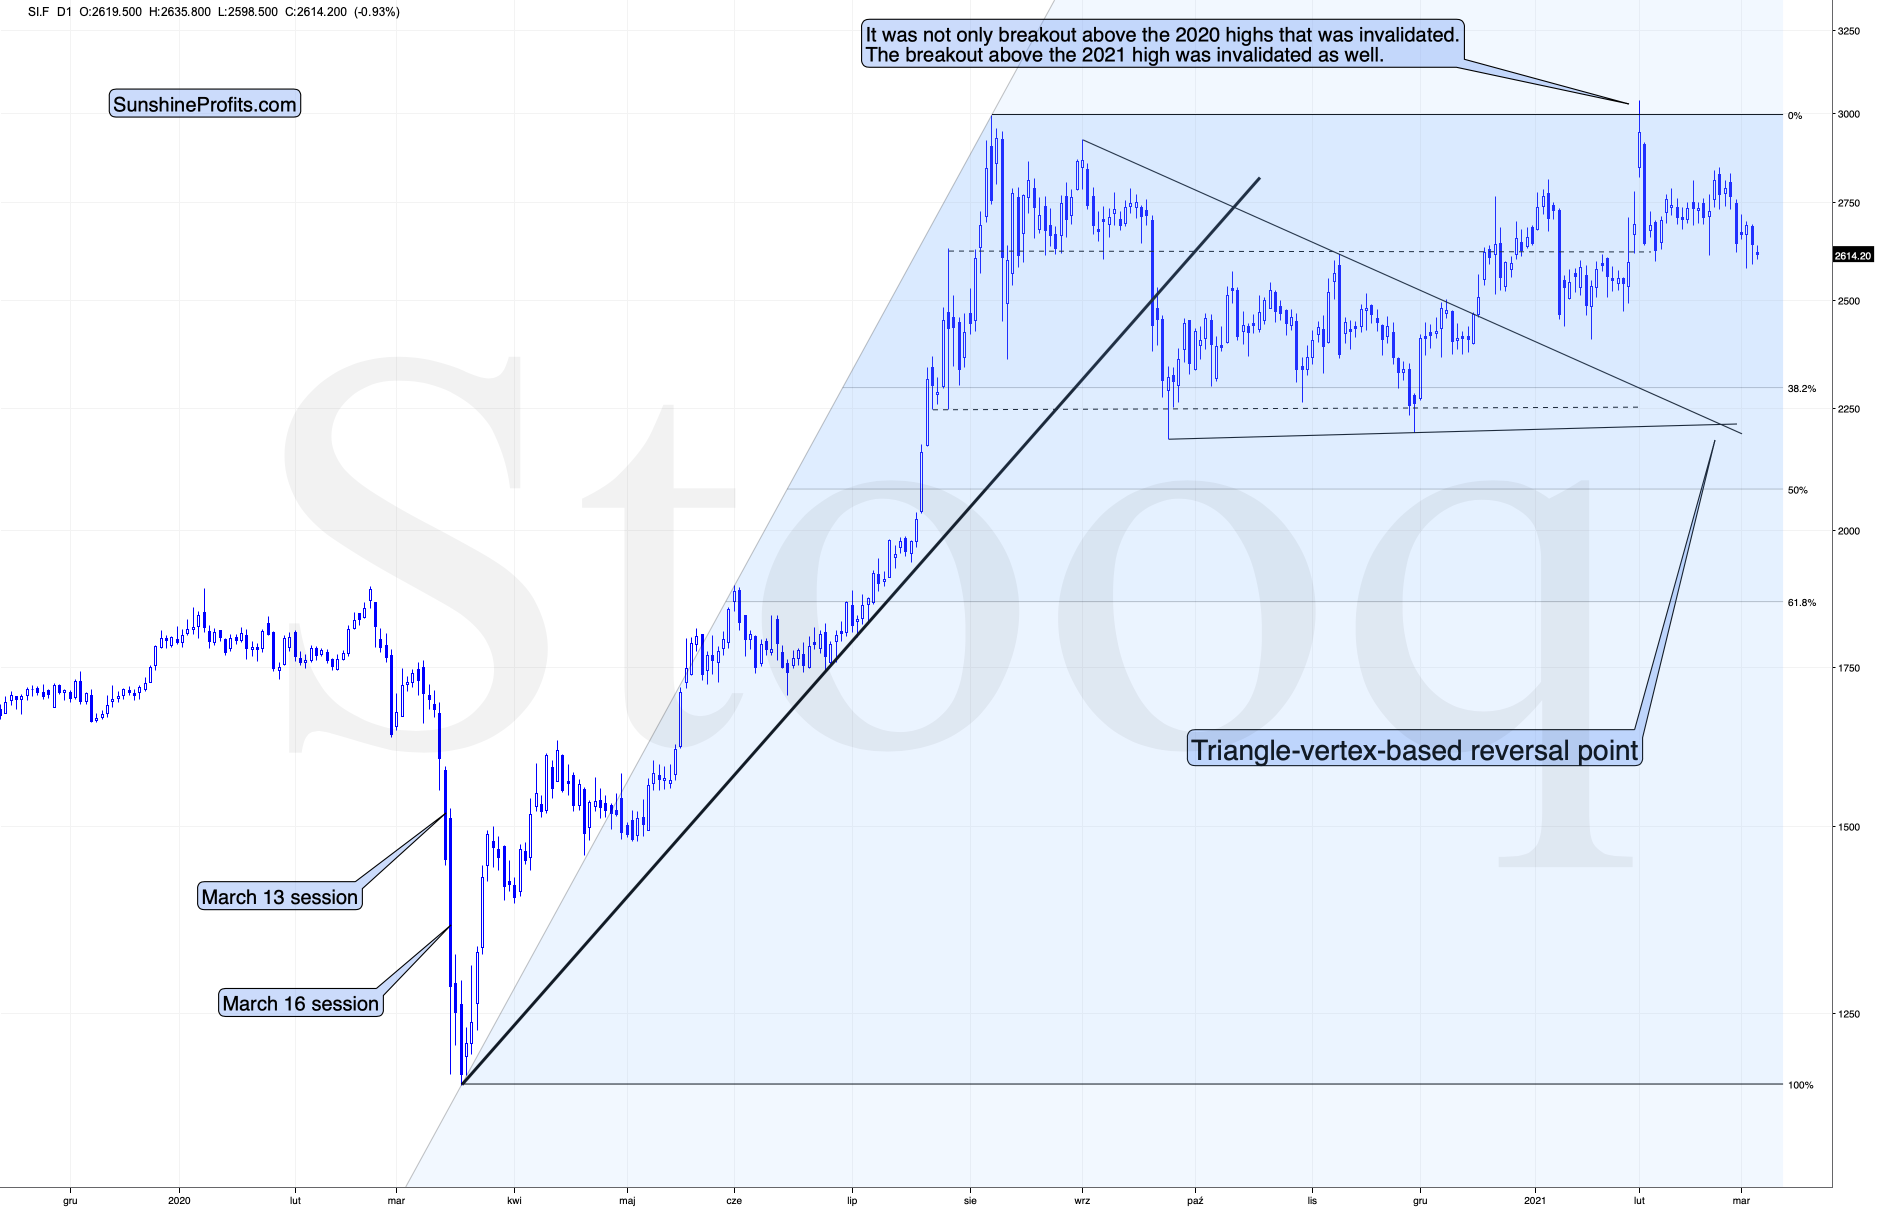
Figure 2 – COMEX Silver Futures
Silver is not doing much at this time. It reversed once again yesterday, but it’s still lower in today’s pre-market trading, so I’m not buying the bullish narrative just yet.
I previously wrote that silver is likely to catch up with the decline at its later stage, while miners are likely to lead the way. That’s exactly what we’ve been seeing in the last few months. Silver is still likely to catch up with the declines when silver investors panic – just as they tend to do close to the end of given price moves (selling close to the bottom and buying close to the top). So far, miners remain the asset of choice for trading, but sometime during the next downswing, we might move to silver in order to magnify gains from both declines. As a reminder, please consider what happened on March 13 and March 16, 2020 and consider that the GDX ETF bottomed (in terms of the daily closing prices) on March 13. That was when silver was only in the middle of its decline.
Speaking of mining stocks, let’s take a look at the GDX ETF chart.
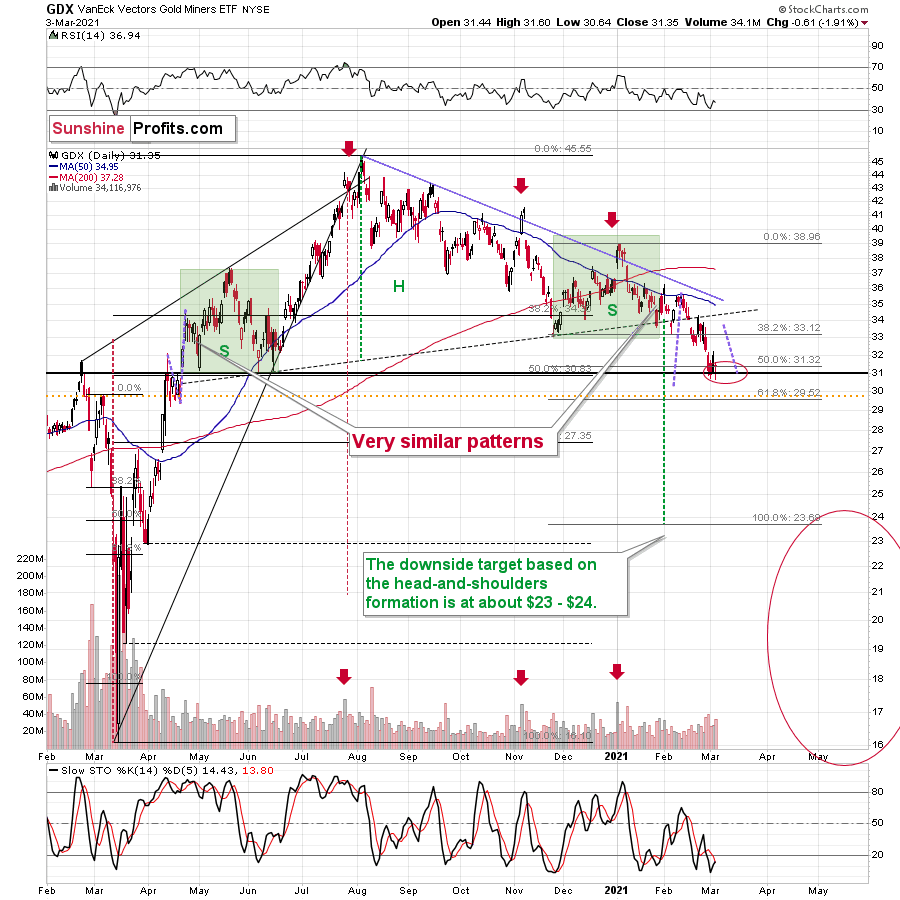
Figure 3 - VanEck Vectors Gold Miners ETF (GDX)
Just like gold, mining stocks are moving back and forth without any sign of strength. If miners were just after an important short-term bottom, they would be likely to show some strength relative to gold now. Moving to new yearly lows is the opposite of strength.
The most likely outcome is that we see an immediate move lower once again as gold declines to $1,675 or so, but it could also be the case that miners correct to $33 - $34 now, and then move to new lows later.
All in all, it seems that we are already seeing the corrective upswing, or one is about to start after another very short-term downswing. The latter is more probable. Once this corrective upswing is over, the downtrend is likely to resume.
Why would this be the case? There are myriads of reasons and I’m going over most of them each week in my flagship Gold & Silver Trading Alerts, but to name just a few, it’s gold’s invalidation of the breakout above its 2011 high, despite having an extremely positive fundamental picture, gold’s weak performance relative to the USD Index, miners’ relatively weak performance compared to gold, and the medium-term breakout in the USDX.
And speaking of the USD Index, let’s take a look at its chart.
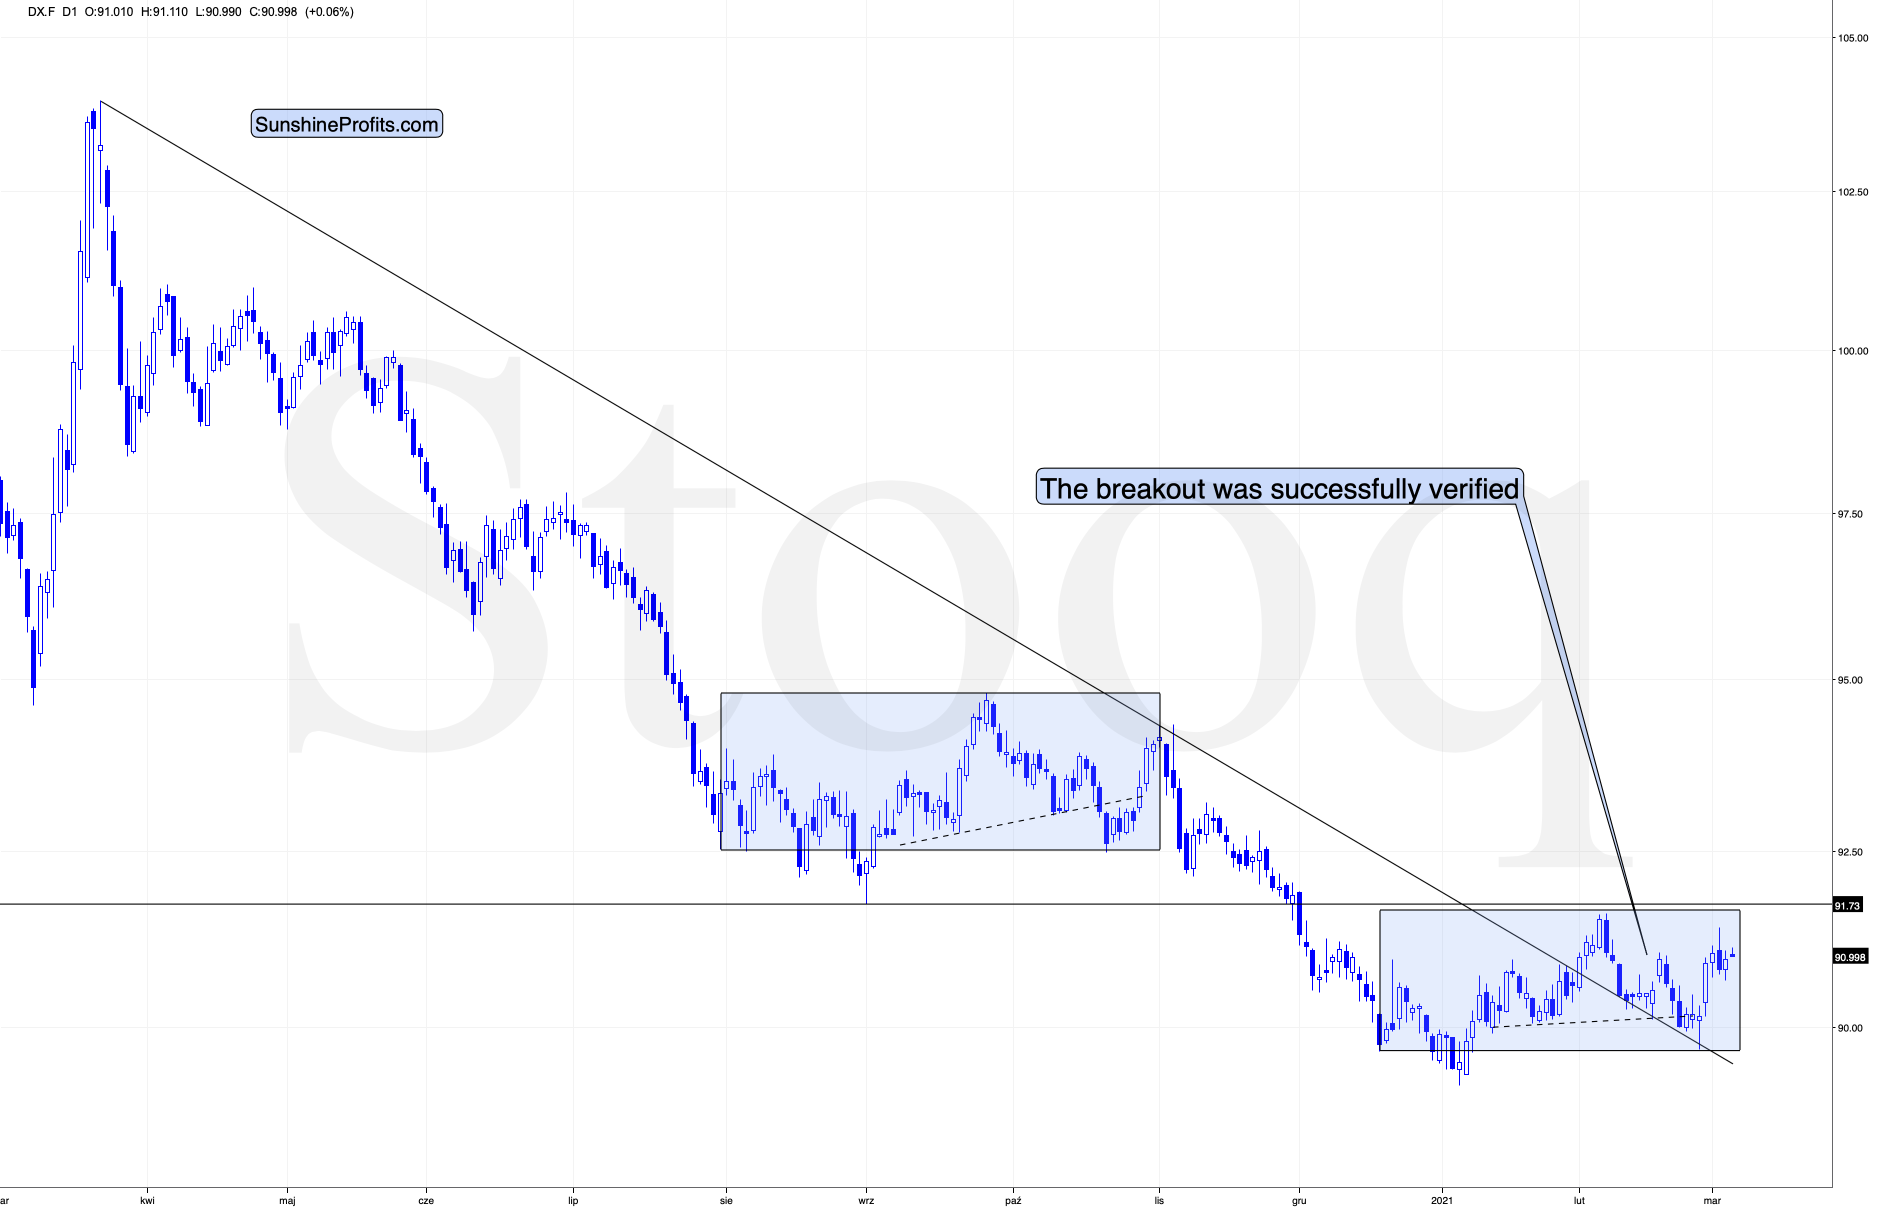
Figure 4 – USD Index
While the medium-term breakout continues to be the most important technical development visible on the above chart (with important bullish implications for the following months), there is one factor that could make the USD Index decline on a temporary basis.
This factor is the similarity to the mid-2020 price pattern. I previously commented on the head and shoulders pattern that had formed (necklines are marked with dashed lines), but that I didn’t trust. Indeed, this formation was invalidated, but a bigger pattern, of which this formation was part, wasn’t invalidated.
The patterns start with a broad bottom and an initial rally. Then it turns out that the initial rally is the head of a head-and-shoulders pattern that is then completed and invalidated. This is followed by a sharp rally, and then a reversal with a sizable daily decline.
So far, the situations are similar.
Last year, this pattern was followed by a decline to new lows. Now, based on the breakout above the rising medium-term support line, such a bearish outcome doesn’t seem likely, but we might see the pattern continue for several more days, before they disconnect. After all, this time, the USD Index is likely to really rally – similarly to how it soared in 2018 – and not move to new lows.
What happens before the patterns disconnect? The USD Index could decline temporarily.
Back in November 2020, when the USD Index topped, it then declined without looking back until it moved close to the previous yearly lows. Yesterday’s daily decline already shows that things are somewhat different this time. But did the self-similar pattern break yet? It’s more likely based on yesterday’s price action, but it’s not yet clear.
This means that the temporary bottom in the precious metals and miners could have already formed, but it’s more likely that it hasn’t.
Let’s take a look at the junior miners ETF – the GDXJ.
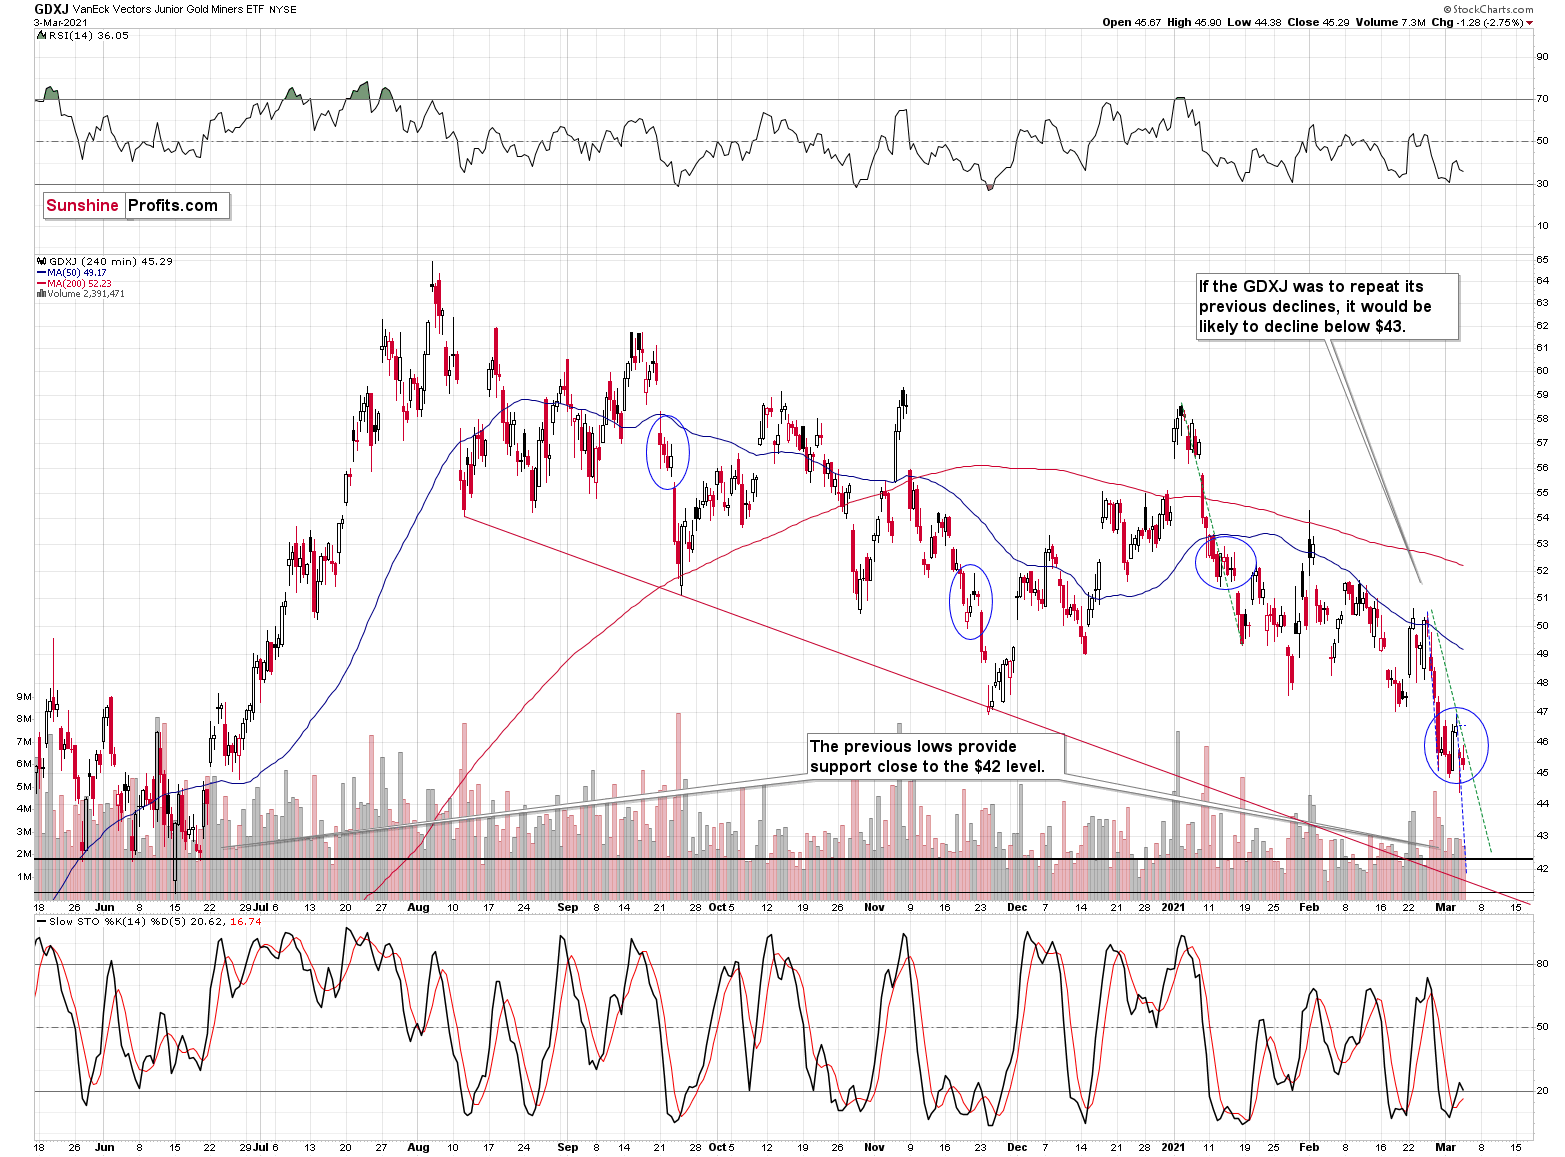
Figure 5 – VanEck Vectors Junior Miners ETF (GDXJ)
I previously commented on this ETF in the following way:
There is strong support at about $42.5 in the GDXJ ETF, so I expect to see a corrective upswing once the price gets there. The move could be similar in nature to what we saw at the beginning of last March. The rally took just several days, and it was then erased just as quickly. Looking at the above chart from the 4-hour point of view provides us with two more confirmations of this target on an approximate basis.
These two factors are analogies to the sizes of previous declines. Copying the initial 2021 decline to the current situation (marked with green) provides us with $42.5 as the next target, and copying the very recent decline and then pasting it over the most recent intraday high (marked with blue), provides us with a target slightly below $42.
The additional support at this area comes from the declining red support line that’s based on the previous intraday lows. Please note that this line has already triggered a sizable short-term reversal in late November, so it’s not something worth ignoring.
Moreover, please note that the RSI indicator (upper part of the above chart) is just above 30, and when this level is reached, it usually corresponds to a short-term buying opportunity. Back in November, the RSI moved visibly below this level before the bottom was formed. So, the RSI is yet another reason to expect a rebound, once prices decline one more time.
The above remains up-to-date, and today I’d like to add that all three biggest short-term declines from the recent past included some kind of back-and-forth-trading pause it’s in middle or close to its end. I marked those situations with blue ellipses. Consequently, the fact that we are seeing a pause right now is not bullish per se. Conversely, it’s a quite normal part of a move lower.
All in all, markets tend to reverse only after reaching important support or resistance levels, which means that PMs and miners might still move lower before their short-term corrective upswing, but it could also be the case that the latter is already underway. Depending on how many confirmations we get of the bullish outlook, it might or might not be a good idea to enter temporary long positions here. After all, the medium-term downtrend started in August 2020 and it remains intact – thus, quick long positions are against the trend and thus riskier.
Having said that, let’s take a look at the markets from the more fundamental point of view.
Operation Twist 3.0
With U.S. equities suffering another derailment on Mar. 3, the precious metals were once again caught up in the wreckage. And because the PMs don’t operate in a vacuum, I’ve warned on several occasions that equity-market stress often reverberates across the precious metals’ market.
Please see below:
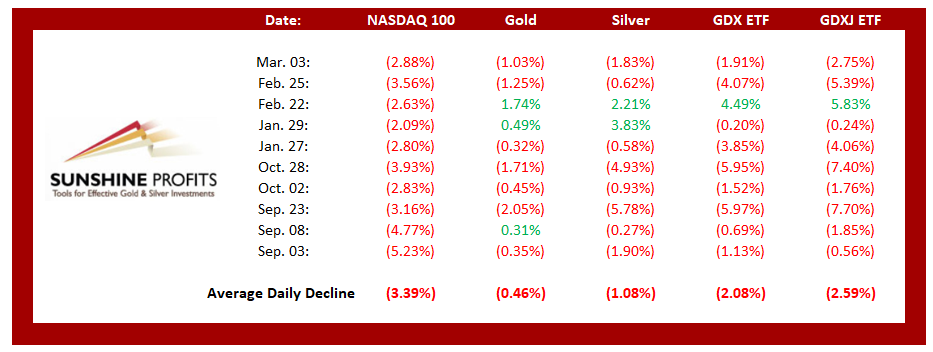
Figure 6
For context, I wrote previously:
If you analyze the table above, you can see that NASDAQ 100 drawdowns of more than 2.00% tend to unnerve the PMs. Moreover, if you exclude silver’s short squeeze on Jan. 29 and the NASDAQ 100’s relatively ‘quiet’ 2.63% drawdown on Feb. 22, bouts of equity volatility significantly impact the PMs (especially the miners).
But what’s causing the sudden crisis of confidence?
Well, to reiterate what I wrote on Feb. 24, Jerome Powell, Chairman of the U.S. Federal Reserve (FED), has lost control of the bond market.
Waking up to another spike on Mar. 3, the behavior of the U.S. 5-Year, 7-Year and 10-Year Treasury yields continues to rattle investors. Surging by nearly 9% on the day, the U.S. 5-Year Treasury yield has become increasingly unhinged.
Please see below:
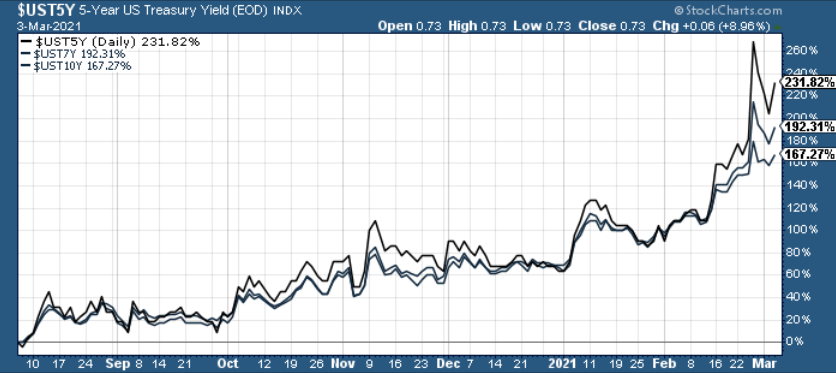
Figure 7
Yesterday, I also emphasized that while he’ll never admit it, it’s clear that investors are starting to doubt Powell’s ability to maintain a financial-market nirvana.
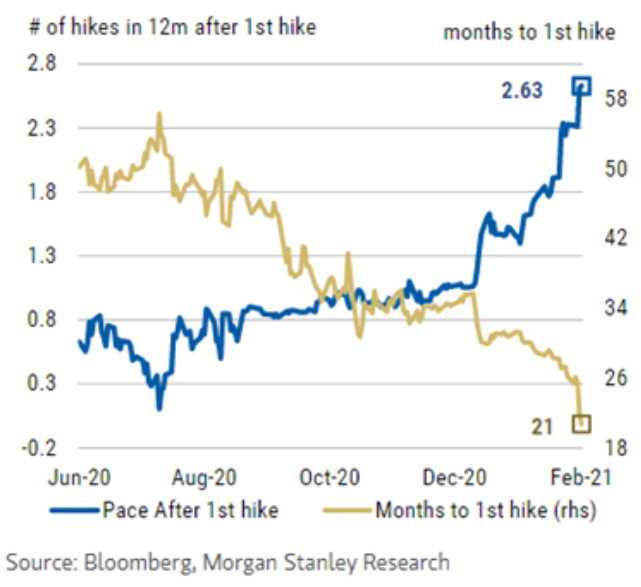
Figure 8
To explain, the gold line above tracks investors’ belief in how long it will be until the FED raises interest rates. Likewise, the blue line tracks investors’ belief in how quickly subsequent rate hikes will follow the initial rate hike. If you follow the gold line, you can see that at the end of December, investors expected roughly 36 months (three years) of bliss before the first rate hike (and only one rate hike occurring thereafter).
Conversely, investors’ now fear that an initial rate hike may occur within 21 months (less than two years), with another 2.63 rate hikes occurring within the following 12 months.
And with confidence suddenly teetering on the edge, according to Bloomberg Economics, fear of a monetary policy shock is driving the bond market’s recent sell-off.
Please see below:
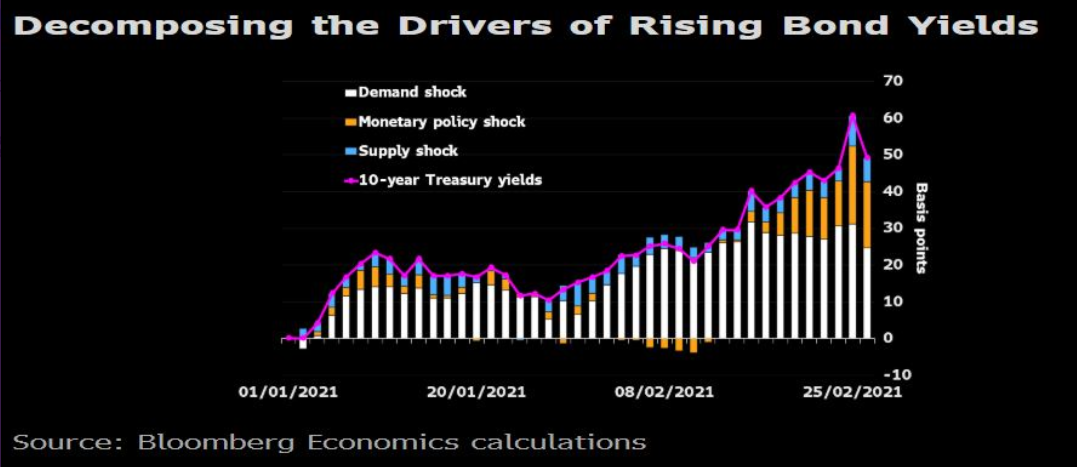
Figure 9
To explain, the purple line above tracks the U.S. 10-Year Treasury yield, while the vertical bars quantify the effect of three different variables – a demand shock, a monetary policy shock and a supply shock. If you analyze the right side of the chart, you can see that the orange bar (a monetary policy shock) continues to exert greater influence over the U.S. 10-Year Treasury yield’s movement. As a result, Powell’s cobra flute isn’t hypnotizing investors like it once did.
Amid the chaos, Cathie Wood’s Ark Innovation ETF – home to speculative technology stocks like Tesla, Square and Roku – ended Wednesday (Mar. 3) in bear market territory.
Please see below:
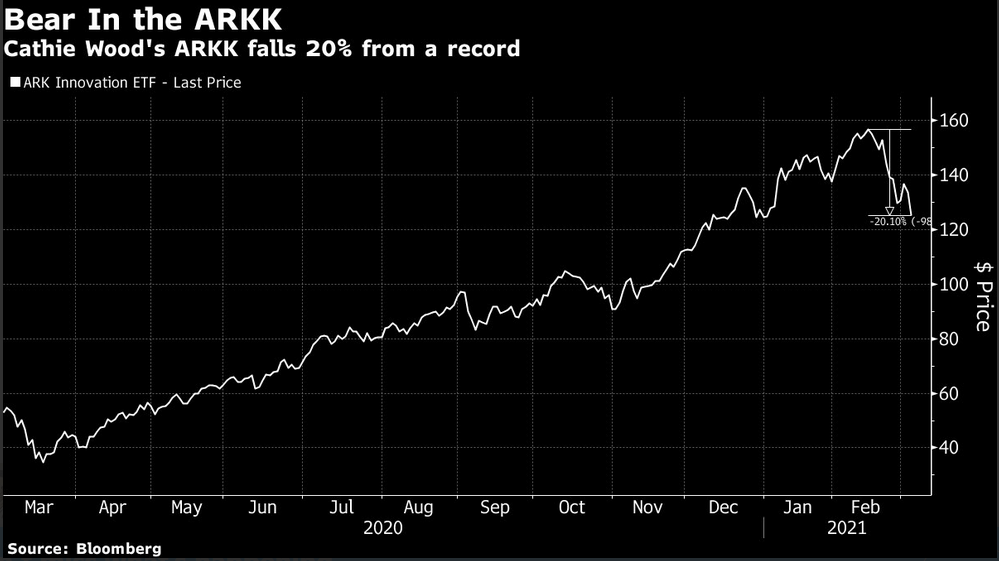
Figure 10
Also suffering from the yield surge, gold has become completely dejected.
On Feb. 17, I warned that gold topped (on Aug. 7), exactly one day after the U.S. 10-Year Treasury yield bottomed (Aug. 6). As a result, the yield curve story remains one of the most compelling narratives contributing to gold’s plight.
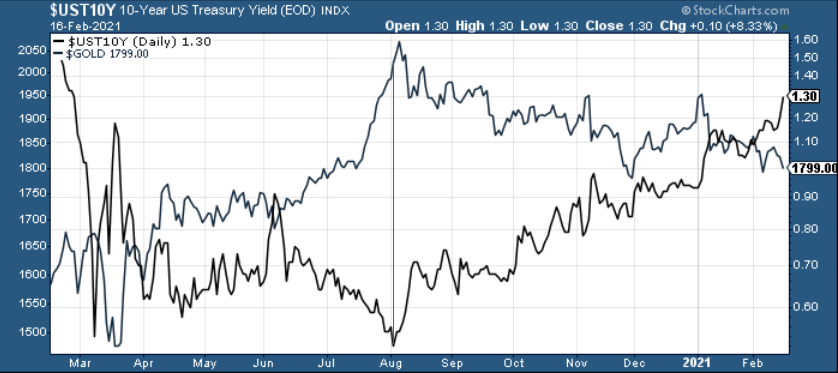
Figure 11
And two weeks later, the script remains the same.
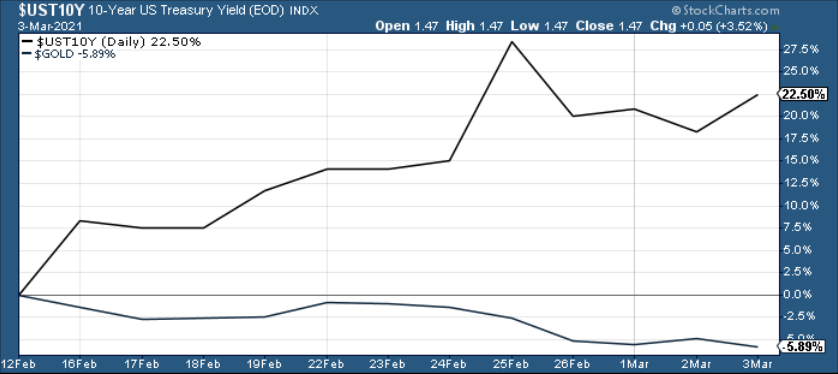
Figure 12
As further evidence, investors are dumping gold-backed ETFs at their fastest pace since 2016.
Please see below:
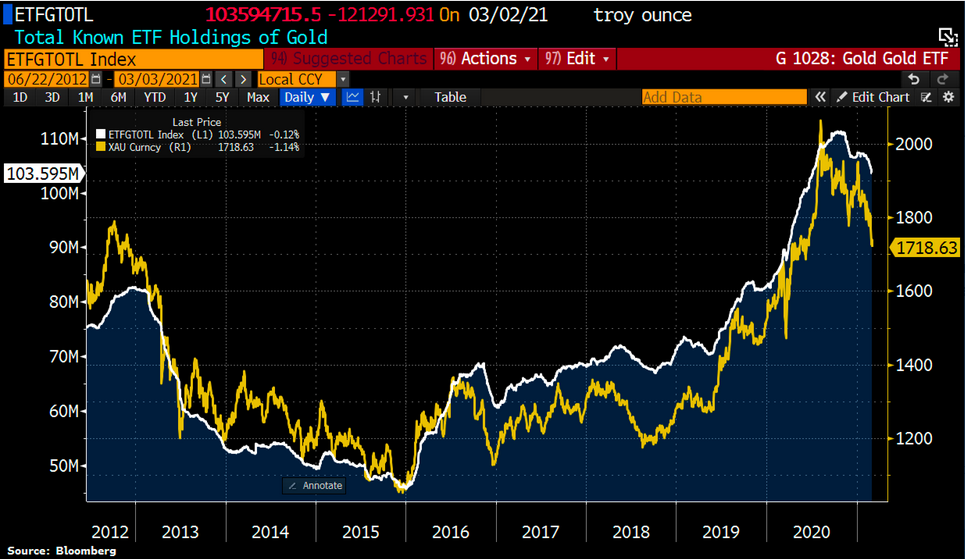
Figure 13
To explain, the yellow line above tracks the performance of spot gold (XAU), while the white line tracks worldwide holdings of gold-backed ETFs. Suffering 12-straight days of outflows, the current swoon marks gold-backed ETFs’ longest losing streak in roughly five years.
But with the behavior of U.S. Treasury yields, U.S. equities and the PMs signaling that a regime change is underway, has the bubble finally burst or is this just another ‘buy the dip’ opportunity?
Well, on one side of the coin, 50% of respondents aged 25-34 told Deutsche Bank that their forthcoming stimulus checks are heading straight into the stock market.
Please see below:
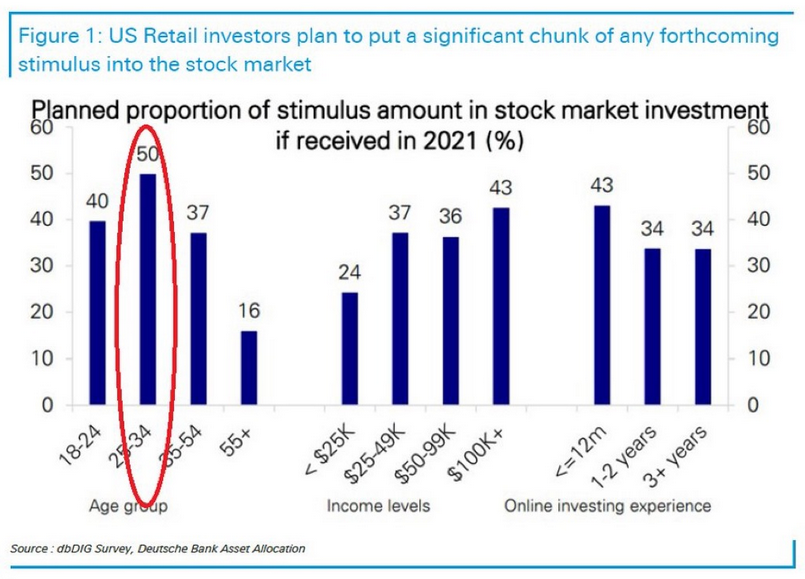
Figure 14
On the other side of the coin, Bank of America’s Equity & Quant Strategy team believe that we’re approaching a precipice. As of Feb. 28, the group’s Sell Side Indicator is flashing a warning signal.
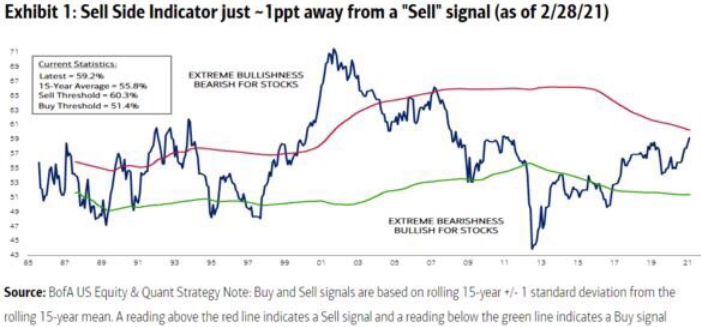
Figure 15
To explain, the blue line above tracks the historical readings from BofA’s Sell Side Indicator. And plotting 1 standard deviation above and below the indicator’s 15-year average, the green and purple lines signal when to buy and sell equities. As it stands, the indicator (59.2%) is only 1.1% away from a screaming sell signal (determined by reaching the 60.3% threshold). More importantly though, the last time the indicator was this close to 60.3% was November 2007 – roughly one month after the S&P 500 began its nearly 58% plunge during the Global Financial Crisis (GFC).
Conversely, while a righteous drawdown would serve as vindication for those that study history and perform diligent fundamental and technical analysis, could Superman – I mean Powell – save the day once again?
Enter Operation Twist 3.0.
With Powell speaking at the Wall Street Journal’s Jobs Summit on Mar. 4, whispers of an old strategy are becoming louder. Dubbed Operation Twist 3.0, the strategy (a version of yield curve control) requires the FED to buy long-term Treasuries and sell short-term Treasuries in order to flatten the yield curve (reduce the spread between short-term and long-term interest rates). And with the first ‘Twist’ occurring in 1961 and the second occurring in 2011 – following the GFC – Fed Governor Lael Brainard hinted on Mar. 2 that 3.0 could be next.
“I am paying close attention to market developments,” she said. “Some of those moves last week and the speed of the moves caught my eye. I would be concerned if I saw disorderly conditions or persistent tightening in financial conditions that could slow progress towards our goals.”
But analogous to putting out a fire by pouring on more gasoline, FED officials remain clueless to the indirect effect of their policies. Despite the implementation likely to suppress bond yields, buoy equities and breathe new life into the PMs, the sugar high will inevitably wear off.
I wrote previously:
The FED remains stuck between a rock and a hard place:
- If they let yields rise, the cost of borrowing rises, the cost of equity rises, and the U.S. dollar is supported (all leading to shifts in the bond and stock markets and destroying the halcyon environment they worked so hard to create).
- To stop yields from rising, the U.S. Federal Reserve (FED) has to increase its asset purchases (and buy more bonds in the open market). However, the added liquidity should have the same net-effect because it increases inflation expectations (which is a precursor to higher interest rates).
And with Powell’s deny-and-suppress strategy seemingly evolving into acknowledge-and-deflect, Operation Twist 3.0 will only provide a short-term reprieve. Conversely, over the medium-term, it’s the same story: you can only stretch a rubber band so far before it snaps.
In conclusion, the medium-term outlook for the PMs remains profoundly bearish. However, if gold can find a bottom at roughly $1,675, it will likely trigger a short-term corrective upswing. Moreover, if Powell can convince the bond market to settle down, equities should rally, and the PMs could participate in the upward momentum (given their moderate-to-strong correlations with the S&P 500). Conversely, the positivity is likely to be short-lived, as the PMs and U.S. equities are likely to suffer significant drawdowns over the medium-term.
Overview of the Upcoming Part of the Decline
- I expect the initial bottom to form with gold falling to roughly $1,670 - $1,700, likely this week.
- I expect the rebound to take place during the next 1-3 weeks.
- After the rebound (perhaps to $33 - $34 in the GDX), I plan to get back in with the short position in the mining stocks.
- Then, after miners slide once again in a meaningful and volatile way, but silver doesn’t (and it just declines moderately), I plan to switch from short positions in miners to short positions in silver (this could take another 1-4 weeks to materialize). I plan to exit those short positions when gold shows substantial strength relative to the USD Index, while the latter is still rallying. This might take place with gold close to $1,450 - $1,500 and the entire decline (from above $1,700 to about $1,475) would be likely to take place within 1-10 weeks and I would expect silver to fall hardest in the final part of the move. This moment (when gold performs very strongly against the rallying USD and miners are strong relative to gold – after gold has already declined substantially) is likely to be the best entry point for long-term investments in my view. This might happen with gold close to $1,475, but it’s too early to say with certainty at this time.
- Consequently, the entire decline could take between 3 and 17 weeks.
- If gold declines even below $1,500 (say, to ~$1350 or so), then it could take another 10 weeks or so for it to bottom, but this is not what I view as a very likely outcome.
- As a confirmation for the above, I will use the (upcoming or perhaps we have already seen it?) top in the general stock market as the starting point for the three-month countdown. The reason is that after the 1929 top, gold miners declined for about three months after the general stock market started to slide. We also saw some confirmations of this theory based on the analogy to 2008. All in all, the precious metals sector would be likely to bottom about three months after the general stock market tops .
- The above is based on the information available today and it might change in the following days/weeks.
Letters to the Editor
Q: Your outlook on the PMs has been very consistent and correct. With PMs declining (especially gold), how does one explain the consistent and contrary premiums and high prices for physical metals? Why aren’t physical metals declining at least some?
A: Thank you very much, and I’m glad that you enjoy the analyses. To answer your question, what we’re seeing regarding the physical premiums right now is relatively normal. When precious metals were declining in 2013, we saw the same thing – the physical market was reluctant to decline first, as investors seem to have believed that the price declines are very temporary.
But, as time passed, the physical premium declined and moved back to its regular levels. Some considered the temporarily high physical premium as a proof of market manipulation or that prices have to soar immediately. However, gold continued to decline for years after that time. While I don’t expect gold to decline for years now, I would like to stress that higher physical premia are not – by themselves – a reason to think that gold is going to soar soon.
So, to summarize my reply, the physical market likely has a delayed reaction to declining prices based on i.a., an investor’s expectations regarding the market. The fact that the silver manipulation story became much more popular recently and the physical market got a lot of attention likely contributes to this situation as well.
When PMs decline more from here – with gold moving to $1,500 or so – I expect the physical bullion prices to move substantially lower as well. The premia might not get very low during this decline, but it will almost certainly not be the case that it is only the futures prices that decline while physical prices stay intact.
Summary
To summarize, the PMs’ decline is already underway, as miners broke below the neck level of their almost-yearly head-and-shoulders formation and then continued the decline.
In addition, because we’re likely entering the “winter” part of the Kondratiev cycle (just like in 1929 and then the 1930s), the outlook for the precious metals’ sector remains particularly bearish during the very first part of the cycle, when cash is king.
The confirmed breakout in the USD Index is yet another confirmation of the bearish outlook for the precious metals market.
After the sell-off (that takes gold to about $1,450 - $1,500), we expect the precious metals to rally significantly. The final part of the decline might take as little as 1-5 weeks, so it's important to stay alert to any changes.
Most importantly, please stay healthy and safe. We made a lot of money last March and it seems that we’re about to make much more on this March decline, but you have to be healthy to enjoy the results.
Please take a look at the “trading capital” specifications below as there are quite a few changes in it. The prices are up-to-date, which means that I restored the original target for the GDXJ (after adjusting it temporarily on Friday, February 26) based on the likelihood of seeing another move lower in gold. I also updated the target for the JDST, and I updated the gold price based on which I plan to enter quick long positions.
As always, we'll keep you - our subscribers - informed.
To summarize:
Trading capital (supplementary part of the portfolio; our opinion): Full speculative short positions (300% of the full position) in mining stocks are justified from the risk to reward point of view with the following binding exit profit-take price levels:
Senior mining stocks (price levels for the GDX ETF): none
Junior mining stocks (price levels for the GDXJ ETF): binding profit-take exit price: $42.72; stop-loss: none (the volatility is too big to justify a SL order in case of this particular trade); binding profit-take level for the JDST ETF: $13.79; stop-loss for the JDST ETF: none (the volatility is too big to justify a SL order in case of this particular trade)
For-your-information targets (our opinion; we continue to think that mining stocks are the preferred way of taking advantage of the upcoming price move, but if for whatever reason one wants / has to use silver or gold for this trade, we are providing the details anyway. In our view, silver has greater potential than gold does):
Silver futures downside profit-take exit price: unclear at this time - initially, it might be a good idea to exit, when gold moves to $1,693.
Gold futures downside profit-take exit price: $1,693.
=====
Moreover, even if none of the above-mentioned targets are reached, but gold moves to $1,693, I think that closing any remaining positions would be justified from the risk to reward point of view, anyway.
Additionally, if gold moves to $1,692, I think that LONG trading positions in GDX will be justified from the risk to reward point of view with $32.39 as the next target.
Alternatively to GDX – if one seeks to gain leverage, one might consider going long (when gold moves to $1,703) NUGT (2x leverage) or GDXU (3x leverage – not recommended for most due to the significant leverage, but might be interesting tool for more advanced traders).
The size of position for this very quick long position would be regular.
We are not using GDXJ here for the sake of simplicity in case of this quick trade and because GDXJ didn’t reach support that’s as strong as the one that the GDX ETF just reached.
======
Long-term capital (core part of the portfolio; our opinion): No positions (in other words: cash
Insurance capital (core part of the portfolio; our opinion): Full position
Whether you already subscribed or not, we encourage you to find out how to make the most of our alerts and read our replies to the most common alert-and-gold-trading-related-questions.
Please note that we describe the situation for the day that the alert is posted in the trading section. In other words, if we are writing about a speculative position, it means that it is up-to-date on the day it was posted. We are also featuring the initial target prices to decide whether keeping a position on a given day is in tune with your approach (some moves are too small for medium-term traders, and some might appear too big for day-traders).
Additionally, you might want to read why our stop-loss orders are usually relatively far from the current price.
Please note that a full position doesn't mean using all of the capital for a given trade. You will find details on our thoughts on gold portfolio structuring in the Key Insights section on our website.
As a reminder - "initial target price" means exactly that - an "initial" one. It's not a price level at which we suggest closing positions. If this becomes the case (like it did in the previous trade), we will refer to these levels as levels of exit orders (exactly as we've done previously). Stop-loss levels, however, are naturally not "initial", but something that, in our opinion, might be entered as an order.
Since it is impossible to synchronize target prices and stop-loss levels for all the ETFs and ETNs with the main markets that we provide these levels for (gold, silver and mining stocks - the GDX ETF), the stop-loss levels and target prices for other ETNs and ETF (among other: UGL, GLL, AGQ, ZSL, NUGT, DUST, JNUG, JDST) are provided as supplementary, and not as "final". This means that if a stop-loss or a target level is reached for any of the "additional instruments" (GLL for instance), but not for the "main instrument" (gold in this case), we will view positions in both gold and GLL as still open and the stop-loss for GLL would have to be moved lower. On the other hand, if gold moves to a stop-loss level but GLL doesn't, then we will view both positions (in gold and GLL) as closed. In other words, since it's not possible to be 100% certain that each related instrument moves to a given level when the underlying instrument does, we can't provide levels that would be binding. The levels that we do provide are our best estimate of the levels that will correspond to the levels in the underlying assets, but it will be the underlying assets that one will need to focus on regarding the signs pointing to closing a given position or keeping it open. We might adjust the levels in the "additional instruments" without adjusting the levels in the "main instruments", which will simply mean that we have improved our estimation of these levels, not that we changed our outlook on the markets. We are already working on a tool that would update these levels daily for the most popular ETFs, ETNs and individual mining stocks.
Our preferred ways to invest in and to trade gold along with the reasoning can be found in the how to buy gold section. Furthermore, our preferred ETFs and ETNs can be found in our Gold & Silver ETF Ranking.
As a reminder, Gold & Silver Trading Alerts are posted before or on each trading day (we usually post them before the opening bell, but we don't promise doing that each day). If there's anything urgent, we will send you an additional small alert before posting the main one.
Thank you.
Przemyslaw Radomski, CFA
Founder, Editor-in-chief

