

Briefly: in our opinion, full (300% of the regular position size) speculative short positions in mining stocks are justified from the risk/reward point of view at the moment of publishing this Alert.
In yesterday’s flagship Gold & Silver Trading Alert, I covered multiple factors and analyzed the precious metals sector from many angles. Today, I’ll zoom in and focus on the more short-term details. I’ll also reply to the many questions that I have just received, and would like to thank you for them.
Let’s start with what gold has been doing in the last several hours.
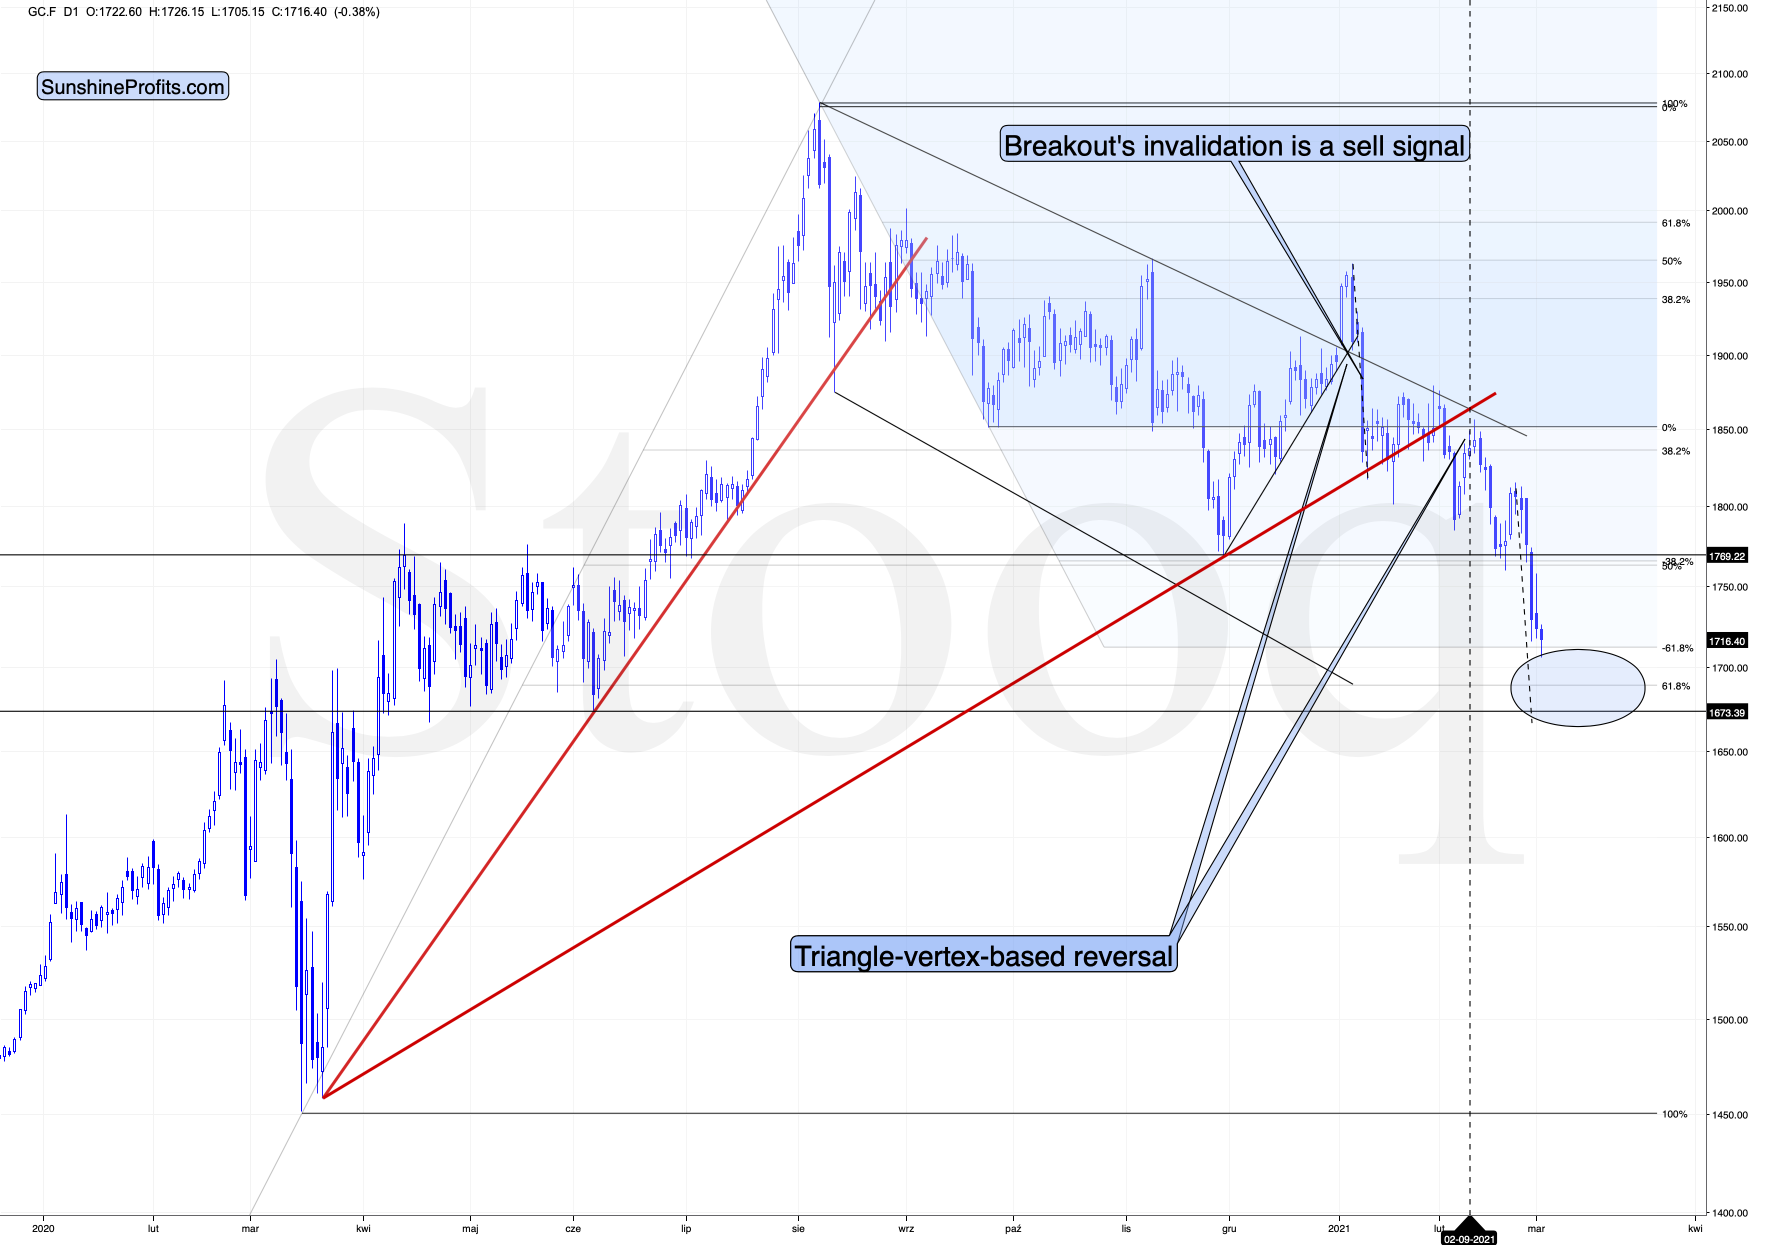
Figure 1 – COMEX Gold Futures (GC.F)
In short, it’s been declining, but not as fast as it did on Friday (Feb. 26). And that’s quite normal – the volatility doesn’t have to stay very high at all times. Is the bottom in? Most likely it’s not, because gold still hasn’t moved to its strong support levels. In other words, my comments from yesterday concerning the short-term gold price movement remain up-to-date:
Furthermore, if you analyze the symmetry of previous declines (the similar shape of their candles), the magnitude of the August, November and January drawdowns imply a base-case retracement back to the $1,670 to $1,680 range.
The size of the first part of the move sometimes tends to be identical or near-identical to the size of the final move. The size of the initial, August decline was almost just like the November decline. Now, copying the January 2021 decline to the current situation (blue, dashed lines), provides us with the target at about $1,675.
All in all, gold is likely to suffer another ~$50 decline before finding a short-term bottom. More importantly though, if the initial move lower coincides with an S&P 500 correction, it would present an attractive opportunity to exit short positions in the GDXJ ETFs, while positioning oneself for a potential short-term upswing.
Before moving to mining stocks, let’s take a look at silver.
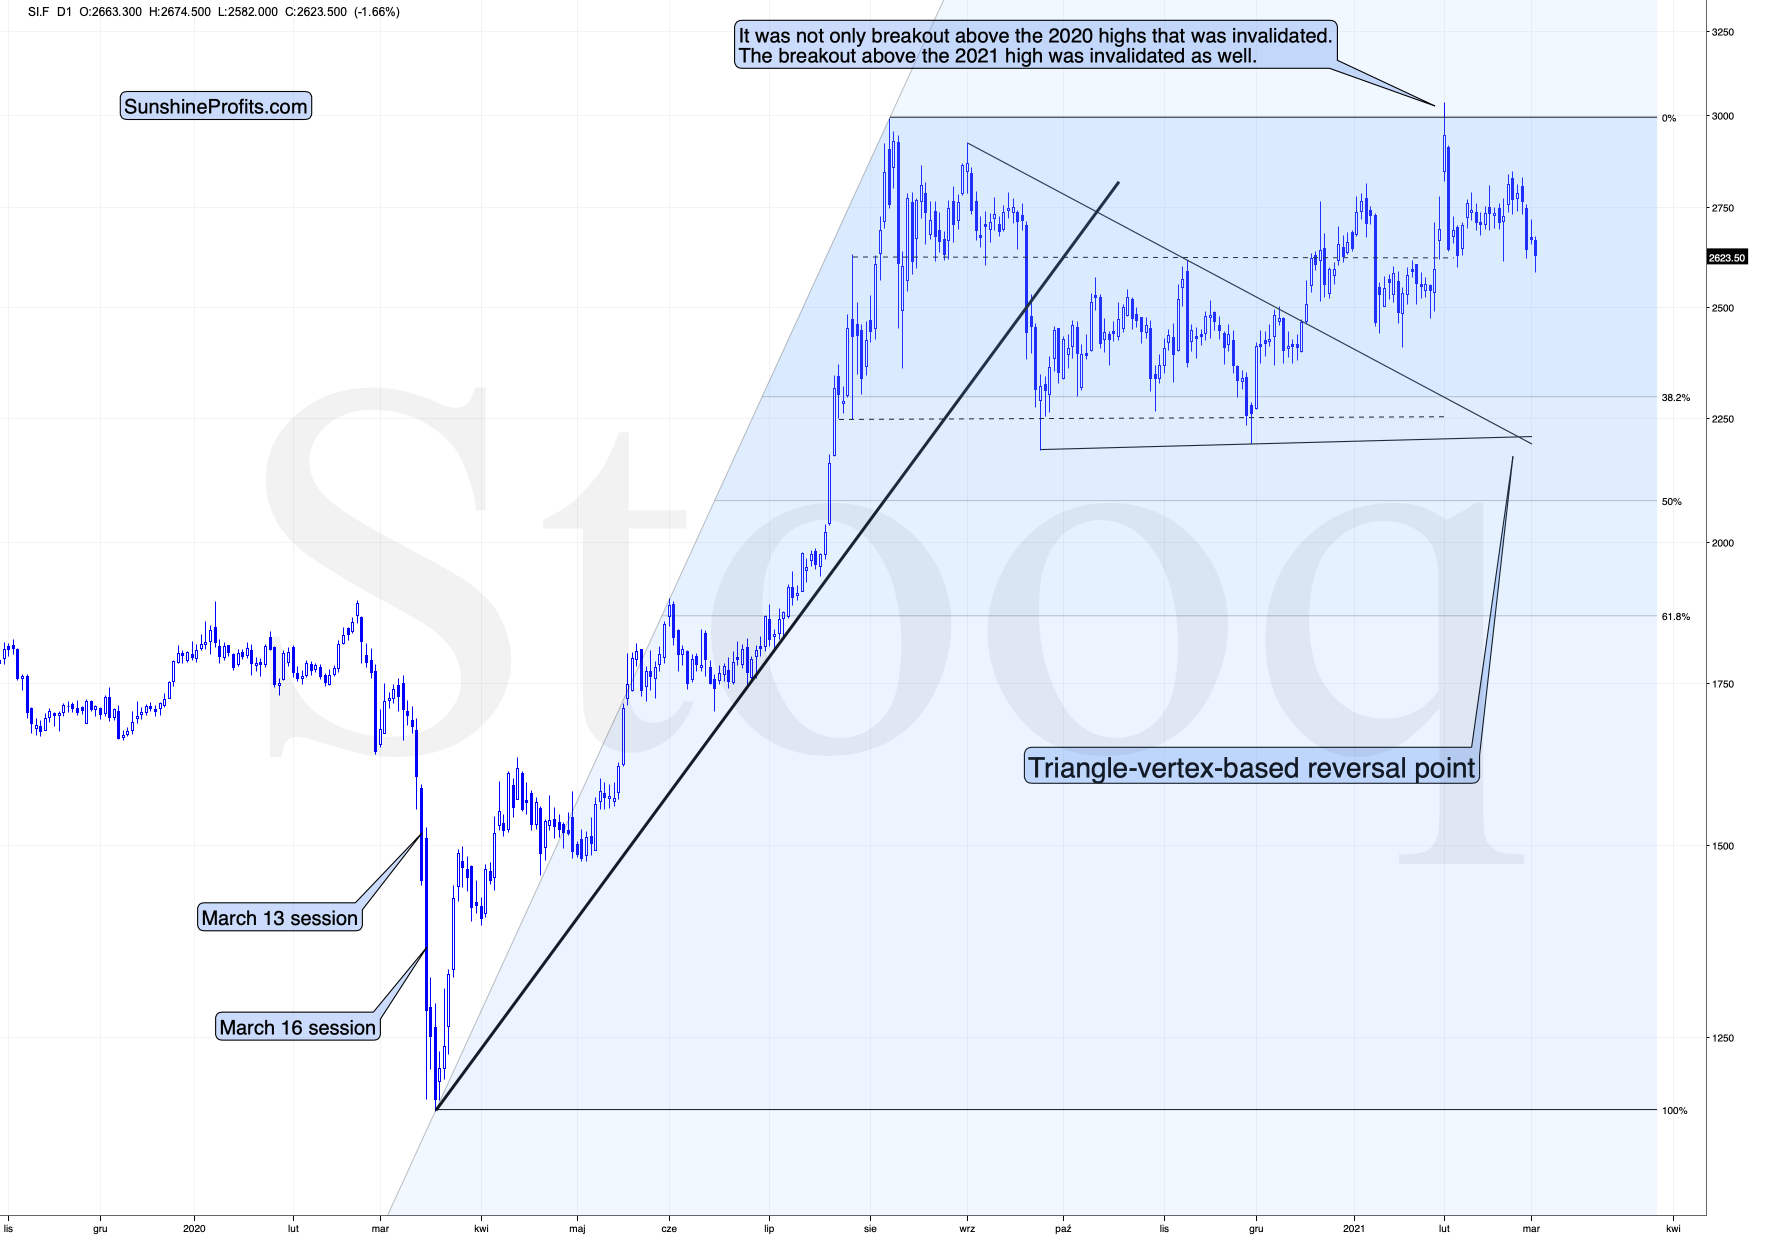
Figure 2 – COMEX Silver Futures
Well, silver has not been moving much recently. The back-and-forth movement resulted in the silver price being more or less where it was trading at its July 2020 high, and relatively close to the middle of the trading range between the August 2020 top and the September 2020 low.
I previously wrote that silver is likely to catch up with the decline at its later stage, while miners are likely to lead the way. That’s exactly what we’ve been seeing in the last few months. Silver is still likely to catch up with the declines when silver investors panic – just as they tend to do close to the end of given price moves (selling close to the bottom and buying close to the top). So far, miners remain the asset of choice for trading, but sometime during the next downswing, we might move to silver in order to magnify gains from both declines. As a reminder, please consider what happened on March 13 and March 16, 2020 and consider that the GDX ETF bottomed (in terms of the daily closing prices) on March 13. That was when silver was only in the middle of its decline.
Speaking of mining stocks, let’s take a look at the GDX ETF chart.
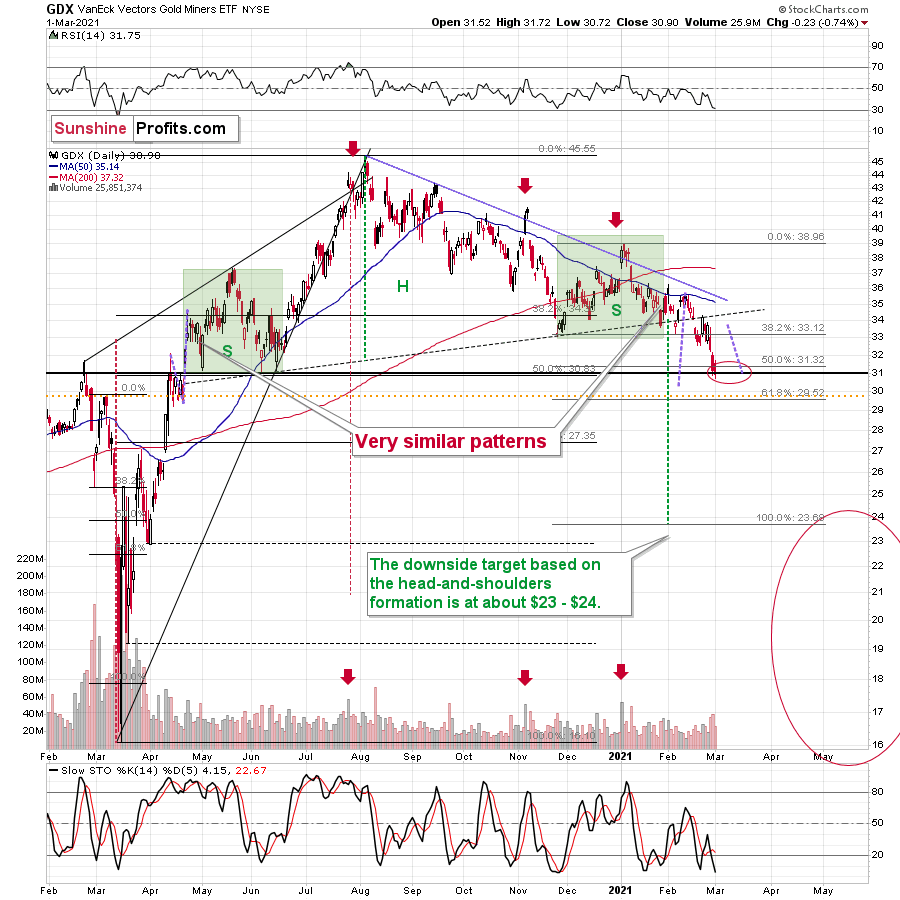
Figure 3 - VanEck Vectors Gold Miners ETF (GDX)
In short, the GDX seems to be forming a bottom in my previous target area. Now, if gold declines one more time before correcting, the GDX could dip temporarily once again – perhaps slightly below $30. In other words, my comments from yesterday on the above chart remain up-to-date:
Remember though, if gold does bounce off of the $1,670 to $1,700 range, and the miners are able to ride the momentum higher, ~$33 to ~$34 is where the rally likely ends. From there, the bearish medium-term trend will likely continue, with the miners declining to my secondary target range of $23 to $24.
From a medium-term perspective, the potential head and shoulders pattern – highlighted by the shaded green boxes above – also deserves plenty of attention.
For context, I wrote previously:
Ever since the mid-September breakdown below the 50-day moving average, the GDX ETF was unable to trigger a substantial and lasting move above this MA. The times when the GDX was able to move above it were also the times when the biggest short-term declines started.
(…)
The most recent move higher only made the similarity of this shoulder portion of the bearish head-and-shoulders pattern to the left shoulder (figure 3 - both marked with green) bigger. This means that when the GDX breaks below the neck level of the pattern in a decisive way, the implications are likely to be extremely bearish for the next several weeks or months.
Due to the uncanny similarity between the two green rectangles, I decided to check what happens if this mirror-similarity continues. I used purple, dashed lines for that. There were two important short-term price swings in April 2020 – one shows the size of the correction and one is a near-vertical move higher.
Copying these price moves (purple lines) to the current situation, we get a scenario in which GDX (mining stocks) moves to about $31 and then comes back up to about $34. This would be in perfect tune with what I wrote previously. After breaking below the head-and-shoulders pattern, gold miners would then be likely to verify this breakdown by moving back up to the neck level of the pattern. Then, we would likely see another powerful slide – perhaps to at least $24.
This is especially the case, since silver and mining stocks tend to decline particularly strongly if the stock market is declining as well. And while the exact timing of the market’s slide is not 100% clear, stocks’ day of reckoning is coming. And it might be very, very close.
As I explained previously, based on the similarities to the 1929 and 2008 declines, it could be the case that the precious metals sector declines for about 3 months after the general stock market tops. And it seems that we won’t have to wait long for the latter. Perhaps the next big move lower in stocks is already underway.
Let’s consider the GDXJ ETF, as that’s the ETF where you might have a short position at this time.
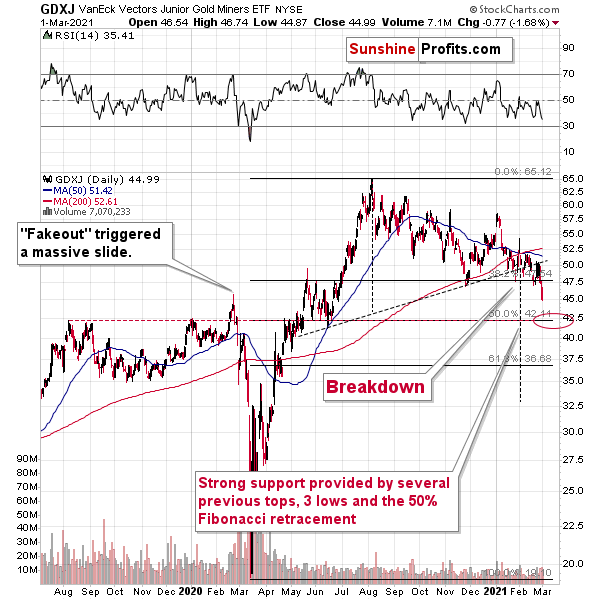
Figure 4 - VanEck Vectors Junior Gold Miners ETF (GDXJ)
There is strong support at about $42.5 in the GDXJ ETF, so I expect to see a corrective upswing once the price gets there. The move could be similar in nature to what we saw at the beginning of last March. The rally took just several days, and it was then erased just as quickly. Looking at the above chart from the 4-hour point of view provides us with two more confirmations of this target on an approximate basis.
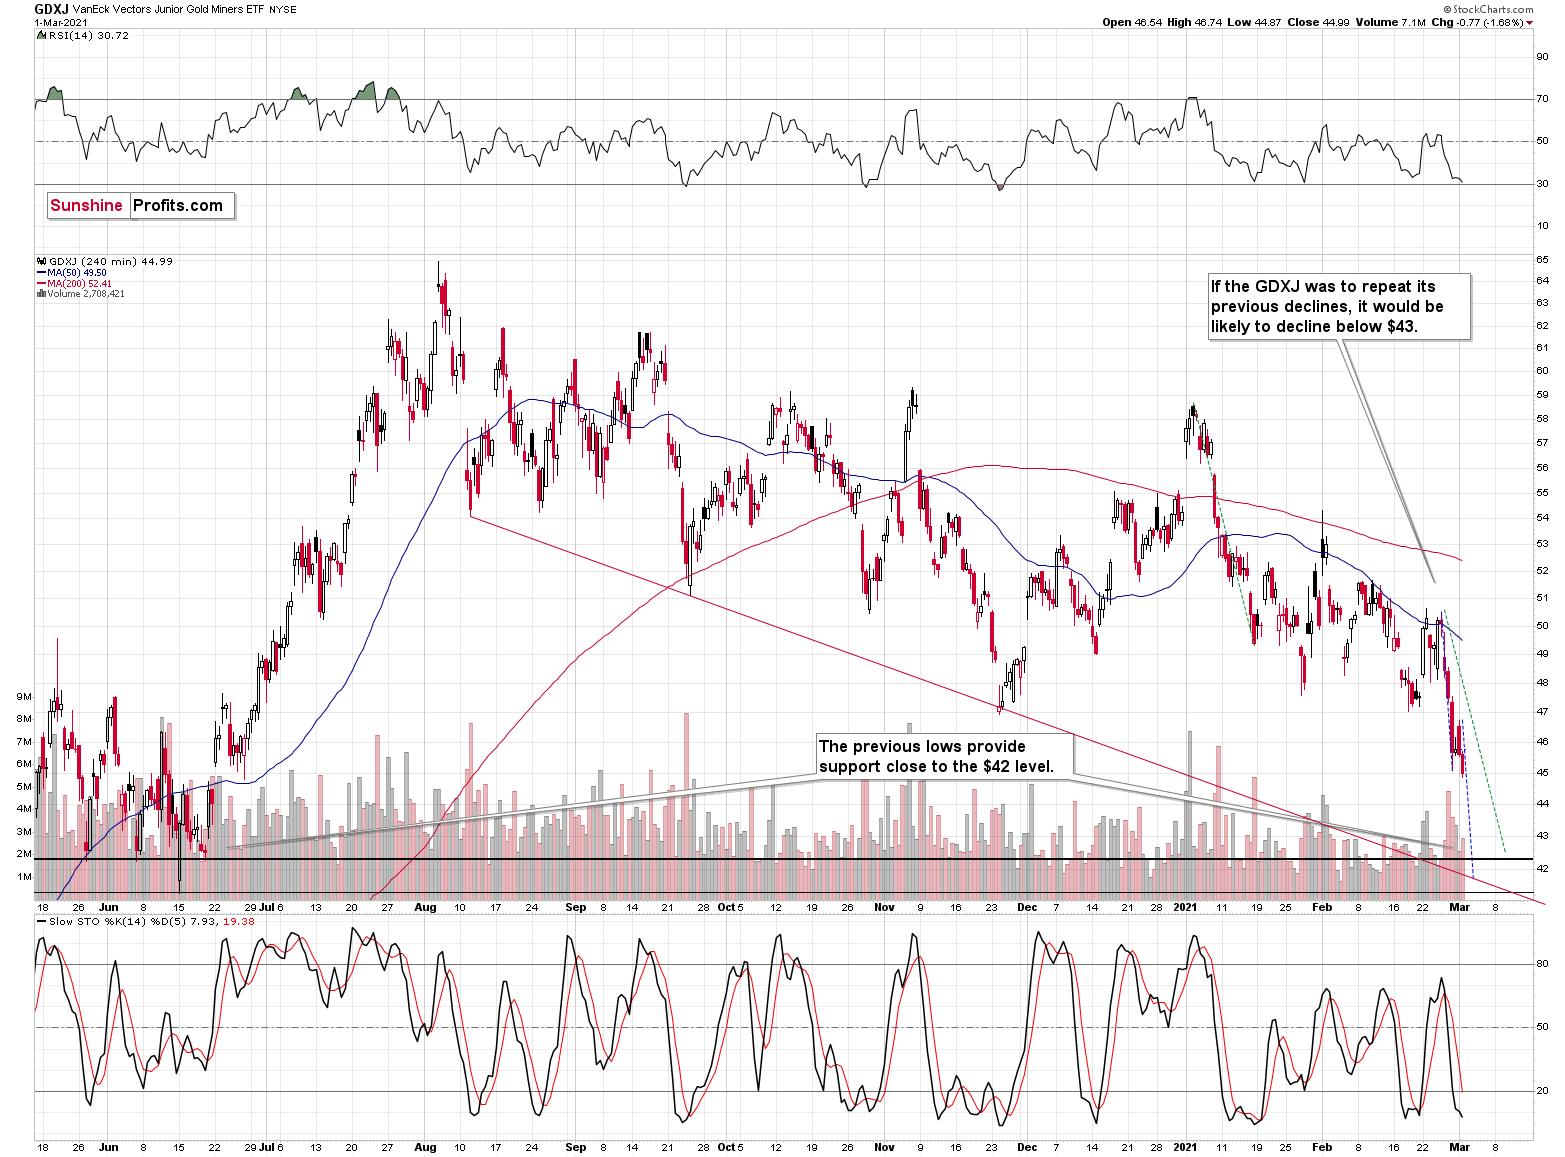
Figure 5
These two factors are analogies to the sizes of previous declines. Copying the initial 2021 decline to the current situation (marked with green) provides us with $42.5 as the next target, and copying the very recent decline and then pasting it over the most recent intraday high (marked with blue), provides us with a target slightly below $42.
The additional support at this area comes from the declining red support line that’s based on the previous intraday lows. Please note that this line has already triggered a sizable short-term reversal in late November, so it’s not something worth ignoring.
Moreover, please note that the RSI indicator (upper part of the above chart) is just above 30, and when this level is reached, it usually corresponds to a short-term buying opportunity. Back in November, the RSI moved visibly below this level before the bottom was formed. So, the RSI is yet another reason to expect a rebound, once prices decline one more time.
The direct trigger for the correction in the precious metals market might come from the same place that triggered it’s slide – the USD Index.
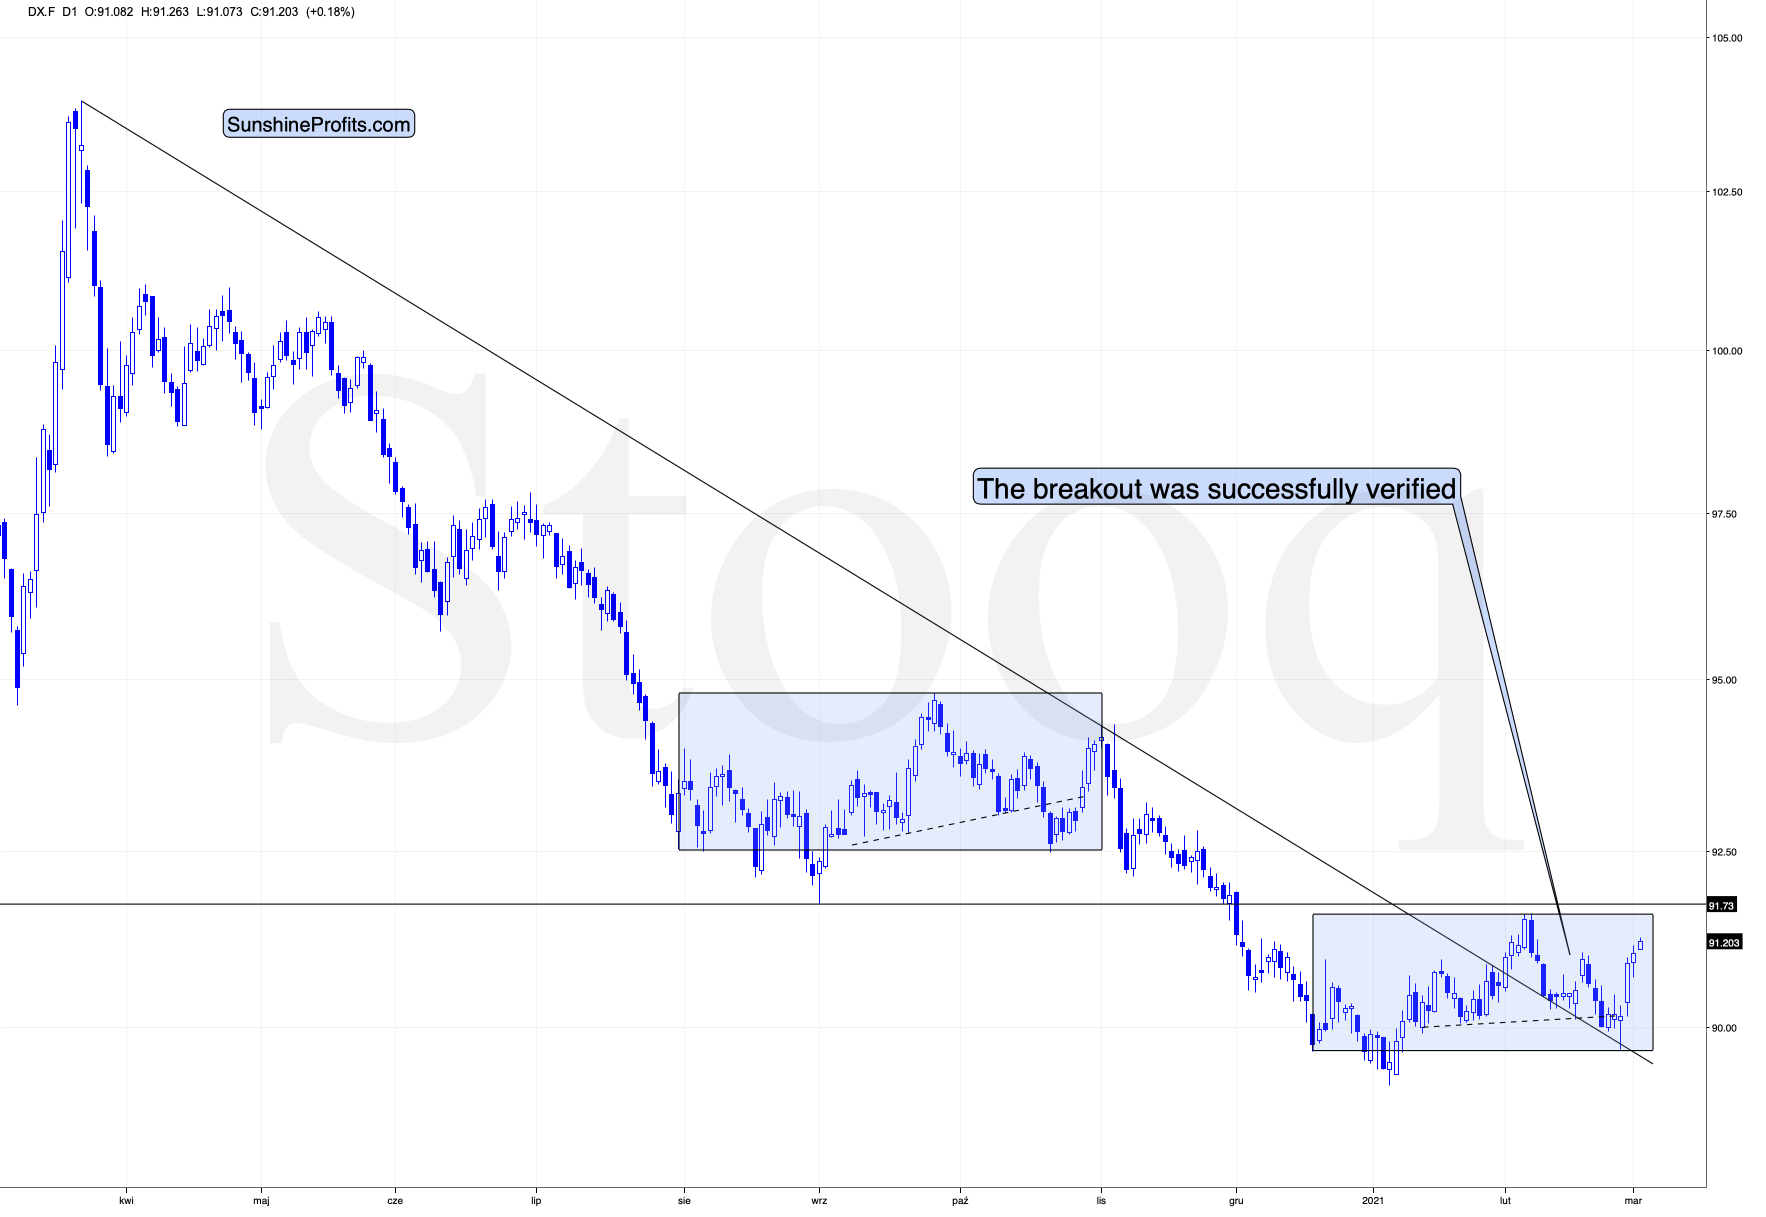
Figure 6
While the medium-term breakout continues to be the most important technical development visible on the above chart (with important bullish implications for the following months), there is one thing that could make the USD Index decline on a temporary basis.
This thing is the similarity to the mid-2020 price pattern. I previously commented on the head and shoulders pattern that had formed (necklines are marked with dashed lines), but that I didn’t trust. Indeed, this formation was invalidated, but a bigger pattern, of which this formation was part, wasn’t invalidated.
The patterns start with a broad bottom and an initial rally. Then it turns out that the initial rally is the head of a head-and-shoulders pattern that is then completed and invalidated. This is followed by a sharp rally. So far, the situations are similar.
Last year, this pattern was followed by a top below the previous high and then by a decline to new lows. Now, based on the breakout above the rising medium-term support line, such a bearish outcome doesn’t seem likely, but we might see the pattern continue for several more days, before they disconnect. After all, this time, the USD Index is likely to really rally – similarly to how it soared in 2018 – and not move to new lows.
What happens before the patterns disconnect? The USD Index could decline temporarily, and the top could be formed any day or hour now.
This means that the bottom in the PMs and miners could be formed any day or hour now – as well.
Still, markets tend to reverse only after reaching important support or resistance levels, which means that PMs are still likely to move lower before their short-term corrective upswing.
Having said that, let’s take a look at the markets from the more fundamental point of view.
The Calm Before the USD Index Storm
With the USD Index bouncing above 91 (intraday) on Mar. 1, the greenback is quietly building momentum. And with the 2017-2018 analogue signaling a surge back to ~94.5, what are the fundamental catalysts for a potential spike?
Well, for one, we may be nearing the end of the USD Index’s long short-story.
Please see below:
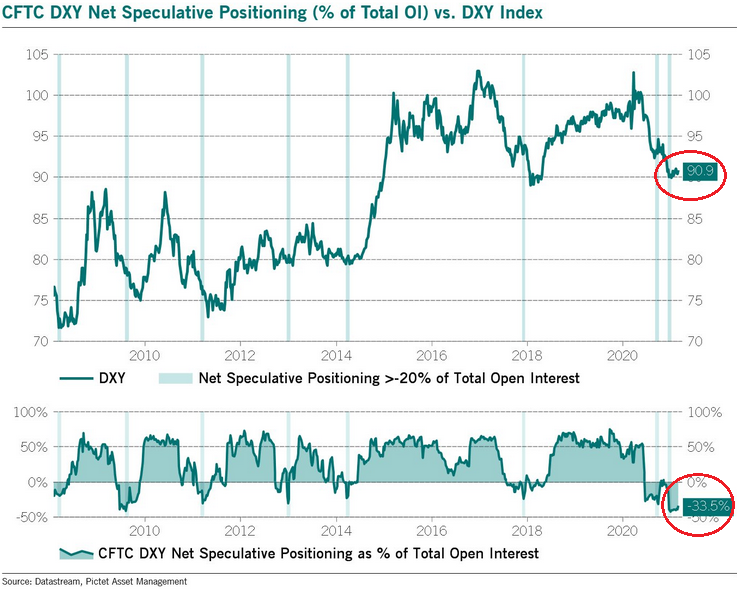
Figure 7
If you analyze the chart above, you can see that the USD Index short interest has begun to fall after reaching a more than 10-year high (the red circle at the bottom of the chart). Moreover, with the USD Index likely forming a bottom on Feb. 12, similar periods of excessive short interest imply that a ferocious short-covering rally could be on the horizon.
Also signaling an uprising, the correlation between U.S. Treasury yields and the Cboe Volatility Index (VIX) – which gauges the S&P 500’s expected volatility over the next 30 days – has moved above zero.
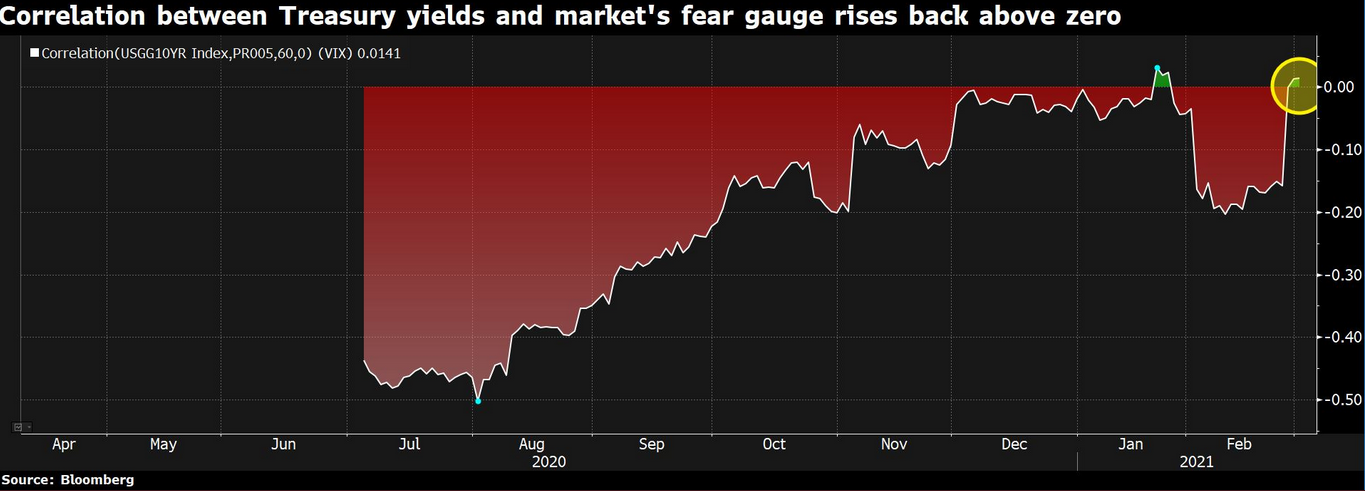
Figure 8
To explain, the shaded red area above (which has now turned green at the top-right) signals that rising U.S. Treasury yields are now coinciding with a rise in the VIX.
For context, I wrote previously:
The VIX is calculated by taking the average prices of call and put options. When the VIX rises, it means that dealers (the sellers of options) are charging higher prices. This occurs when dealers expect volatility to increase over the next 30 days (or relative to the options expiry date). Because higher volatility increases the likelihood that the underlying asset will rise above or below the options strike price, dealers demand higher compensation to provide their service.
More importantly though, while the USD Index has slept through the U.S. 10-Year Treasury yield’s recent surge, it has a tendency to track the VIX’s movement.
Please see below:
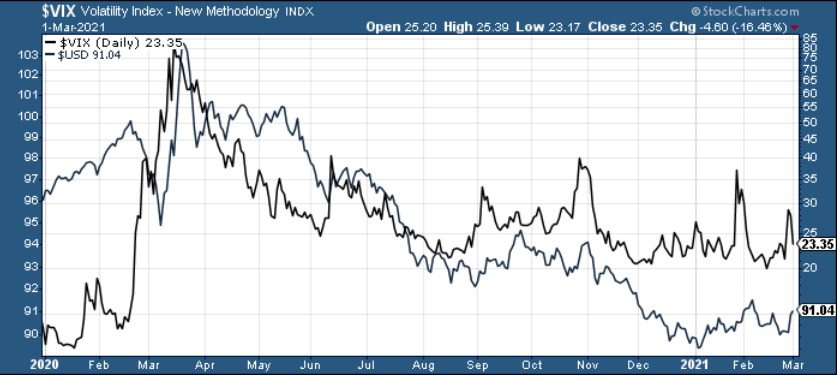
Figure 9
What’s more, VIX futures are already bracing for another bout of volatility. With the current contract trading at 23.31 on Mar. 1, the Jul. 21 expiration is pricing in a near 22% surge in the VIX (the red box below).
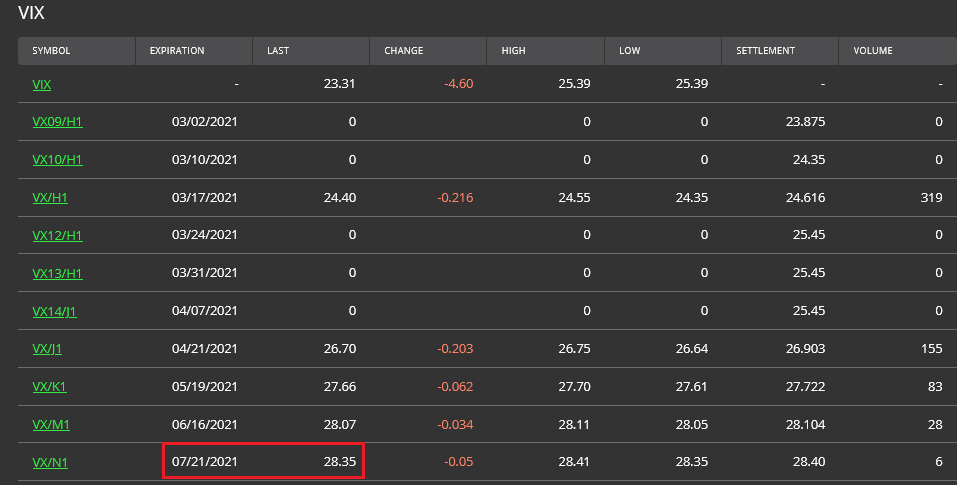
Figure 10 -
Adding fuel to the VIX’s fire, only four other times in history has net-short positioning exceeded – 41.5% of open interest (the red circle below).
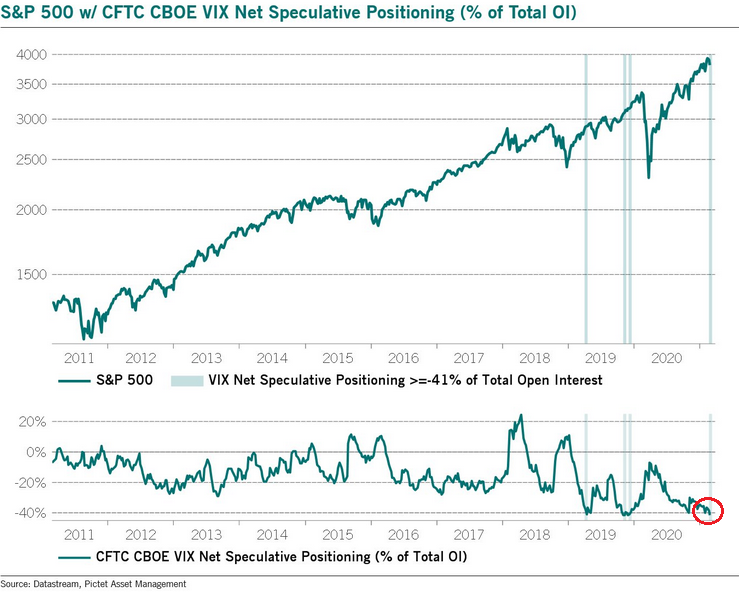
Figure 11
To explain, the green line at the bottom tracks short interest as a percentage of futures contracts outstanding, while the green line at the top tracks the performance of the S&P 500. If you analyze the gray horizontal bars, you can see that prior periods of excessive short interest coincided with subsequent spikes in the VIX and moderate-to-severe drawdowns of the S&P 500.
And because the S&P 500 and the USD Index have a strong negative correlation, a severe correction of equities could propel the USD Index back to 94.5 and possibly to (or even above) its March peak.
Please see below:
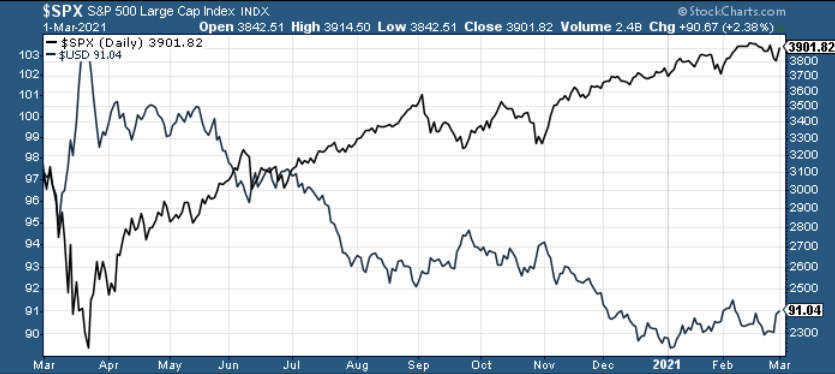
Figure 12
As further evidence, I warned that the GDX ETF was heading to $31 (closed at $30.90 on Mar. 1). And with the gold miners’ 1999 top actually preceding the 2000 NASDAQ bubble bursting, the miners’ swoon could be the equities’ canary in the coal mine.
Please see below:
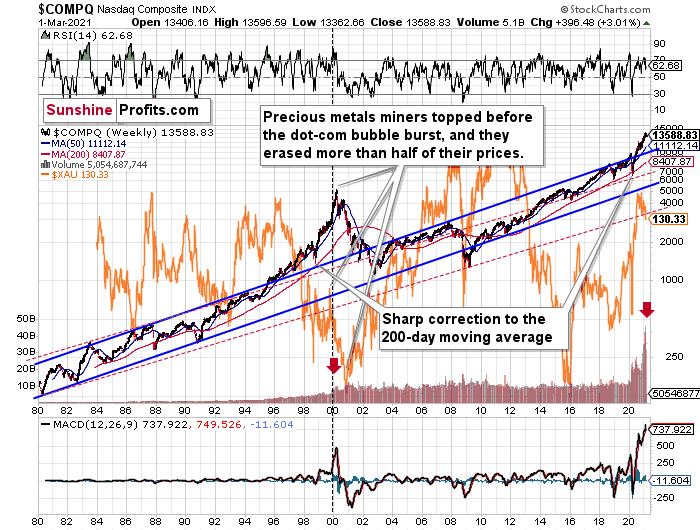
Figure 13
To explain, I wrote previously:
Two decades ago, tech stocks topped about 6 months after miners. This might spoil the party of the tech stock bulls, but miners topped about 6 months ago …. Interestingly, miners bottomed more or less when the NASDAQ declined to its previous lows, created by the very first slide. We have yet to see the “first slide” this time. But, if the history continues to repeat itself and tech stocks decline sharply and then correct some of the decline, when they finally move lower once again, we might see THE bottom in the mining stocks.
Supporting the prophecy, the NASDAQ 100/Russell 2000 ratio is doing something unseen since November 2000.
Please see below:
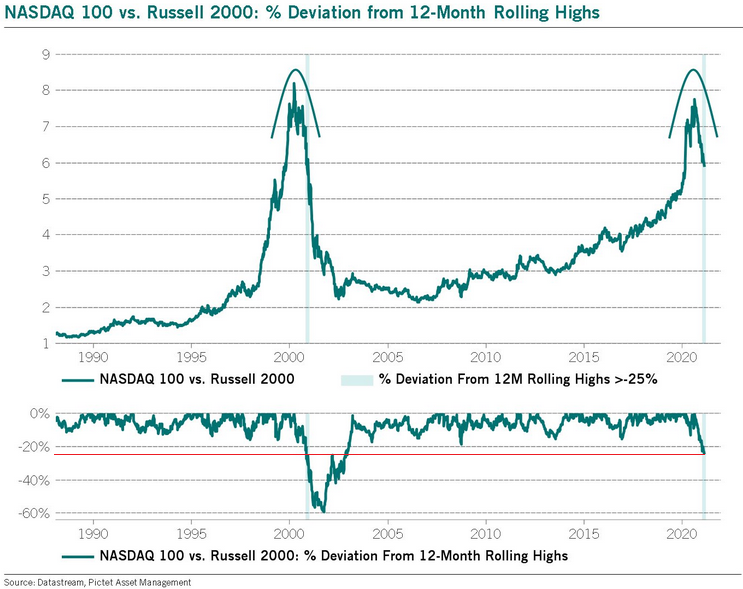
Figure 14
To explain, the green line at the bottom of the chart depicts the percentage change in the NASDAQ 100/Russell 2000 ratio. As you can see, at only one other time in history has the NASDAQ 100/Russell 2000 ratio declined by 25% or more after hitting a 12-month high.
For context, November 2000 was roughly 10 months before the NASDAQ Composite troughed (September 2001). And while timing is extremely difficult, the two charts above indicate that it’s a matter of when, not if, equities suffer a similar fate.
As another bearish development, the U.S. 10-Year real yield surged to an eight-month high on Feb. 26.
Please see below:
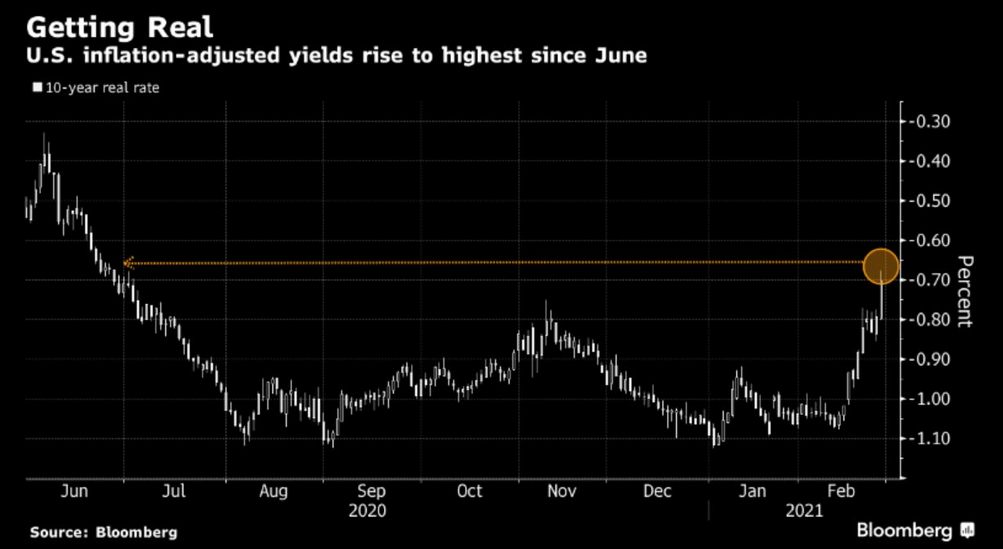
Figure 15
And while the impact has clearly been felt by the PMs, equities remain in denial. If you analyze the chart below, you can see that the S&P 500’s forward P/E has a strong negative correlation with real yields.
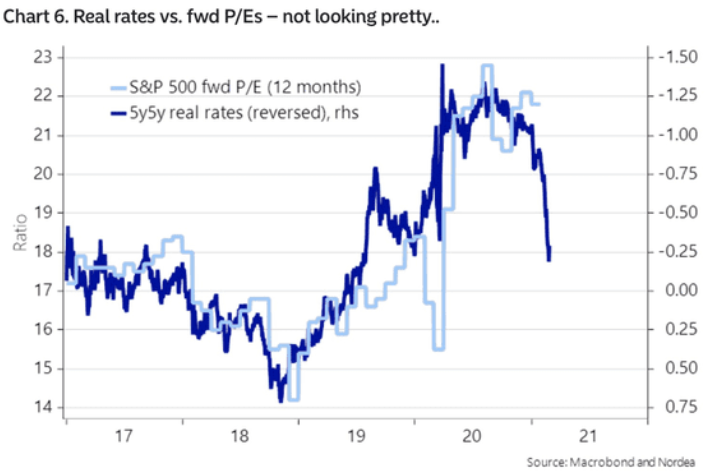
Figure 16
To explain, the light blue line above depicts the S&P 500’s forward P/E, while the dark blue line above depicts the 5-year breakeven inflation rate. As you can see, when the 5-year breakeven inflation rate is falling (meaning that real yields are rising), the S&P 500’s forward P/E tends to follow suit. The dynamic occurs because rising real yields (lifted by rising nominal yields) decreases equities’ attractiveness relative to bonds. As a result, dividend investors are more likely to buy bonds and sell equities, which in turn, decreases the multiples that equities can attain.
More importantly though, to eliminate the abnormal divergence and reconnect with the 5-year breakeven inflation rate, the S&P 500’s forward P/E has to decline by more than 18%. As a result, either analysts’ earnings estimates need to move meaningfully higher, or stock prices need to move meaningfully lower.
In conclusion, the USD Index has a pathway to 94.5 (and beyond) and it’s only a matter of time before its presence is felt. Because of this, the medium-term outlook for the precious metals remains profoundly bearish. Even with the U.S. 10-Year Treasury yield stabilizing on Mar. 1 and the USD Index trading roughly flat (up by 0.17%), the PMs remained under heavy pressure. And while a short-term rally is likely to ensue if gold forms an initial bottom in the $1,670 to $1,700 range, the medium-term impact of a USD index uprising won’t be kind to the PMs.
Overview of the Upcoming Part of the Decline
- I expect the initial bottom to form with gold falling to roughly $1,670 - $1,700, likely this week.
- I expect the rebound to take place during the next 1-3 weeks.
- After the rebound (perhaps to $33 - $34 in the GDX), I plan to get back in with the short position in the mining stocks.
- Then, after miners slide once again in a meaningful and volatile way, but silver doesn’t (and it just declines moderately), I plan to switch from short positions in miners to short positions in silver (this could take another 1-4 weeks to materialize). I plan to exit those short positions when gold shows substantial strength relative to the USD Index, while the latter is still rallying. This might take place with gold close to $1,450 - $1,500 and the entire decline (from above $1,700 to about $1,475) would be likely to take place within 1-10 weeks and I would expect silver to fall hardest in the final part of the move. This moment (when gold performs very strongly against the rallying USD and miners are strong relative to gold – after gold has already declined substantially) is likely to be the best entry point for long-term investments in my view. This might happen with gold close to $1,475, but it’s too early to say with certainty at this time.
- Consequently, the entire decline could take between 3 and 17 weeks.
- If gold declines even below $1,500 (say, to ~$1350 or so), then it could take another 10 weeks or so for it to bottom, but this is not what I view as a very likely outcome.
- As a confirmation for the above, I will use the (upcoming or perhaps we have already seen it?) top in the general stock market as the starting point for the three-month countdown. The reason is that after the 1929 top, gold miners declined for about three months after the general stock market started to slide. We also saw some confirmations of this theory based on the analogy to 2008. All in all, the precious metals sector would be likely to bottom about three months after the general stock market tops .
- The above is based on the information available today and it might change in the following days/weeks.
Letters to the Editor
Q: Let me say, I am new to your service and this position in the GDX was a very profitable trade. Thank you for all the information you give us each day. The price of the subscription is a small price to pay for what you provide.
This might seem like a beginner question, but where is the best place to find the current spot price for gold and silver. You stated here that $1,703 would be a good place to look at when opening a long position in gold for the pullback to about $33. However, the price shown on $GOLD (StockCharts) is quite different than what I see on my Kitco app. Granted, the Kitco app is 15min delayed. Also, I am not sure if the 15 min delay is important when it comes to establishing a position, but currently Kitco says the price of gold is $1,727 and $GOLD has the price at $1,775. If this difference is important, I would like to find a source that would be in sync with what you are using. Can you recommend a source for gold and silver pricing?
A: Thank you very much for your words of appreciation, I’m very happy that you enjoy the results of our work.
As far as prices are concerned, I’m generally providing targets for the same thing that I’m featuring on the charts – and that’s gold futures. They are usually very similar to the spot prices (that you see on the Kitco app for example). By the way, the Kitco app has real-time prices for metals, such as gold and silver – the delay over there is for the indices and oil. On a side note, we are working on a completely new (mobile friendly) website and a mobile app, which will provide you with up-to-date prices. The app is designed in a way that minimizes the number of clicks/taps necessary to get all the details that one usually needs when analyzing the markets. Please stay tuned.
When you look at StockCharts’ $GOLD price, you will likely see the previous day’s closing price on the chart – the futures contracts over there are not being updated on an intraday basis. This might explain the big discrepancy that you described ($1,775 vs. $1,727). $1,775 was the Feb 25 closing price, so it seems that it would fit.
Anyway, one of the ways to get the latest prices free of charge would be to visit the CME website and check prices for the most active contract (currently it’s the April contract). The quotes are delayed by at least 10 minutes in this case. Alternatively, you can go to stooq.com and click on the “Chart HTML5” link. They have real time prices, but they can be off by several cents or so. Unless one is day-trading, the latter shouldn’t make much of a difference.
Of course, one can simply purchase the data package from their broker and check the prices in their trading platform – that seems to be the most convenient way to proceed.
Q: We are jewelers and have a retail showroom in India. We have an amount of gold loan from central banks of India, and we hedge our position on the MCX platform. Is this the right time to buy physical gold now? Please guide.
A: I don’t want this to sound disrespectful, but the gold price will move in one way or the other regardless of who it is that is monitoring it and what they are doing in their businesses. I don’t think that gold has formed a medium-term bottom yet, and it seems that it’s close to only forming a short-term bottom. I currently plan to start entering long-term investments in the precious metals market when gold moves close to $1,500, even if we don’t see its significant strength relative to the USD Index. If we do, I’ll likely buy more aggressively. I plan to focus on mining stocks at that time, in case of both investment and trading capital.
I cannot tell you how it fits your specific business plans, when you’d need to stock up on inventory and when to hedge what you have. I don’t have the necessary details for that, and even if I did, I couldn’t provide a detailed reply, as that would be considered investment advice, and I cannot provide such.
I’ll keep you updated with regard to my thoughts on the gold market and other parts of the precious metals market through my Alerts, but I won’t be able to tell you what you should specifically do with this information.
Q: Thank you for your updates. You are one of the few or maybe the only one that I find who cares for his customers. I have joined a lot of newsletters over the last 20 years. Yours is humane, honest, and profitable.
A: Thank you! I’m genuinely very happy to hear that, and I’ll strive to continue providing you with great service.
Q: Thanks for this P.R. Your dedication to your clients is appreciated. Could you clarify for me: Are these exit points the point to start the long position for the long-term, or is it an exit strategy to go long, long-term or a brief exit to go short again when gold declines to the $1,500 level? Or is $1,500 for gold no longer a target?
A: Thanks, and it’s great to hear that you enjoy our services. To clarify: I think that gold is going to form the final medium-term bottom close to $1,500 or lower. While it gets there, it seems that we’ll have at least one temporary corrective upswing, likely starting from about $1,670 - $1,680. It seems that this corrective upswing is “certain enough” for us to enter a brief long position for several days, before we return to the short positions.
I plan to start entering the long-term investment position in the precious metals sector when gold is trading close to $1,500. If we get major bullish confirmations, I’ll likely buy more aggressively. For now, it seems that gold is about to launch a short-term corrective upswing, but nothing more.
I’ll keep updating the “Overview of the Upcoming Part of the Decline” section, so that the “bigger picture” of the entire move doesn’t get blurry.
Q: Many thanks for your direct response. I was fortunate to have completed scale-up selling at prices averaging just 4 cents below your revised DUST target on Friday, so thank you very much. Great call by you!! Bravo! Likely this was perhaps my longest held position and the most painful trade I have ever executed over my many years trading miners and ETFs. More particularly, I would like to commend you for your dedication to your subscribing readers, and your direct and published responses to them, me included, and the many hours I’m certain it takes you to do this, in addition to writing your daily analysis.
A: Thank you! It’s very important to me that our subscribers get valuable service from us, and taking the time to reply to people’s questions is one of the things that I’m happy to do. Unfortunately, it’s not possible to be right about the market each and every time, but I can take time, each and every time, to reply to my subscribers’ questions in detail. Being a Stoic implies that I care greatly about things that are under my control, while not being obsessed over things that are beyond it. While the market’s behavior doesn’t depend on me, my dedication is to explaining the situation how I see it, and making sure that I reply to the questions that I receive – they do depend on me and that’s what I know that I can definitely deliver.
Q: Just to be clear, right now you are suggesting no position in dust or NUGT, but if gold drops to 1703, you would go long with NUGT at 100% position? Please confirm.
A: Generally, yes, but not $1,703, but rather $1692. And I mean GDX, NUGT, or GDXU, depending on what one prefers with regard to leverage (the latter is for more advanced traders only).
Q: I find your insights very informative; I have just begun trading XAUUSD CFD, and I’m using a trend following strategy, based on a weekly one bar decision. Your insight are very reliable on defining the trend and short term trend, but I do not trade the GDX, and I have just had to look to COT, and find that commercials are covering their short at a big pace, large speculators reduced their long holding the most. My question is whether 1670-1700 level is really a bottom for gold or will it continue sliding every week? Should I close my short positions next week and enter longs as soon as it makes a daily higher low and higher close?
A: Thank you, and I’m happy to see that you enjoy the results of our work. I think that gold will move lower – below $1,670, but not before correcting first. I think the correction in gold will be visible as well (it’s not going to be something visible in the mining stocks only), with gold rallying to perhaps $1,770 or so. Then, after this corrective upswing, I expect gold to move lower once again, likely forming a bottom (perhaps the final one) close to $1,500.
Whether or not you should make trades based on the above opinions is something for you to decide based on how it fits your trading plan, risk tolerance and so on.
Summary
To summarize, the PMs’ decline is already underway, as miners broke below the neck level of their almost-yearly head-and-shoulders formation and then continued the decline.
In addition, because we’re likely entering the “winter” part of the Kondratiev cycle (just like in 1929 and then the 1930s), the outlook for the precious metals’ sector remains particularly bearish during the very first part of the cycle, when cash is king.
The confirmed breakout in the USD Index is yet another confirmation of the bearish outlook for the precious metals market.
After the sell-off (that takes gold to about $1,450 - $1,500), we expect the precious metals to rally significantly. The final part of the decline might take as little as 1-5 weeks, so it's important to stay alert to any changes.
Most importantly, please stay healthy and safe. We made a lot of money last March and it seems that we’re about to make much more on this March decline, but you have to be healthy to enjoy the results.
Please take a look at the “trading capital” specifications below as there are quite a few changes in it. The prices are up-to-date, which means that I restored the original target for the GDXJ (after adjusting it temporarily on Friday, February 26) based on the likelihood of seeing another move lower in gold. I also updated the target for the JDST, and I updated the gold price based on which I plan to enter quick long positions.
As always, we'll keep you - our subscribers - informed.
To summarize:
Trading capital (supplementary part of the portfolio; our opinion): Full speculative short positions (300% of the full position) in mining stocks are justified from the risk to reward point of view with the following binding exit profit-take price levels:
Senior mining stocks (price levels for the GDX ETF): none
Junior mining stocks (price levels for the GDXJ ETF): binding profit-take exit price: $42.72; stop-loss: none (the volatility is too big to justify a SL order in case of this particular trade); binding profit-take level for the JDST ETF: $13.79; stop-loss for the JDST ETF: none (the volatility is too big to justify a SL order in case of this particular trade)
For-your-information targets (our opinion; we continue to think that mining stocks are the preferred way of taking advantage of the upcoming price move, but if for whatever reason one wants / has to use silver or gold for this trade, we are providing the details anyway. In our view, silver has greater potential than gold does):
Silver futures downside profit-take exit price: unclear at this time - initially, it might be a good idea to exit, when gold moves to $1,693.
Gold futures downside profit-take exit price: $1,693.
=====
Moreover, even if none of the above-mentioned targets are reached, but gold moves to $1,693, I think that closing any remaining positions would be justified from the risk to reward point of view, anyway.
Additionally, if gold moves to $1,692, I think that LONG trading positions in GDX will be justified from the risk to reward point of view with $32.39 as the next target.
Alternatively to GDX – if one seeks to gain leverage, one might consider going long (when gold moves to $1,703) NUGT (2x leverage) or GDXU (3x leverage – not recommended for most due to the significant leverage, but might be interesting tool for more advanced traders).
The size of position for this very quick long position would be regular.
We are not using GDXJ here for the sake of simplicity in case of this quick trade and because GDXJ didn’t reach support that’s as strong as the one that the GDX ETF just reached.
======
Long-term capital (core part of the portfolio; our opinion): No positions (in other words: cash
Insurance capital (core part of the portfolio; our opinion): Full position
Whether you already subscribed or not, we encourage you to find out how to make the most of our alerts and read our replies to the most common alert-and-gold-trading-related-questions.
Please note that we describe the situation for the day that the alert is posted in the trading section. In other words, if we are writing about a speculative position, it means that it is up-to-date on the day it was posted. We are also featuring the initial target prices to decide whether keeping a position on a given day is in tune with your approach (some moves are too small for medium-term traders, and some might appear too big for day-traders).
Additionally, you might want to read why our stop-loss orders are usually relatively far from the current price.
Please note that a full position doesn't mean using all of the capital for a given trade. You will find details on our thoughts on gold portfolio structuring in the Key Insights section on our website.
As a reminder - "initial target price" means exactly that - an "initial" one. It's not a price level at which we suggest closing positions. If this becomes the case (like it did in the previous trade), we will refer to these levels as levels of exit orders (exactly as we've done previously). Stop-loss levels, however, are naturally not "initial", but something that, in our opinion, might be entered as an order.
Since it is impossible to synchronize target prices and stop-loss levels for all the ETFs and ETNs with the main markets that we provide these levels for (gold, silver and mining stocks - the GDX ETF), the stop-loss levels and target prices for other ETNs and ETF (among other: UGL, GLL, AGQ, ZSL, NUGT, DUST, JNUG, JDST) are provided as supplementary, and not as "final". This means that if a stop-loss or a target level is reached for any of the "additional instruments" (GLL for instance), but not for the "main instrument" (gold in this case), we will view positions in both gold and GLL as still open and the stop-loss for GLL would have to be moved lower. On the other hand, if gold moves to a stop-loss level but GLL doesn't, then we will view both positions (in gold and GLL) as closed. In other words, since it's not possible to be 100% certain that each related instrument moves to a given level when the underlying instrument does, we can't provide levels that would be binding. The levels that we do provide are our best estimate of the levels that will correspond to the levels in the underlying assets, but it will be the underlying assets that one will need to focus on regarding the signs pointing to closing a given position or keeping it open. We might adjust the levels in the "additional instruments" without adjusting the levels in the "main instruments", which will simply mean that we have improved our estimation of these levels, not that we changed our outlook on the markets. We are already working on a tool that would update these levels daily for the most popular ETFs, ETNs and individual mining stocks.
Our preferred ways to invest in and to trade gold along with the reasoning can be found in the how to buy gold section. Furthermore, our preferred ETFs and ETNs can be found in our Gold & Silver ETF Ranking.
As a reminder, Gold & Silver Trading Alerts are posted before or on each trading day (we usually post them before the opening bell, but we don't promise doing that each day). If there's anything urgent, we will send you an additional small alert before posting the main one.
Thank you.
Przemyslaw Radomski, CFA
Founder, Editor-in-chief

