

Briefly: in our opinion, full (300% of the regular position size) speculative short positions in mining stocks are justified from the risk/reward point of view at the moment of publishing this Alert.
Gold and mining stocks just broke to new yearly lows – as I warned you in my previous analyses. And that’s only the beginning.
Let’s jump right into the charts, starting with gold.
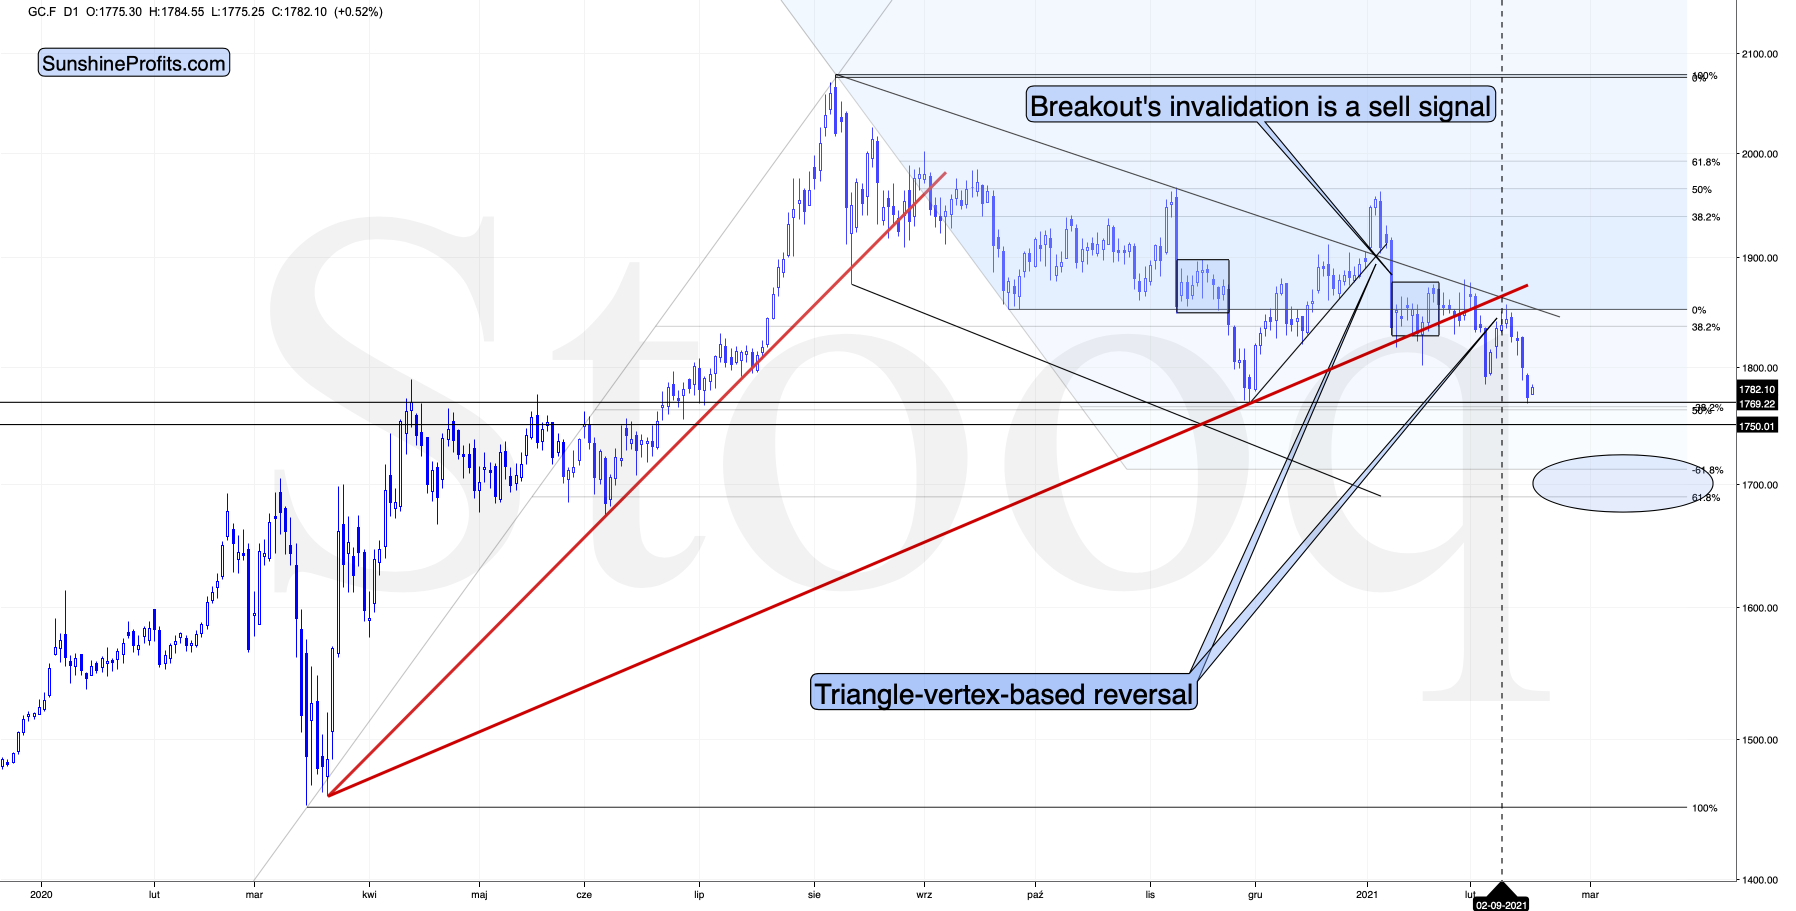
Figure 1 - COMEX Gold Futures
In early February, gold broke below the rising red support line and it then verified it by rallying back to it and then declining once again. It topped almost exactly right at its triangle-vertex-based reversal, which was yet another time when this technique proved to be very useful.
Gold has just closed not only at new yearly lows, but also below the late-November lows (in terms of the closing prices, there was no breakdown in intraday terms). This means that yesterday’s (Feb. 17) closing price was the lowest daily close since late June 2020. At the moment of writing these words, gold is also trading below the April 2020 intraday high.
Gold was likely to slide based on myriads of technical and cyclical factors, while the fundamental factors remain very positive – especially considering that we are about to enter the Kondratiev winter, or we are already there. As a reminder, Kondratiev cycles are one of the longest cycles and the stages of the cycle take names after seasons. “Winter” tends to start with a stock market top that is caused by excessive credit. In this stage gold is likely to perform exceptionally well… But not right at its start. Even the aftermath of the 1929 top (“Winter” started then as well), gold stocks declined for about 3 months before soaring. In the first part of the cycle, cash is likely to be king. And it seems that the performance of the USD Index is already telling investors to buckle up.
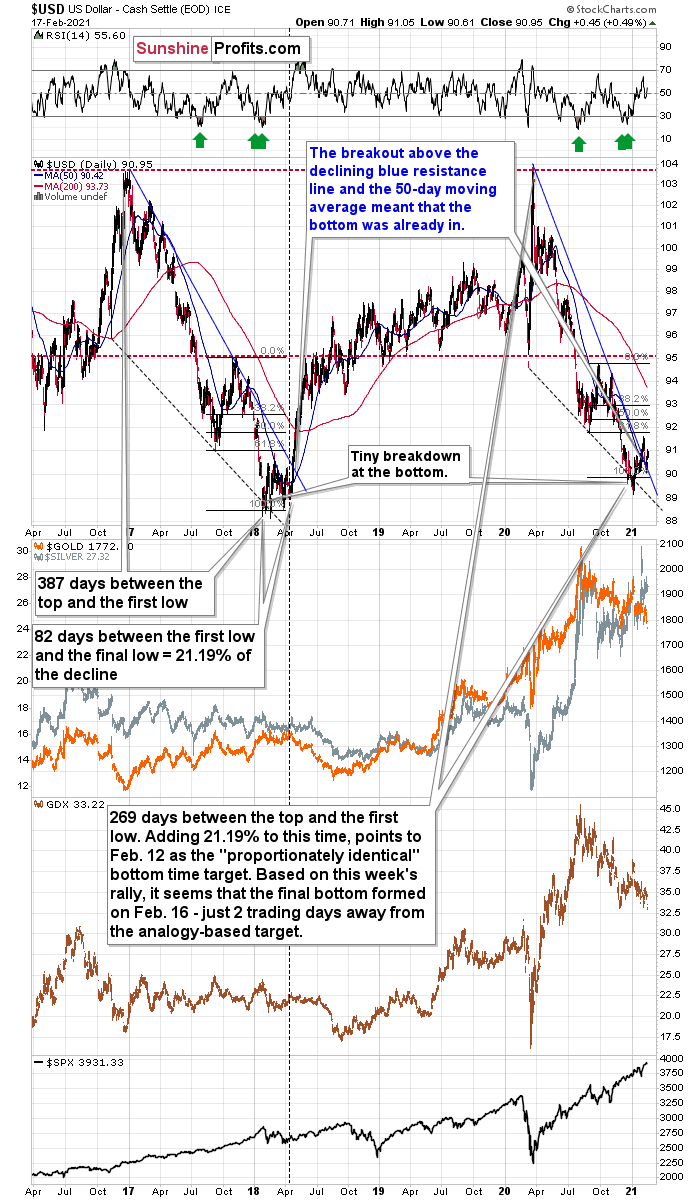
Figure 2
If the fact that gold invalidated its breakout above its 2011 high, despite the ridiculously positive fundamental situation, doesn’t convince you that gold does not really “want” to move higher before declining profoundly first, then the above chart might.
As I wrote above, gold is currently more or less when it was trading at the April 2020 top. Where was the USD Index trading back then? It was moving back and forth around the 100 level.
100!
The USD Index closed a little below 91, and gold is at the same price level! That’s a massive 9 index-point decline in the USDX that gold shrugged off just like that.
There’s no way that gold could “ignore” this kind of movement and be “strong” at the same time. No. It’s been very weak in the previous months, which is a strong sign (not a fundamental one, but a critical one nonetheless) that gold is going to move much lower once the USD Index finally rallies back up.
Right now, waiting for gold to rally is like waiting for the light to turn green, arguing that eventually it has to turn green, while not realizing that the light is broken (gold just didn’t rally despite the huge decline in the USDX). Yes, someone will fix it and eventually it will turn green, but it doesn’t mean that it makes much sense to wait for that to happen, instead of looking around and crossing the street if it’s safe to do so.
Yes, gold is likely to rally to new highs in the coming years. And silver is likely to skyrocket. But in light of just two of the above-mentioned factors (gold’s extreme underperformance relative to the USD Index and the invalidation of a critical breakdown) doesn’t it make sense not to purchase gold right now (except for the insurance capital that is) in order to buy it after several weeks / few months when it’s likely to be trading at much lower levels?
We live in very specific times. Getting a “like” on a post or picture becomes a necessary daily activity and means of self-validation. Not “liking” something that others posted or that is massively “liked” may be frowned upon or even viewed as being disrespectful. Plus, it seems that no matter what you do, everyone gets offended very easily. When did honesty, independence and common-sense stop being virtues?
When it comes to gold investment analysis, it’s surprisingly similar. You either like gold and think that it’s going higher right away or you’re “one of them”. “Them” can be anyone who tries to manipulate gold or silver prices, “banksters”, or some kind of unknown enemy. “Analysts'” goal is often no longer to be as objective as possible and to provide as good and as unbiased an analysis as possible, but to simply be cheering for gold and provide as many bullish signals as possible regardless of what one really thinks about them. The above may seem pleasant to readers, but it’s not really in their best interest. In order to make the most of any upswing, it’s best to enter the market as low as possible and to exit relatively close to the top. What happens before a price is as low as possible? It declines. Why would something like that (along with those describing it) be hated by gold investors? It makes no sense, but yet, it’s often the case.
Top of Form
Bottom of Form
The discussion – above and below – can be viewed as something positive or negative for any investor, but while reading it, please keep in mind that our goal is the same as yours – we want to help investors make the most of their precious metals investments. Call us old-fashioned, but regardless of how unpleasant it may seem, we’ll continue to adhere to honesty, independence and common-sense in all our analyses
Ok, but why on Earth would the USD Index rally back up? The Fed is printing so much dollars – why would they be worth more?!
Because the currencies are valued with relation to each other and whether or not the USD Index moves higher or lower doesn’t depend only on what the Fed is doing.
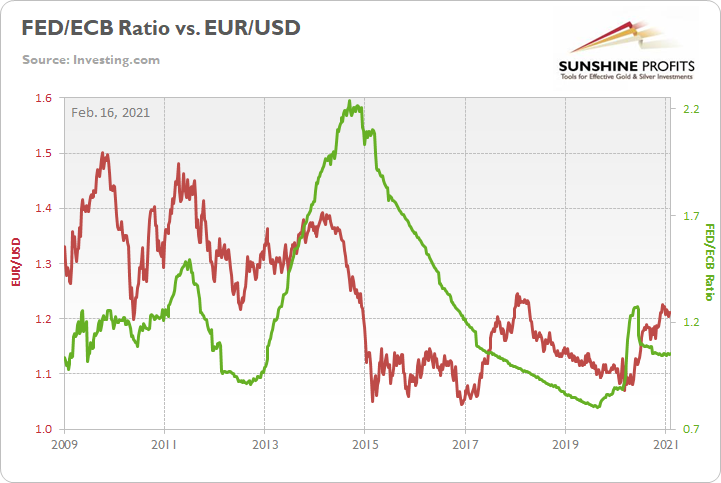
Figure 3
What other monetary authorities do matters as well and right now the ECB is outprinting the Fed (that’s what the decline in the green line above means), which means that the euro is likely to fall more than the U.S. dollar. Therefore, the EUR/USD currency exchange rate would be likely to decline and since this exchange rate is the biggest (over 50%) component of the USD Index, it makes perfect sense – from the fundamental point of view – to expect the USD Index to move higher.
Can gold rally despite higher USD Index values? Absolutely. However, it would first have to start to behave “normally” relative to the USD Index, and before that happens it would have to stop being extremely weak relative to it. And the fact that gold is at the same price level despite a 9-index-point decline in the USDX is extreme weakness.
To make the technical discussion easier, I’m attaching the previous chart once again.
Figure 4
On Monday (Feb. 15), I wrote the following about the above chart:
The size and shape of the 2017-2018 analogue continues to mirror the current price action. However, today, it’s taken 118 less days for the USD Index to move from peak to trough.
Also, it took 82 days for the USDX to bottom in 2017-2018 (the number of days between the initial bottom and the final bottom) and the number amounts to 21.19% of the overall duration. If we apply a similar timeframe to today’s move, it implies that a final bottom may have formed on Feb. 12. As a result, the USDX’s long-term upswing could begin as soon as this week.
Also noteworthy, as the USDX approached its final bottom in 2017-2018, gold traded sideways. Today, however, gold is already in a downtrend. From a medium-term perspective, the yellow metal’s behavior is actually more bearish than it was in 2017-2018.
Also supporting the historical analogue, the USD Index’s current breakout above its 50-day moving average is exactly what added gasoline to the USDX’s 2018 fire. Case in point? After the 2018 breakout, the USDX surged back to its previous high. Today, that level is roughly 94.5.
Based on this week’s rally it seems that the final bottom formed on Tuesday (Feb. 16) – just 2 trading days away from the analogy-based target, and in perfect tune with what I wrote back then. The breakout above both: the declining blue line, and the 50-day moving average was verified, and the short-term outlook here is clearly bullish.
But isn’t the current situation similar to what happened in mid-2020? The correction that was followed by another decline?
In a way, it is. In both cases, the USD Index moved higher after a big decline, but that’s about it as far as important similarities are concerned.
What is different is the entire context. Even a single look at the above chart provides an instant answer. The mid-2020 correction was like the mid-2017 correction, and what we see right now is the post-bottom breakout, just as we saw in the first half of 2018.
There are multiple details on the above chart that confirm it, including the sizes of the medium-term declines, the position of the price relative to the declining support/resistance lines, as well as relative to the 50-day moving average, and even the green arrows in the RSI indicator show how similar the preceding action was in case of this indicator. The vertical dashed line shows “where we are right now” in case of the analogy.
Also, the fact that the general stock market has not yet declined in any substantial way only makes the short-term outlook worse (particularly for silver and miners). When stocks do slide, they would be likely to impact the prices of miners and silver particularly strongly.
We’re looking for the bottom in the precious metals sector not because we’re the enemy of gold or the precious metals investor . On the contrary, we’re that true friend that tells you if something’s not right, even if it may be unpleasant to hear. We want to buy more and at better prices close to the bottom, and we’ll continue to strive to assist you with that as well.
Having said that, let’s move on to silver.
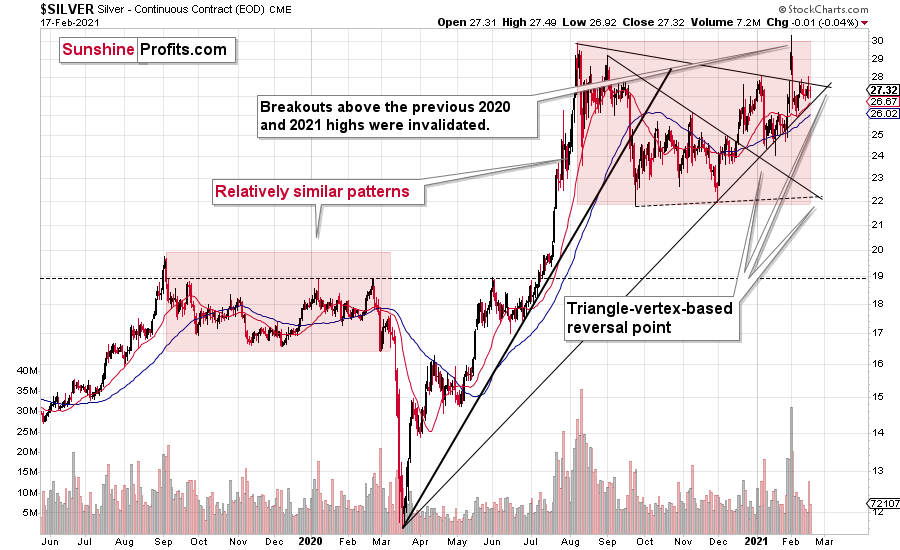
Figure 5
Practically everything that I wrote about silver recently remains up-to-date, as the white metal didn’t move much in the last several days. There is one thing that I would like to add today, though – that the price pattern that I marked on the above chart with red appears quite similar. They are not identical, but the overall U-shaped consolidation is present in both cases. Silver is holding up better right now, but that’s likely due to the exposure it just got in various forums.
The above is a good reason for silver to perform well in the following years, but it’s also a reason for silver to behave even more like “silver” during the decline.
More relatively inexperienced investors are holding silver right now. This means that when they panic (as the inexperienced investors tend to during the declines), the price is likely to slide very sharply. But… so far, it’s holding up quite well. This means that the tactic to first profit on mining stocks’ decline and then to switch to silver might be even more profitable than I originally expected it to be.
Given the proximity of the triangle-vertex-based reversal in silver, it could even be the case that silver moves higher one more (final) time before the slide starts. Then again, it could be the case that it declines sharply and bottoms shortly – just like it did in September 2020.
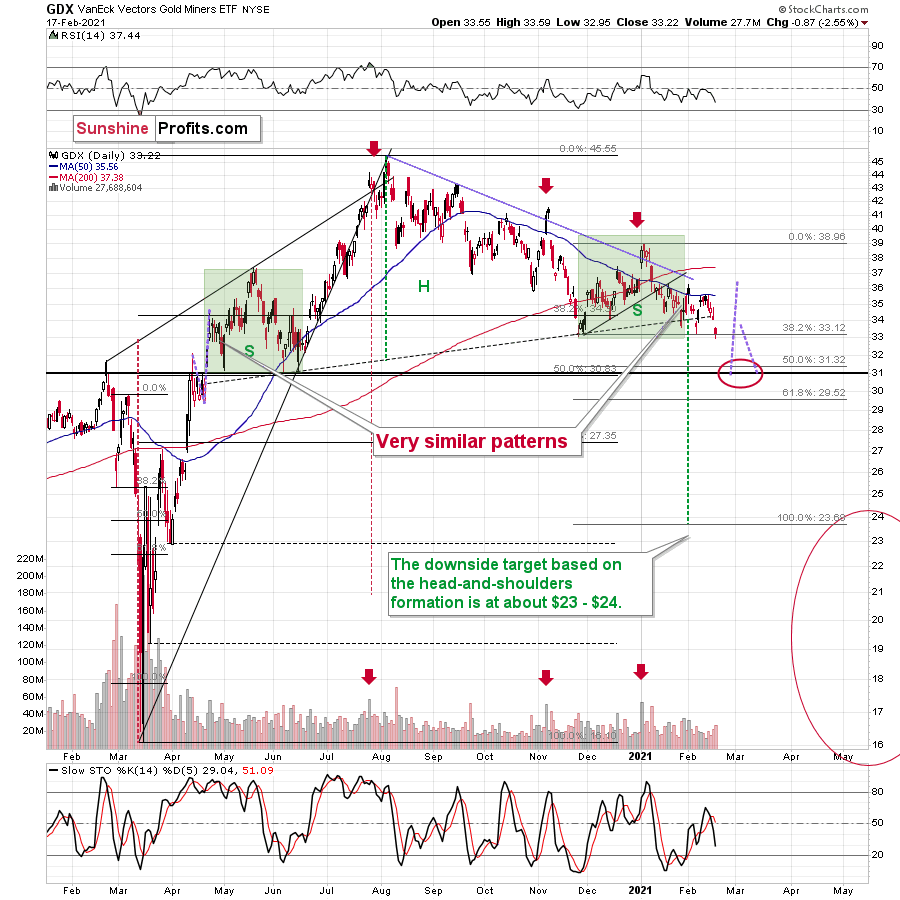
Figure 6
Mining stocks moved below the November lows in terms of both: intraday prices and daily closing prices. The GDX ETF also broke below the rising neck level of the broad head and shoulders pattern. That’s the third attempt to break below it and it seems that it might finally be successful. The GDX would have to rally (and close) back above $34 in order to invalidate this breakdown and the counter-trend rally in gold that I see at the moment of writing these words, doesn’t justify this kind of move. The GDX ETF is up by only 0.85% in its trading on the London Trade Exchange. The rally would have to be three times as big to move back to the neckline of the H&S pattern.
Consequently, the bearish implications of the above chart remain up-to-date:
The 50-day moving average seems to have stopped the preceding upswing and miners are now ready to move lower.
The slide to about $31, then a comeback to $33 - $34 and then another – much bigger – slide continue to be the most likely outcome from here. The least certain part, in my opinion, is the existence or the size of the corrective upswing after the initial decline to about $31.
Yesterday’s analysis includes a detailed coverage of the analogy to the 2008 in case of mining stocks. If you haven’t read it yet, I strongly encourage you to read it today.
Moreover, please note that the breakdown in the HUI to S&P 500 ratio is now much clearer.
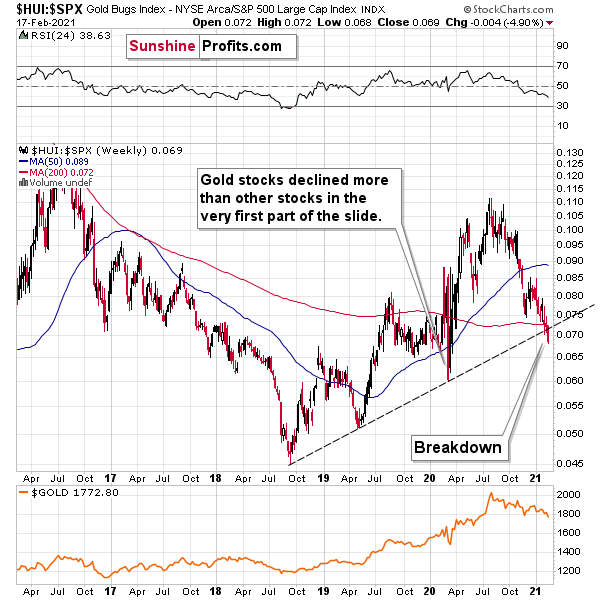
Figure 7
Quoting yesterday’s analysis:
This ratio shows how well gold stocks perform relative to other stocks. In other words, this ratio replies to the following question:
“How would gold stocks perform if it wasn’t for the movement of the general stock market?”
In a way, the above ratio is more “true” than the HUI Index itself, because it focuses much more on the “precious metals” aspect of the index.
What is important is that we are witnessing a breakdown below the rising support line that started in 2018, that was created based on also the 2019 bottom and that served as support at the 2020 bottom. The fact that this ratio managed to stop the decline is remarkable.
Let’s go through this again: gold stocks are doing something more bearish that they weren’t able to do even at the end of the 2020 slide.
The breakdown is not yet confirmed and it’s not yet significant, but it is a small crack in a very important dam. The implications are already bearish.
This “crack” is now much bigger. Once we get a weekly close below the rising support line, it will become critical.
Having said that, let’s consider the broader picture.
Buying Time
As sideways becomes the new down for U.S. equities, the S&P 500 investors undoubtedly want it to move higher. But as valuations stretch further into uncharted territory, risk of a severe correction continues to build.
On Feb. 12, FactSet’s Earnings Insights report revealed that the S&P 500’s forward price-to-earnings ratio (P/E) remains historically elevated at 22.2x. For context, the figure is more than 25% above the five-year average (17.7x) and more than 40% above the 10-year average (15.8x).
Please see below:
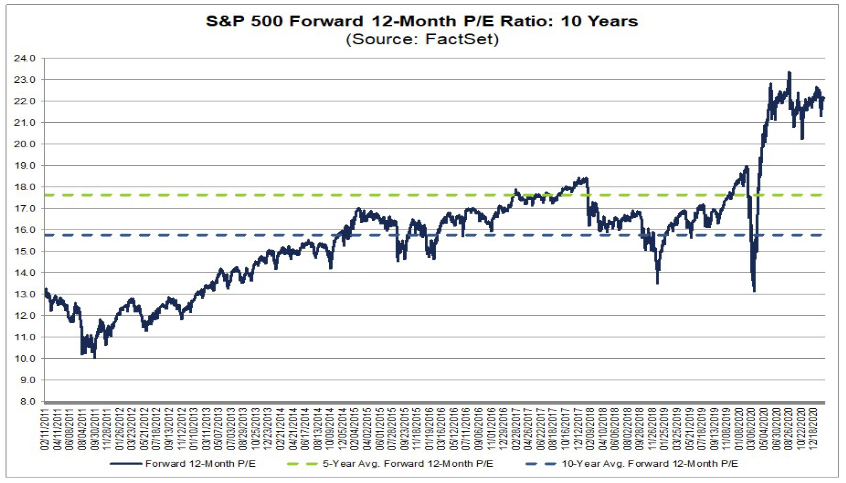
Figure 8
If we zoom in further, every sector within the S&P 500 has also enjoyed some degree of multiple expansion.
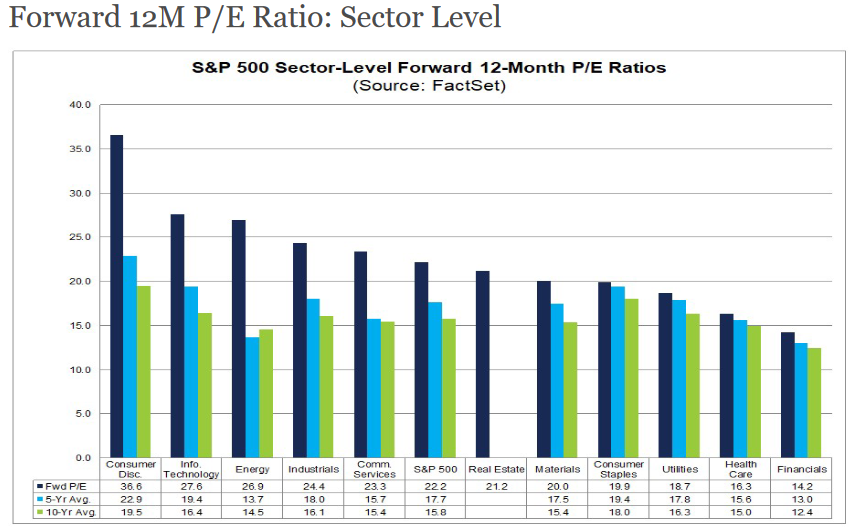
Figure 9
To explain, the dark blue bar above depicts each sector’s forward P/E, while the light blue bar depicts the five-year average and the green bar depicts the 10-year average. Highlighting the exuberance, the consumer discretionary sector is trading nearly 60% above its five-year average and nearly 88% above its 10-year average. Similarly, the technology sector is trading more than 42% above its five-year average and more than 68% above its 10-year average.
Even more striking, prophecies of an economic boom have bid the energy sector to more than 96% above its five-year average and nearly 86% above its 10-year average.
For context, forward P/E estimates compare current stock prices to analysts’ forecasted earnings per share (EPS) over the next 12 months. As a result, they are not biased higher due to the economic impact of COVID-19.
Conversely, trailing P/E’s compare current stock prices to companies’ actual EPS over the prior 12 months. Using this metric, valuations have absolutely exploded.
Please see below:
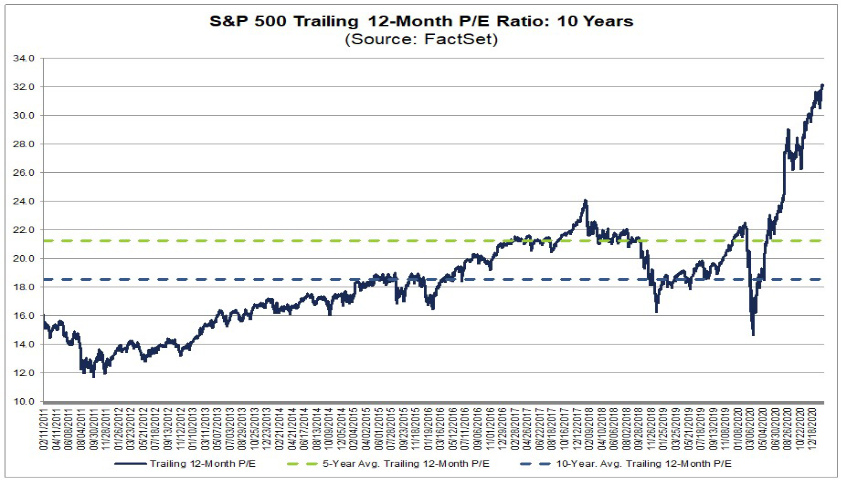
Figure 10
At ~32x, the current reading is more than 48% above the five-year average (~21.5x) and more than 68% above the 10-year average (~19x).
But moving in the opposite direction, anywhere from 36% (within the industrial sector) to 80% (within the energy sector) of S&P 500 constituents reported a year-over-year decline in their fourth-quarter net profit margin in 2020 (the most-recent quarter).
Please see below:
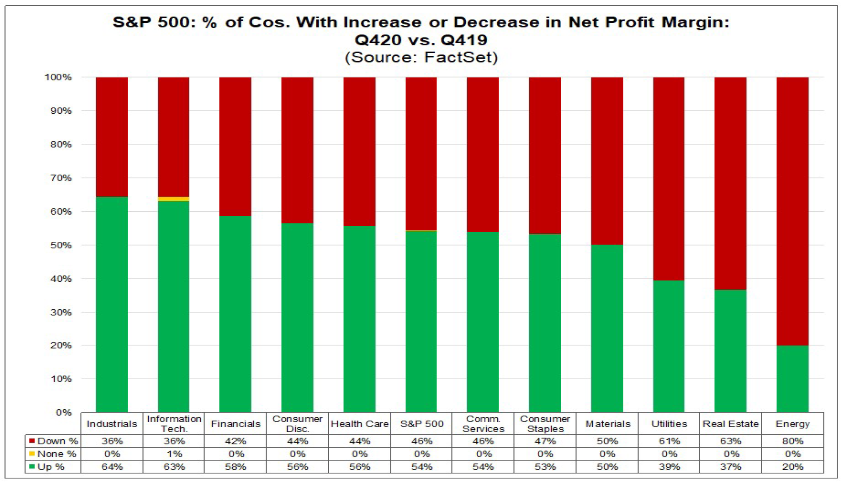
Figure 11
To explain, the data above is segregated by sector. And within each sector, the red bar depicts the percentage of S&P 500 companies that reported a lower net profit margin in Q4, while the green bar depicts the percentage of S&P 500 companies that reported a higher net margin in Q4. As you can see, only ~50% of S&P 500 companies are demonstrating any real strength.
But fuelling the epic divergence, analysts’ earnings upgrades have been a bullish catalyst.
To explain, I wrote previously:
Analysts increase their earnings estimates when they believe a company’s fundamentals have improved. Conversely, they revise earnings downward when they believe that fundamentals have deteriorated. More importantly though, upward revisions are met with cheers from market participants. When analysts forecast better performance, stock prices respond in kind.
However, amidst the excessive optimism and prophecies of a utopian future, the S&P 500’s forward P/E is still trading more than 25% and 40% above its historical average (mentioned above). Thus, stock prices continue to outpace upward revisions.
More importantly though, the slew of bullish upgrades may have just peaked.
According to JPMorgan, upgrades (as a percentage of total upgrades/downgrades) hit an all-time high of 42.6% in January. However, as optimism gave way to economic reality, that number has already declined to 39.2% in February.
Please see below:
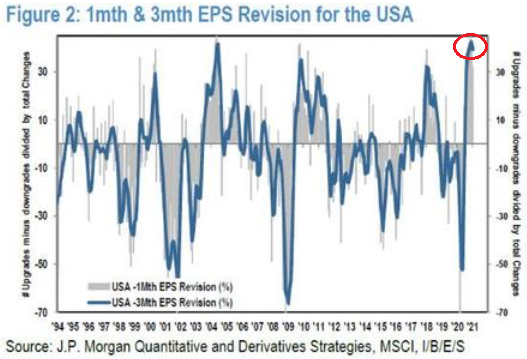
Figure 12
And why is this relevant?
Because as JPMorgan strategists point out, “If this is the start of a new trend, then investors may find equities gains first start to fall, and, if net downgrades follow, then there is an increasing probability that equities fall.”
Translation? Lack of future upgrades should take the air out of the equity balloon. And if earnings downgrades happen to follow, it could unwind a lot of the recent excess.
Also supportive, Bank of America’s Bull & Bear indicator is approaching a precipice. Since 2000, 12 sell signals (once the indicator reaches 8) have been followed by global equities suffering a median drawdown of 9%.
Please see below:
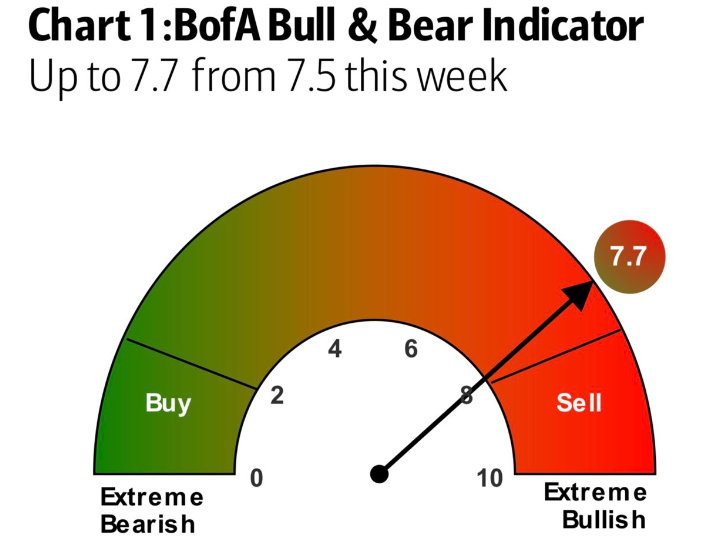
Figure 13
Even more ominous, record upgrades, record call option activity and record speculation are occurring alongside record complacency. I warned previously that margin debt is at an all-time high, while fund managers’ cash positions and short interest are at (or near) all-time lows. And adding to the mosaic of FOMO, only 13% of fund managers surveyed by Bank of America cited current behavior as symptomatic of a bubble.
Please see below:
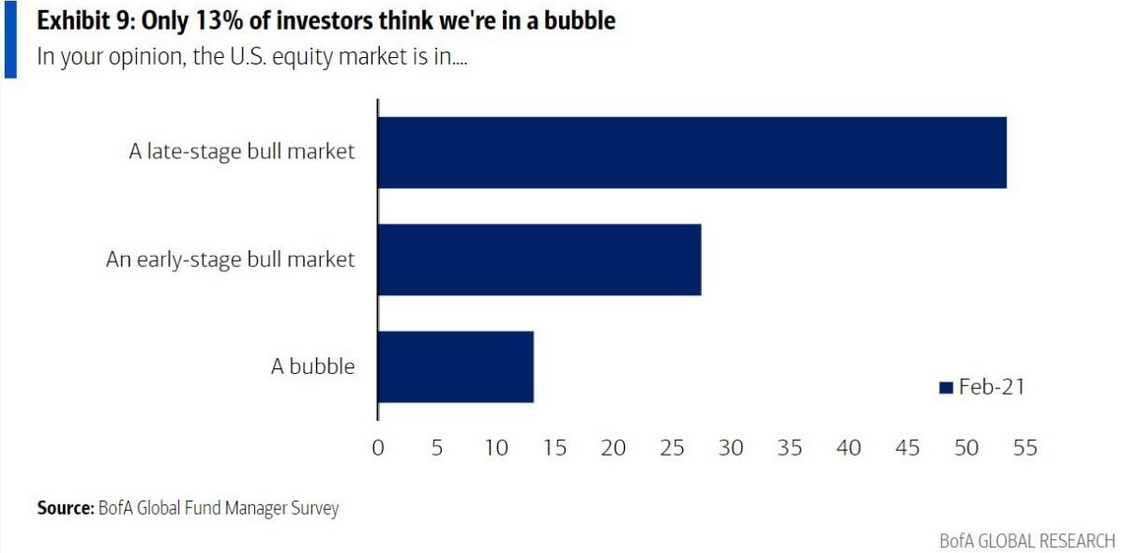
Figure 14
Even more telling, nearly 30% of respondents said that U.S. equities are in an early-stage bull market. If so, then should we expect the S&P 500’s forward P/E to trade at 50% and 80% premiums to its historical averages?
Poking more holes in their thesis, notice the extreme divergence between penny stock volume and SPY volume since the beginning of 2020?
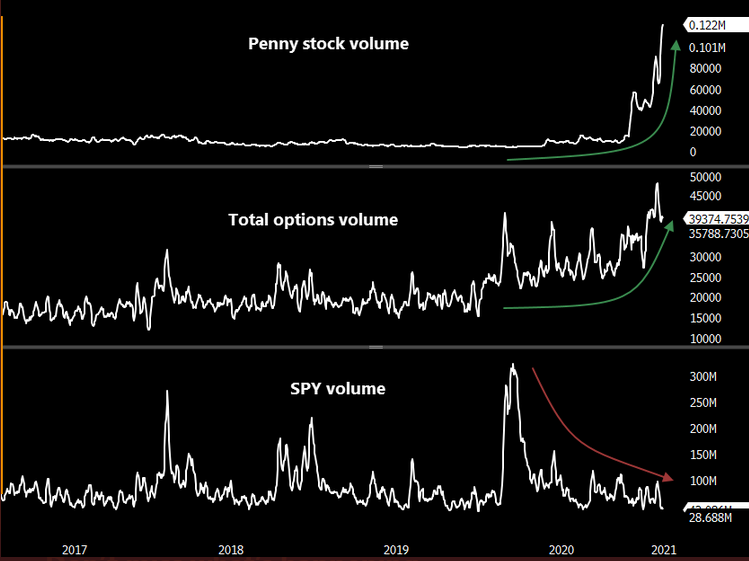
Figure 15 - Source: Bloomberg/SentimenTrader
For context, penny stocks are the riskiest equities, and essentially, the definition of speculation. In contrast, SPY (the SPDR S&P 500 Trust ETF) is an index fund that’s often used for broad equity exposure. As you can see, ever since the U.S. Federal Reserve (FED) flooded the system with liquidity in 2020, speculation has been the name of the game.
Speaking of the FED, the central bank released its latest FOMC minutes on Feb. 17. Quick to tout “a considerably stronger outlook for activity in 2021 relative to the December forecast,” akin to equities, their projections are based solely on hope. Admitting that “incoming data had been weaker than expected,” the committee also claimed “that the risks to the baseline projection were skewed to the downside and that the uncertainty around the forecast was elevated.”
Essentially, the FED has no idea.
However, if things were so rosy, would the FED be stress testing banks’ ability to withstand a 55% drop in equities?
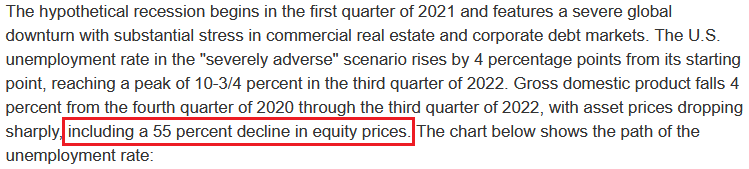
Figure 16 - Source: U.S. Federal Reserve (FED)
As for the potential impact on the precious metals, gold, silver and the miners have moderate-to-strong correlations with the S&P 500 (0.72, 0.88 and 0.62 respectively over a 250-day period).
Please see below:
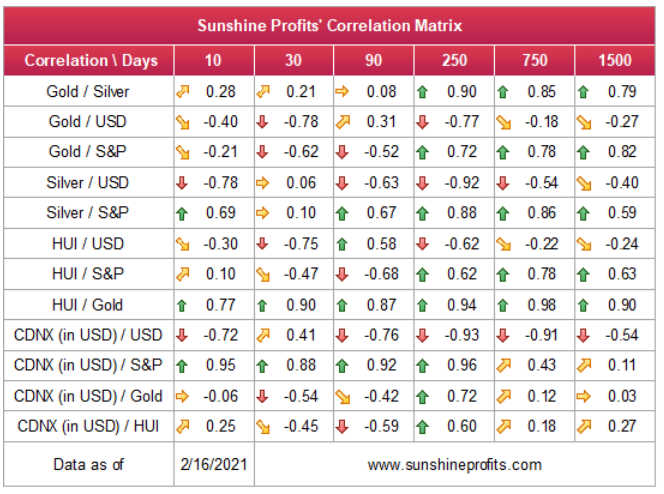
Figure 17
As a result, a profound drawdown of U.S. equities could significantly impact the PMs. Case in point: when the NASDAQ plunged by nearly 80% after the dot-com bubble burst, gold miners lost more than 50% of their value. What’s more, the last six times the NASDAQ 100 declined by more than 2% in a day, the PMs suffered mightily (if you exclude silver’s short squeeze divergence on Jan. 29).
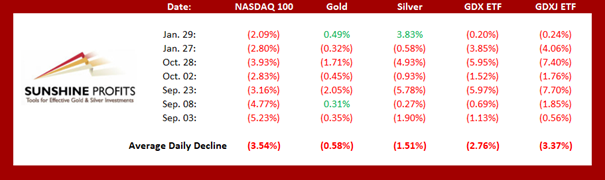
Figure 18
In conclusion, U.S. equities are an important variable that impacts the performance of the PMs. History has shown that swift drawdowns of the former elicit negative responses from the latter. And because of this, it’s prudent to leave no stone unturned. However, with gold and the miners approaching my initial downside targets, a buying opportunity may present itself in the near future.
Overview of the Upcoming Part of the Decline
- I expect the initial bottom to form with gold falling to roughly $1,700, and I expect the GDX ETF to decline to about $31 - $32 at that time. I then plan to exit the short positions in the miners and I will consider long positions in the miners at that time – in order to benefit from the likely rebound.
- I expect the above-mentioned decline to take another 1 – 7 weeks to materialize and I expect the rebound to take place during 1-3 weeks.
- After the rebound (perhaps to $33 - $34 in the GDX), I plan to get back in with the short position in the mining stocks.
- Then, after miners slide once again in a meaningful and volatile way, but silver doesn’t (and it just declines moderately), I plan to switch from short positions in miners to short positions in silver (this could take another 1-4 weeks to materialize). I plan to exit those short positions when gold shows substantial strength relative to the USD Index, while the latter is still rallying. This might take place with gold close to $1,500 and the entire decline (from above $1,700 to about $1,500) would be likely to take place within 1-10 weeks and I would expect silver to fall hardest in the final part of the move. This moment (when gold performs very strongly against the rallying USD and miners are strong relative to gold – after gold has already declined substantially) is likely to be the best entry point for long-term investments in my view. This might happen with gold close to $1,500, but it’s too early to say with certainty at this time.
- Consequently, the entire decline could take between 3 and 20 weeks, while the initial part of the decline (to $1,700 in gold) is likely to take between 1 and 7 weeks.
- If gold declines even below $1,500 (say, to ~$1350 or so), then it could take another 10 weeks or so for it to bottom, but this is not what I view as a very likely outcome.
- As a confirmation for the above, I will use the (upcoming? perhaps we have already seen it) top in the general stock market as the starting point for the 3-month countdown. The reason is that after the 1929 top gold miners declined for about 3 months after the general stock market started to slide. We also saw some confirmations of this theory based on the analogy to 2008. All in all, the precious metals sector would be likely to bottom about 3 months after the general stock market tops .
- The above is based on the information available today and it might change in the following days/weeks.
Summary
To summarize, the PMs’ short-term downswing has likely just begun, as miners broke below the neck level of their almost-yearly head-and-shoulders formation. We saw a small invalidation, but we don’t trust its bullish implications – we just saw something similar that failed to ignite a lasting rally and the USD’s decline seems to be a normal, post-breakout pullback.
In addition, because we’re likely entering the “winter” part of the Kondratiev cycle (just like in 1929 and then the 1930s), the outlook for the precious metals’ sector remains particularly bearish during the very first part of the cycle, when cash is king.
Silver’s strength seems bullish at first sight, but taking a closer look at this move, and comparing it with previous cases (when silver got so much attention) and with miners’ weakness, provides us with bearish implications for the medium term.
The confirmed breakout in the USD Index is yet another confirmation of the bearish outlook for the precious metals market.
Naturally, everyone's trading is their responsibility. But in our opinion, if there ever was a time to either enter a short position in the miners or increase its size if it was not already sizable, it's now. We made money on the March decline, and on the March rebound, with another massive slide already underway.
After the sell-off (that takes gold to about $1,500), we expect the precious metals to rally significantly. The final part of the decline might take as little as 1-5 weeks, so it's important to stay alert to any changes.
Most importantly, please stay healthy and safe. We made a lot of money on the March decline and the subsequent rebound (its initial part) price moves (and we'll likely earn much more in the following weeks and months), but you have to be healthy to enjoy the results.
As always, we'll keep you - our subscribers - informed.
To summarize:
Trading capital (supplementary part of the portfolio; our opinion): Full speculative short positions (300% of the full position) in mining stocks is justified from the risk to reward point of view with the following binding exit profit-take price levels:
Senior mining stocks (price levels for the GDX ETF): binding profit-take exit price: $32.02; stop-loss: none (the volatility is too big to justify a SL order in case of this particular trade); binding profit-take level for the DUST ETF: $23.89; stop-loss for the DUST ETF: none (the volatility is too big to justify a SL order in case of this particular trade)
Junior mining stocks (price levels for the GDXJ ETF): binding profit-take exit price: $42.72; stop-loss: none (the volatility is too big to justify a SL order in case of this particular trade); binding profit-take level for the JDST ETF: $14.19; stop-loss for the JDST ETF: none (the volatility is too big to justify a SL order in case of this particular trade)
For-your-information targets (our opinion; we continue to think that mining stocks are the preferred way of taking advantage of the upcoming price move, but if for whatever reason one wants / has to use silver or gold for this trade, we are providing the details anyway. In our view, silver has greater potential than gold does):
Silver futures downside profit-take exit price: unclear at this time - initially, it might be a good idea to exit, when gold moves to $1,703.
Gold futures downside profit-take exit price: $1,703
Long-term capital (core part of the portfolio; our opinion): No positions (in other words: cash
Insurance capital (core part of the portfolio; our opinion): Full position
Whether you already subscribed or not, we encourage you to find out how to make the most of our alerts and read our replies to the most common alert-and-gold-trading-related-questions.
Please note that we describe the situation for the day that the alert is posted in the trading section. In other words, if we are writing about a speculative position, it means that it is up-to-date on the day it was posted. We are also featuring the initial target prices to decide whether keeping a position on a given day is in tune with your approach (some moves are too small for medium-term traders, and some might appear too big for day-traders).
Additionally, you might want to read why our stop-loss orders are usually relatively far from the current price.
Please note that a full position doesn't mean using all of the capital for a given trade. You will find details on our thoughts on gold portfolio structuring in the Key Insights section on our website.
As a reminder - "initial target price" means exactly that - an "initial" one. It's not a price level at which we suggest closing positions. If this becomes the case (like it did in the previous trade), we will refer to these levels as levels of exit orders (exactly as we've done previously). Stop-loss levels, however, are naturally not "initial", but something that, in our opinion, might be entered as an order.
Since it is impossible to synchronize target prices and stop-loss levels for all the ETFs and ETNs with the main markets that we provide these levels for (gold, silver and mining stocks - the GDX ETF), the stop-loss levels and target prices for other ETNs and ETF (among other: UGL, GLL, AGQ, ZSL, NUGT, DUST, JNUG, JDST) are provided as supplementary, and not as "final". This means that if a stop-loss or a target level is reached for any of the "additional instruments" (GLL for instance), but not for the "main instrument" (gold in this case), we will view positions in both gold and GLL as still open and the stop-loss for GLL would have to be moved lower. On the other hand, if gold moves to a stop-loss level but GLL doesn't, then we will view both positions (in gold and GLL) as closed. In other words, since it's not possible to be 100% certain that each related instrument moves to a given level when the underlying instrument does, we can't provide levels that would be binding. The levels that we do provide are our best estimate of the levels that will correspond to the levels in the underlying assets, but it will be the underlying assets that one will need to focus on regarding the signs pointing to closing a given position or keeping it open. We might adjust the levels in the "additional instruments" without adjusting the levels in the "main instruments", which will simply mean that we have improved our estimation of these levels, not that we changed our outlook on the markets. We are already working on a tool that would update these levels daily for the most popular ETFs, ETNs and individual mining stocks.
Our preferred ways to invest in and to trade gold along with the reasoning can be found in the how to buy gold section. Furthermore, our preferred ETFs and ETNs can be found in our Gold & Silver ETF Ranking.
As a reminder, Gold & Silver Trading Alerts are posted before or on each trading day (we usually post them before the opening bell, but we don't promise doing that each day). If there's anything urgent, we will send you an additional small alert before posting the main one.
Thank you.
Przemyslaw Radomski, CFA
Founder, Editor-in-chief

