

Briefly: In our opinion, full (150% of the regular full position) speculative short positions in gold, silver and mining stocks are justified from the risk/reward perspective at the moment of publishing this alert.
Gold moved back and forth on Friday and the accompanying volume was high, but that’s not the only important thing that we can discuss today. The week is over and we have weekly changes and weekly volume levels to analyze and we saw major moves in the important ratios. Additionally, we discovered a self-similar pattern in gold that has critical and volatile implications going forward.
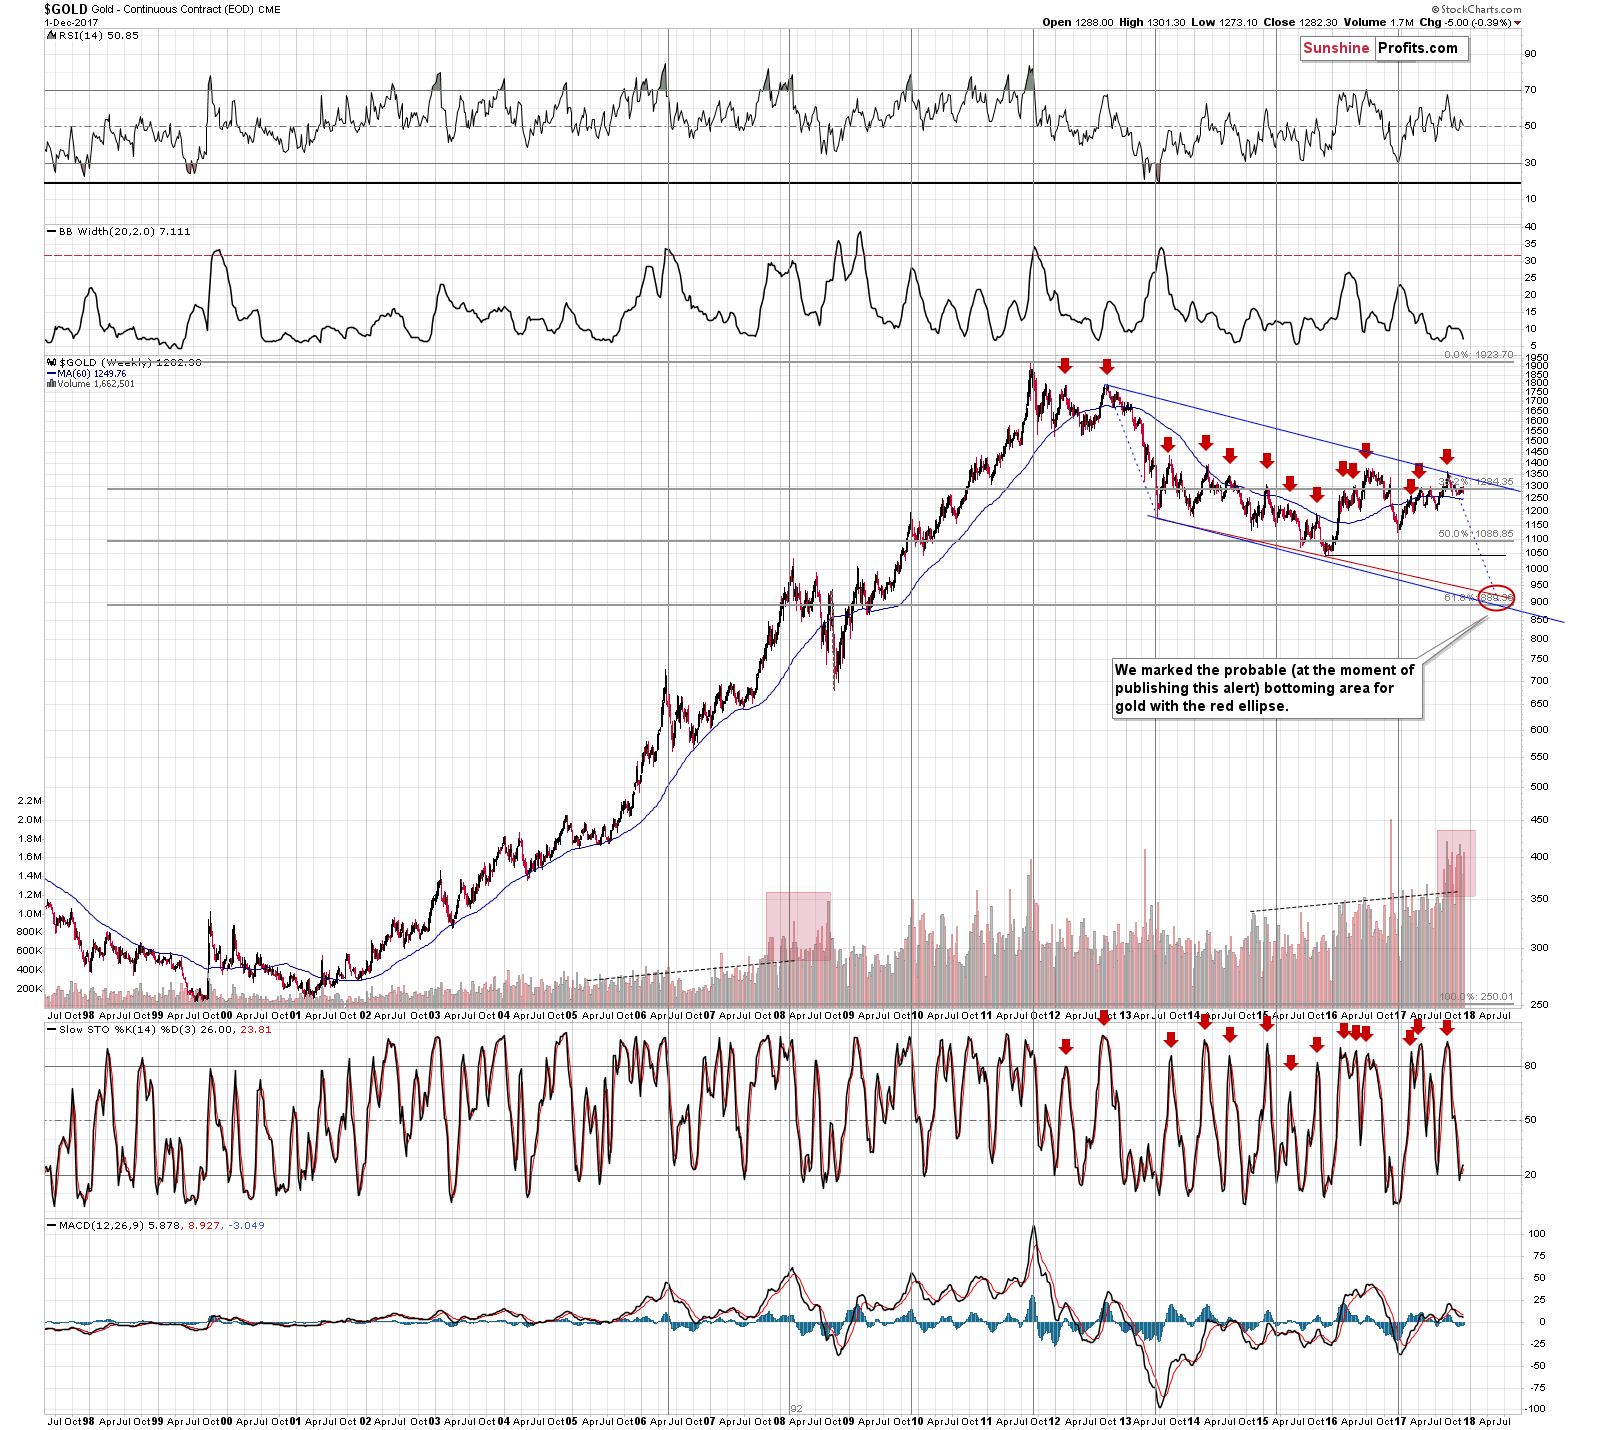
Let’s start with Friday’s session and the changes in the gold market (chart courtesy of http://stockcharts.com).
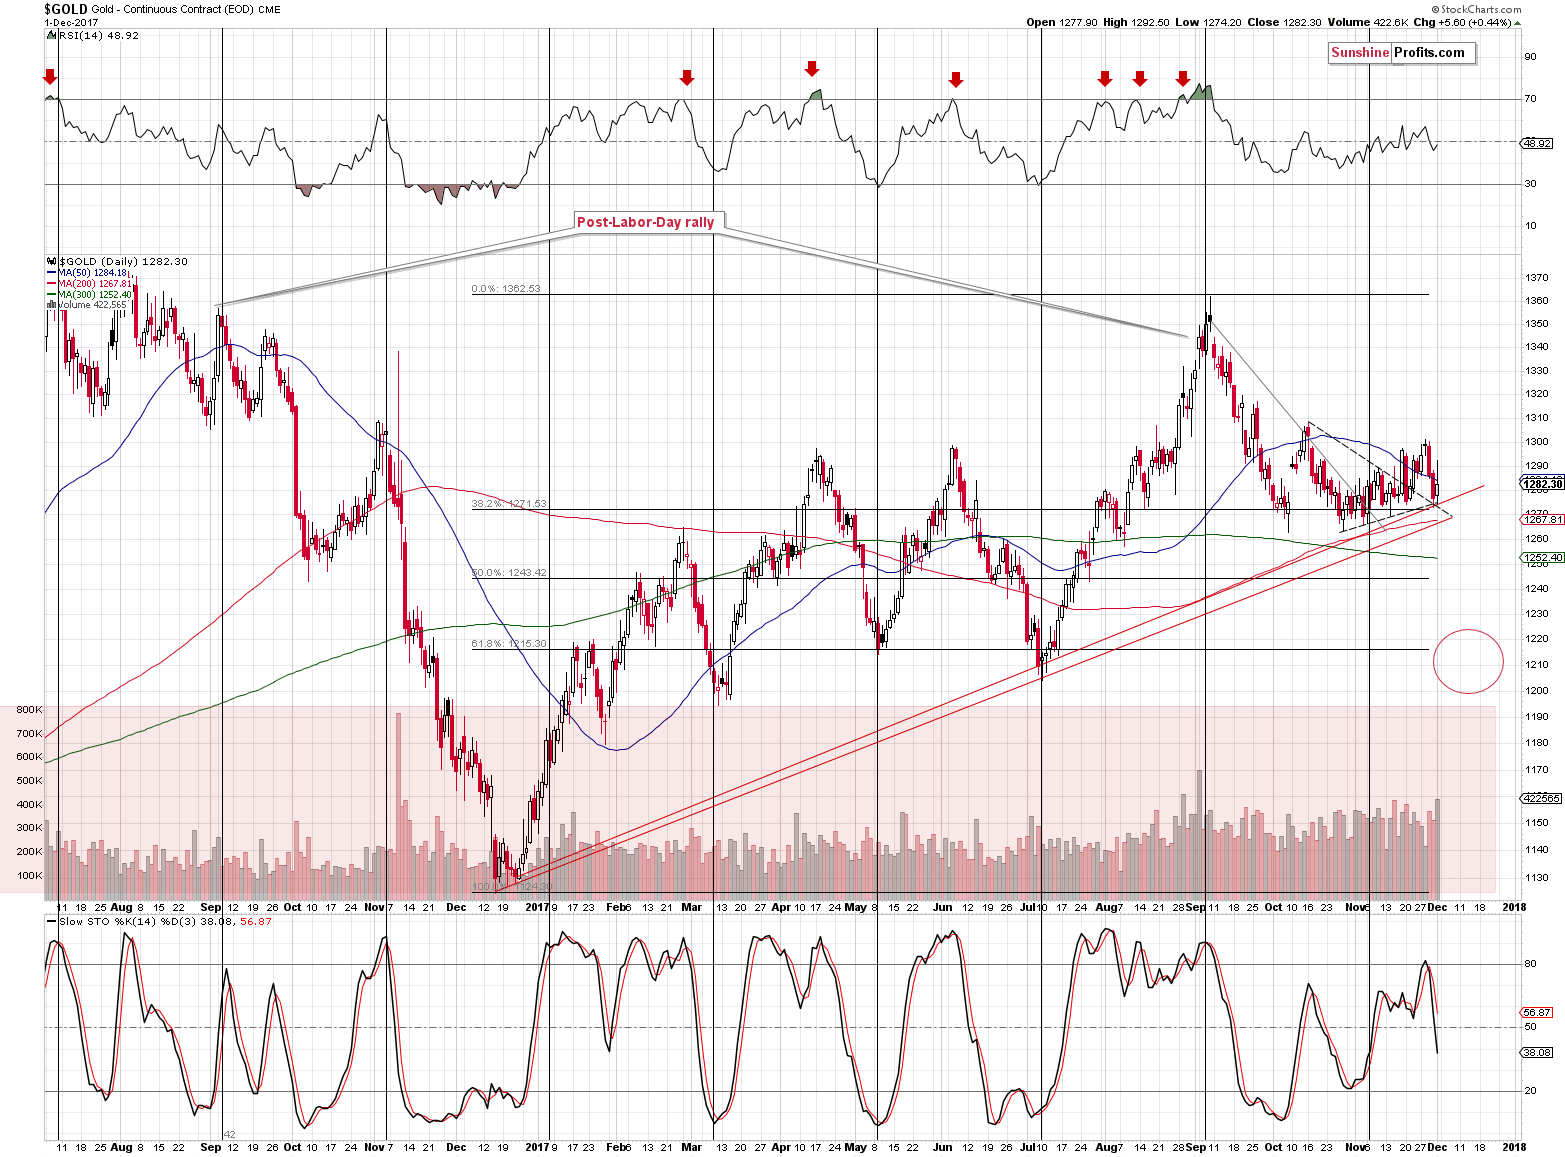
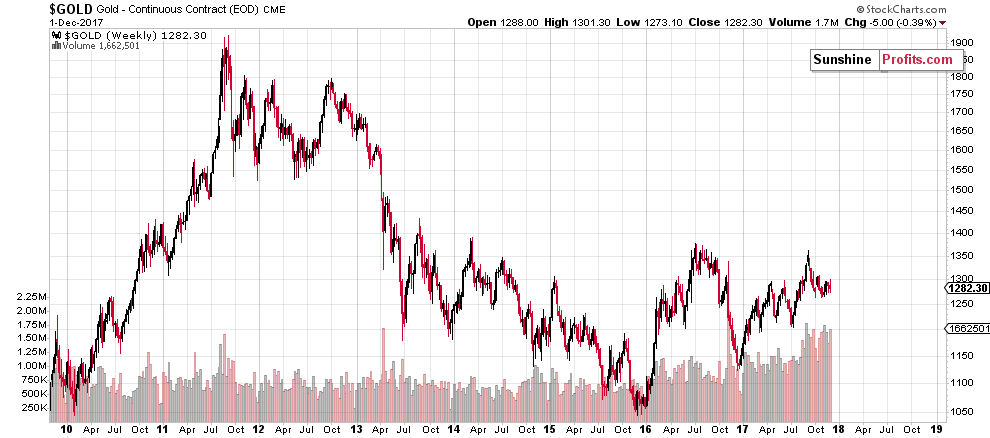
Gold moved sharply back and forth as both positive and negative data was released and ultimately it ended the session a few dollars higher (based on kitco’s prices, the closing price was $1,279.60). Why was the reaction so significant? The reason could be technical – the apex of the triangle was likely to be accompanied by a turnaround and since we just saw a more visible top a couple of days ago and apparently gold doesn’t want to form a bottom here, then the only remaining outcome is a local daily top that doesn’t change much – which is what we saw.
Why do we think that gold doesn’t want to bottom here? Because if it did, it would have ended Friday’s session much higher.
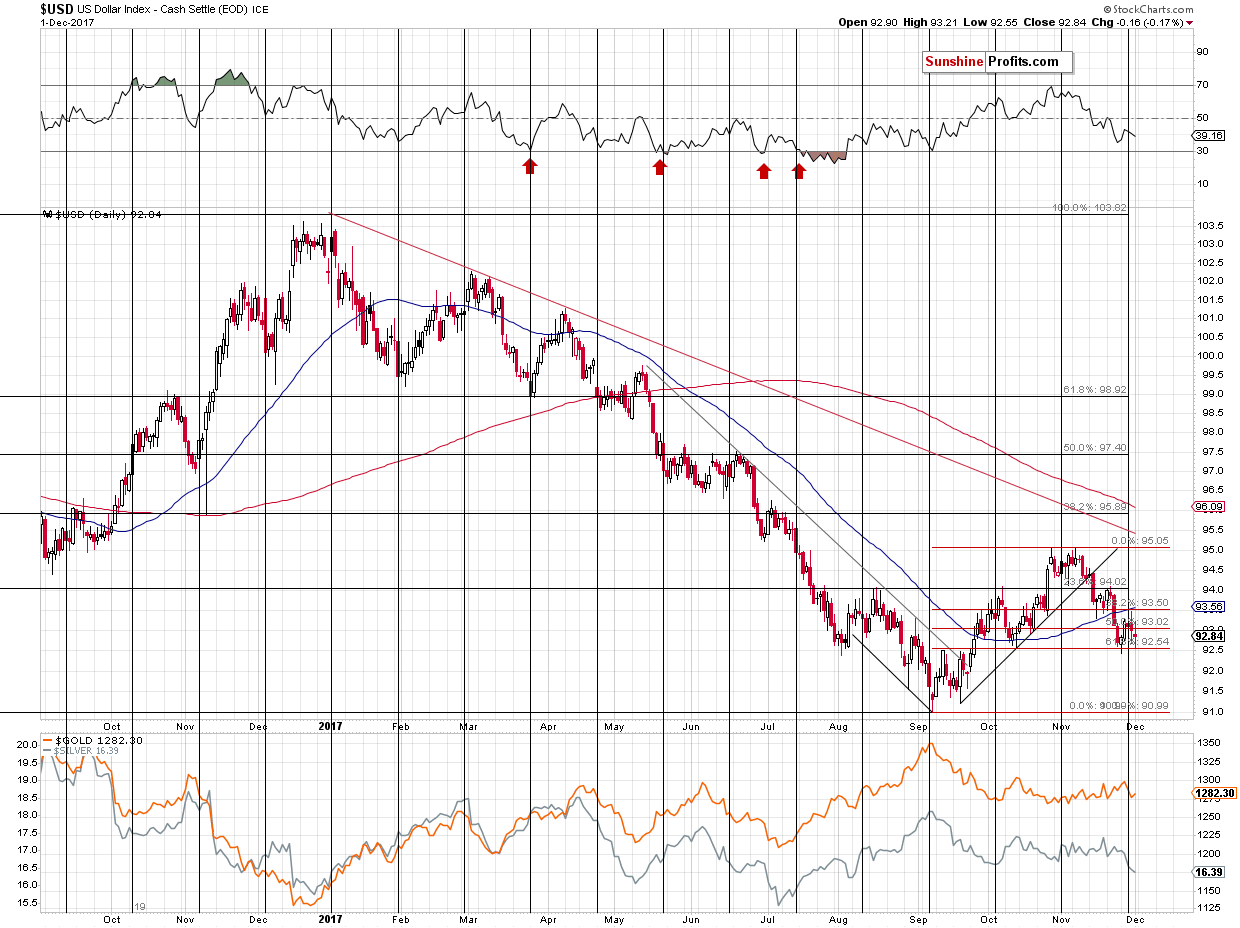
The USD Index moved lower, so gold had a good reason to close the session visibly higher, especially that it moved quite high on an intraday basis. Yet, it declined before the session was over and closed only insignificantly higher.
If gold doesn’t want to move higher, then silver must really hate that “thought”.
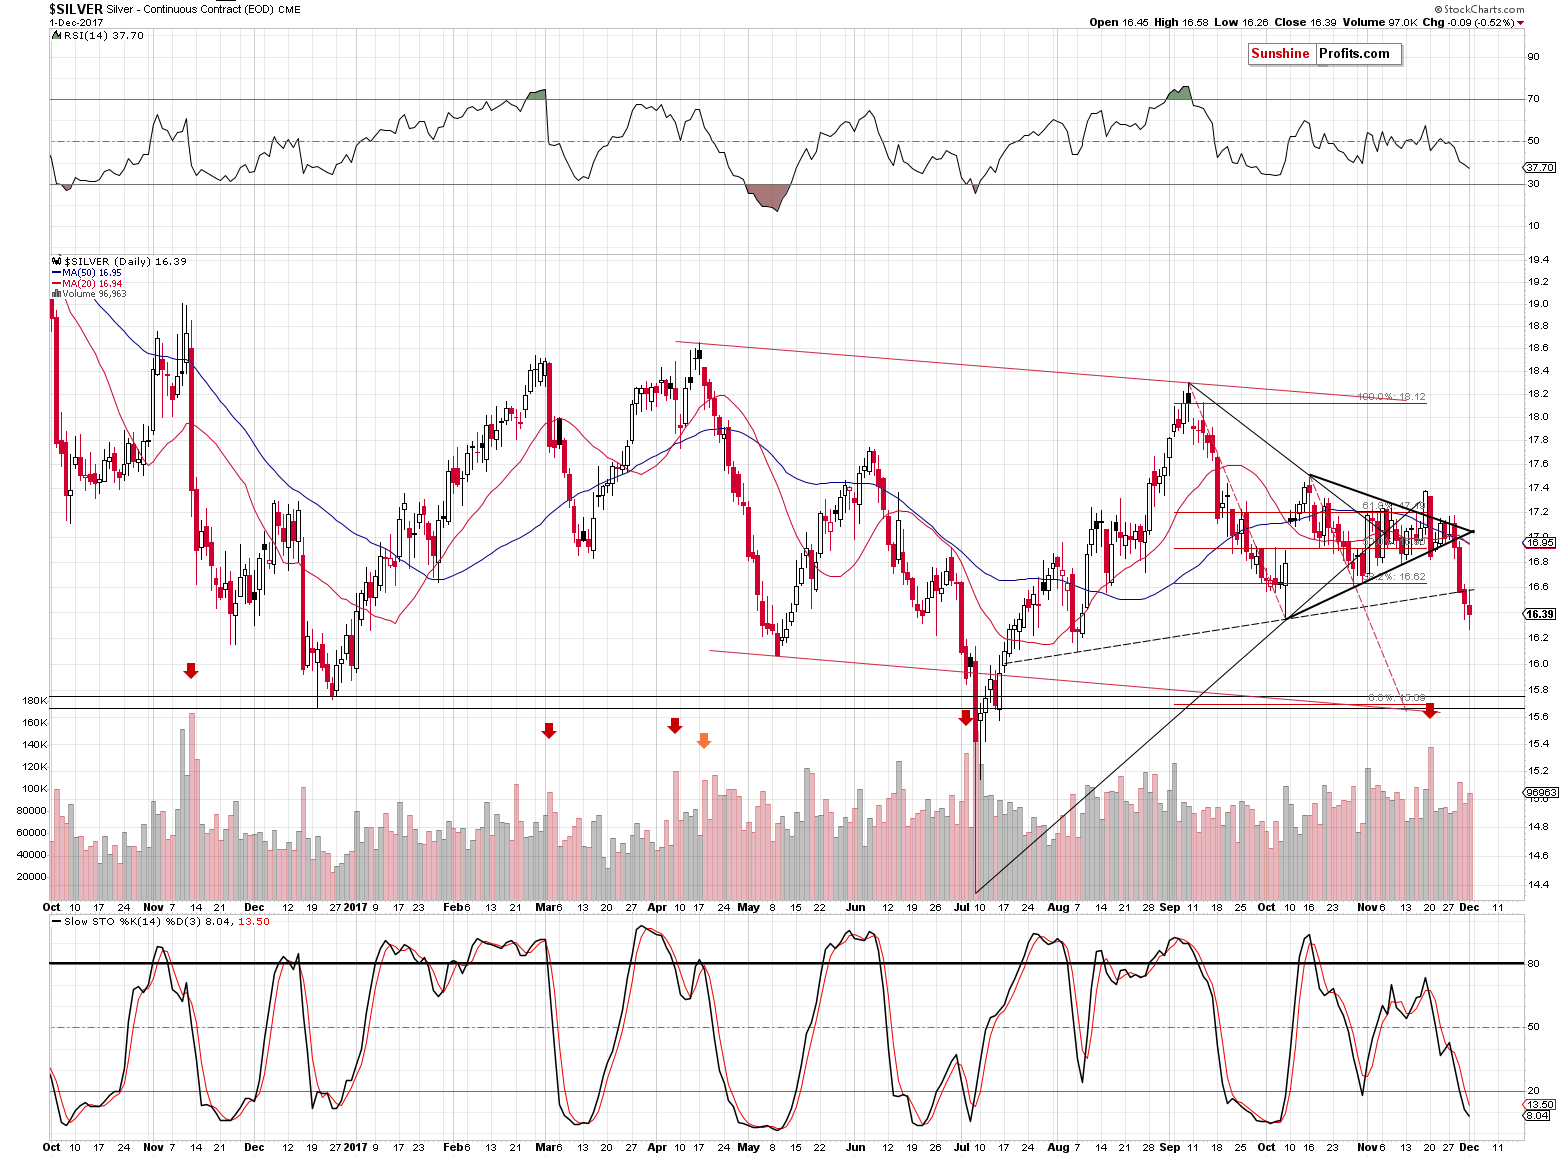
The white metal declined once again and even though gold closed a bit higher, it managed to close lower. The move lower by itself is already bearish as it took place on visible volume, but it’s very bearish once we take into account Thursday’s breakdown. We previously commented on it in the following way:
Silver declined and it reversed before the end of the session, which appears to be a reversal. But does this reversal really have bullish implications? It doesn’t seem to be the case. The volume wasn’t huge enough to confirm the reversal and it was not low enough to invalidate the bearish implications of the decline either.
The key thing to the proper analysis of the silver price swing is the awareness of what the USD and S&P 500 did. The former declined a bit, while stocks truly soared, which created perfect circumstances for a silver rally. Yet, instead of a rally, we saw a decline and a move below the rising support line based on the August and October lows. Consequently, silver’s action was very bearish as it showed great weakness in this market.
Moreover, the mentioned support line could be viewed as a neck level of a head and shoulders pattern (with a rather long right shoulder, similar to the one that we saw in the euro), which serves as an additional bearish indication (it’s only a small addition to the bearish implications of the breakdown as such, as its implications are bearish regardless of the H&S formation being in place or not).
On Friday, the general stock market declined significantly but almost the entire decline was reversed before the end of the session. If we consider Thursday and Friday together, the S&P 500 index still rallied considerably, but silver declined and was unable to invalidate its breakdown. The implications are strongly bearish.
Let’s move back to gold for a few minutes.
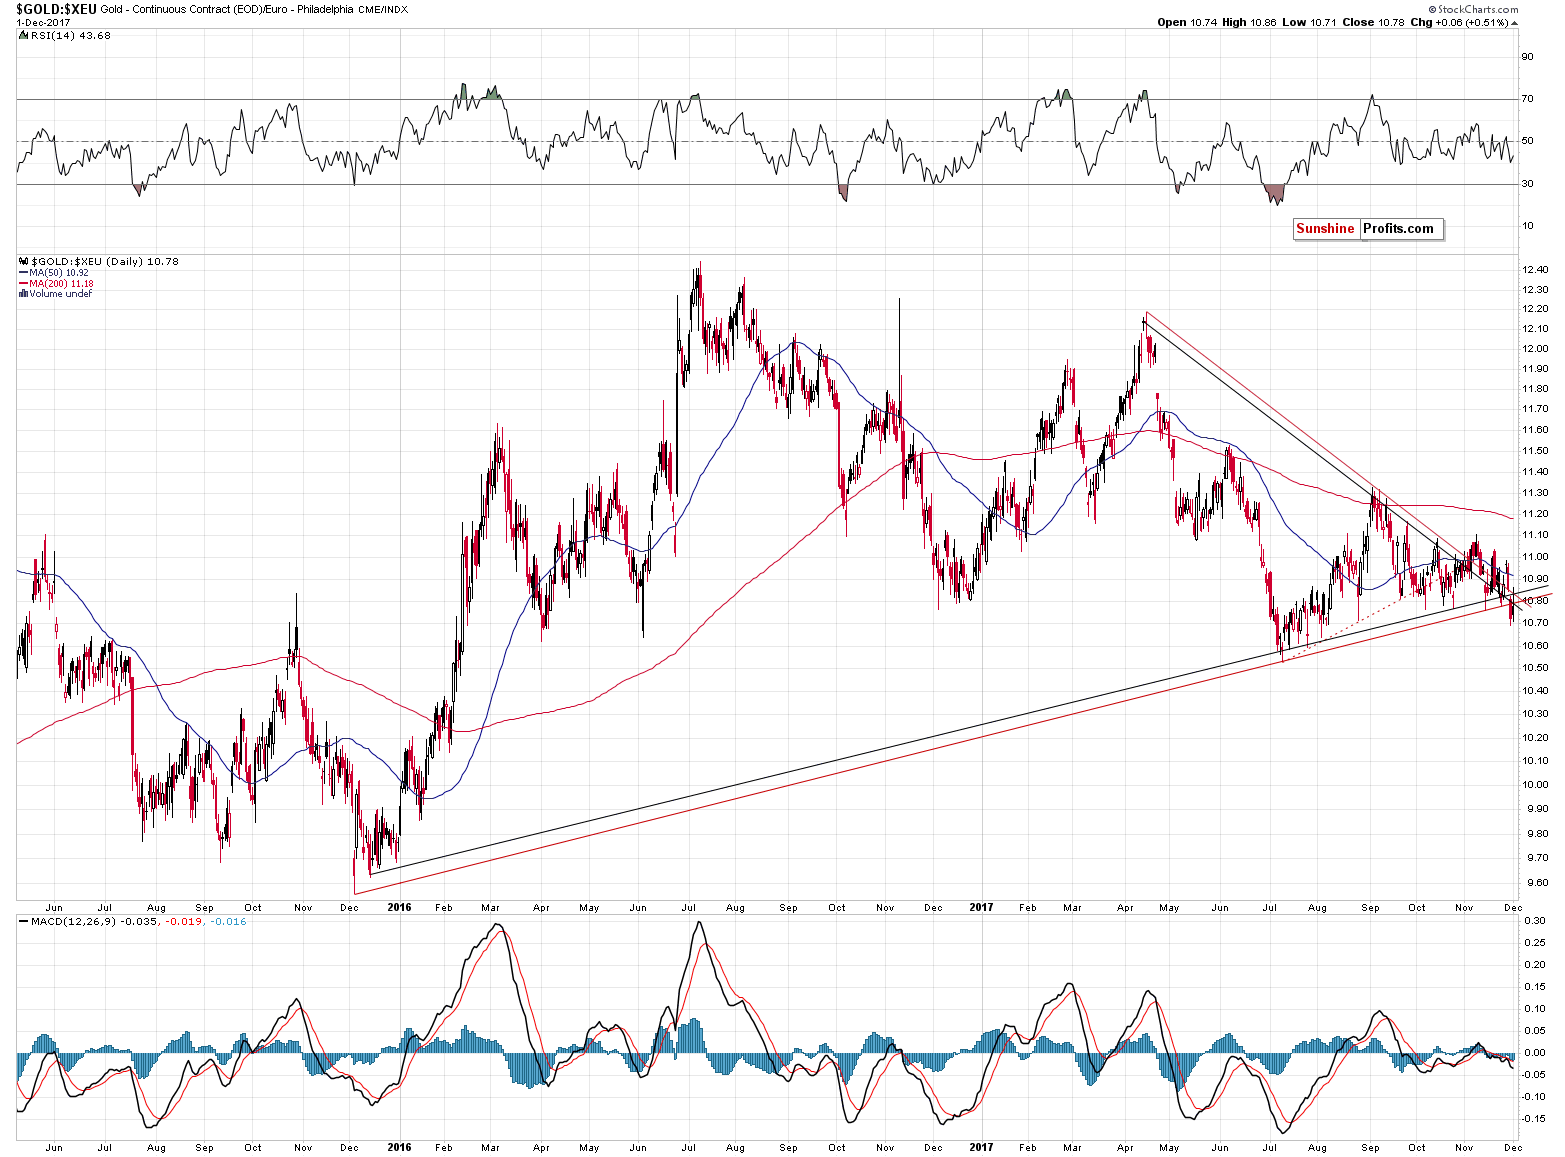
In Friday’s alert, we wrote the following regarding the above chart featuring gold priced in the euro:
In terms of the euro, the bearish signals are much more profound. Gold has just broken below the rising, medium-term support line and the most recent local top was formed approximately at the apex of the triangle pattern (in terms of time). The latter makes it considerably more likely that an important top was just formed and thus that the breakdown that we just saw will be confirmed.
As far as the apex of the triangle is concerned, it’s actually a combination of two such patterns – they are based on the same tops and bottoms, but in one case (red lines) they are based on the intraday extremes and in the other case (black lines) they are based on the daily closing prices. The most recent top took place right between the apexes created based on both patterns.
The mentioned breakdown is almost confirmed. Almost, because we would prefer to see three consecutive closing prices below the support line to see it as strong resistance, but we have already seen two of them, a weekly close and also a failed attempt to move back above the line. The breakdown is very close to being fully confirmed and the bearishness of the implications increased significantly based on Friday’s session.
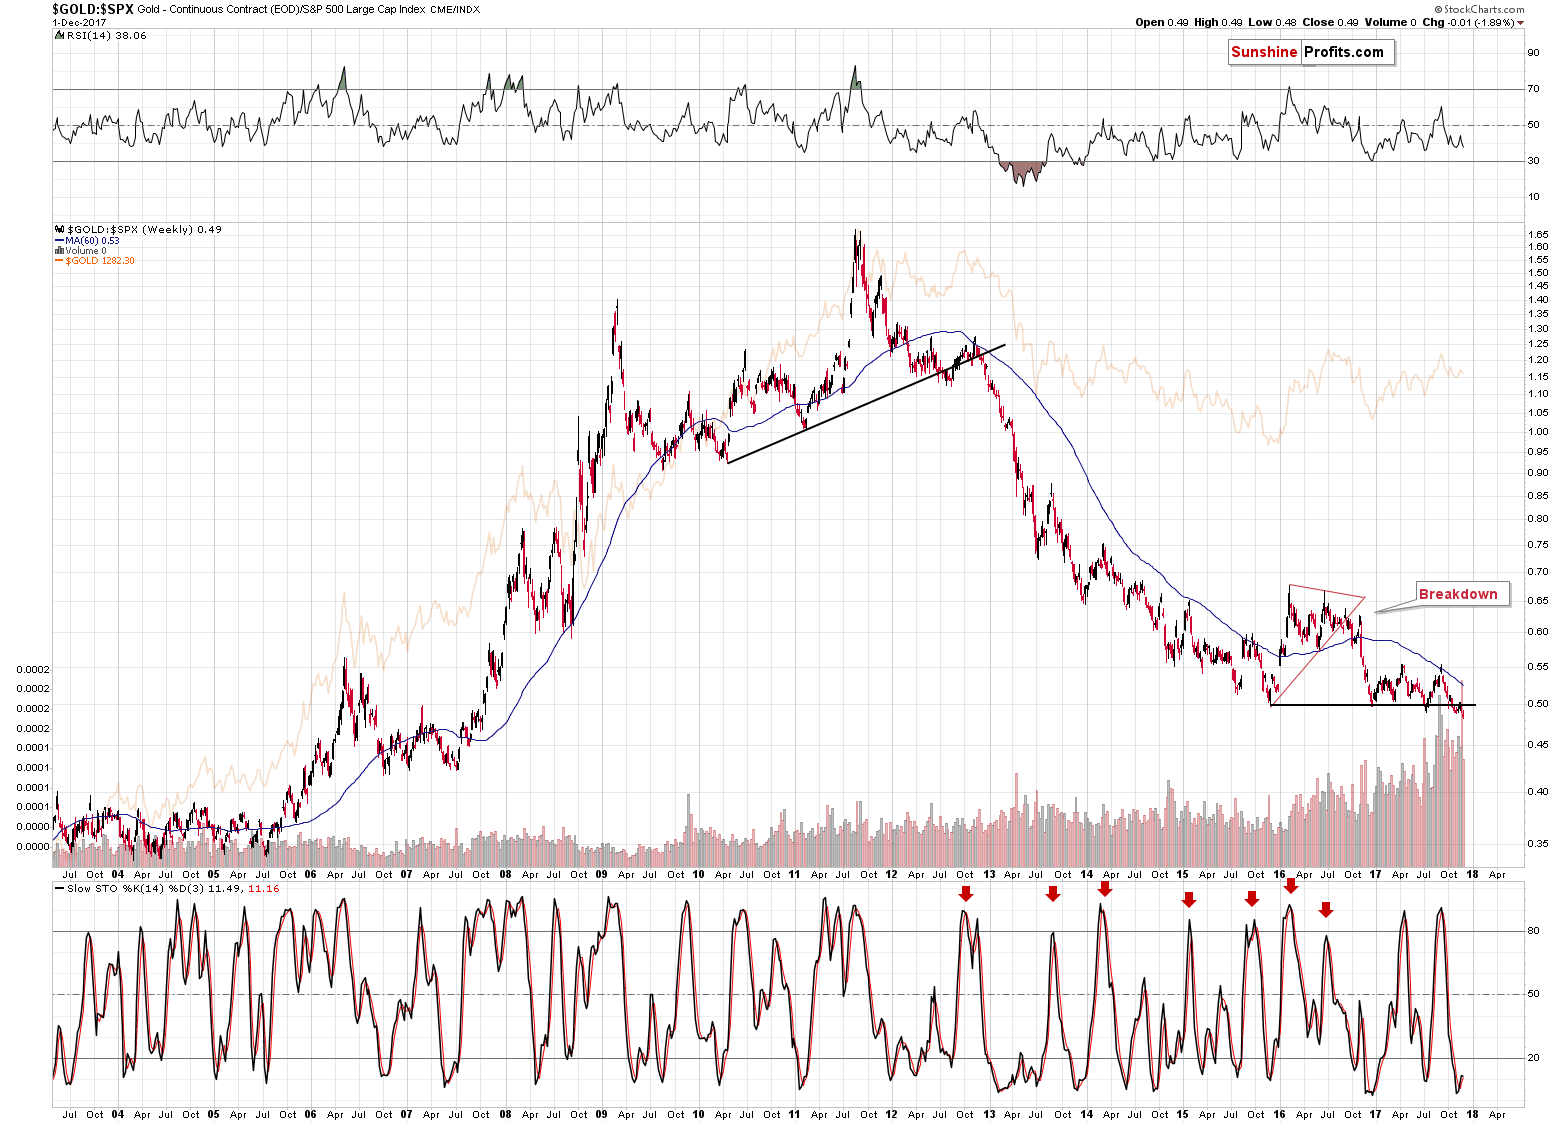
Speaking of breakdowns, we saw one in the gold to S&P 500 ratio, which… is nothing new, but still quite exciting and important. Why? Because due to several failed attempts to break below this level, we had to be skeptical toward the breakdown this time. The question was: ”Would this time be any different?” It turned out that this time was different as the ratio moved back to the previously broken level, verified it as support and then continued to move lower on huge volume (precisely, the ratio itself doesn’t have volume, so what we mean is the ratio of volumes).
Why would the above be a big deal? Because this ratio moves in tune with gold when it comes to major price moves and – more importantly – there was only one similar case in the past 15 years when we saw a similar breakdown and it was in the early stages of the 2012 – 2013 decline. Back then, it was a warning sign that practically nobody noticed. You’ll probably not see it anywhere (except for this publication) this time either.
Naturally, the implications are strongly bearish as the breakdown now appears believable.
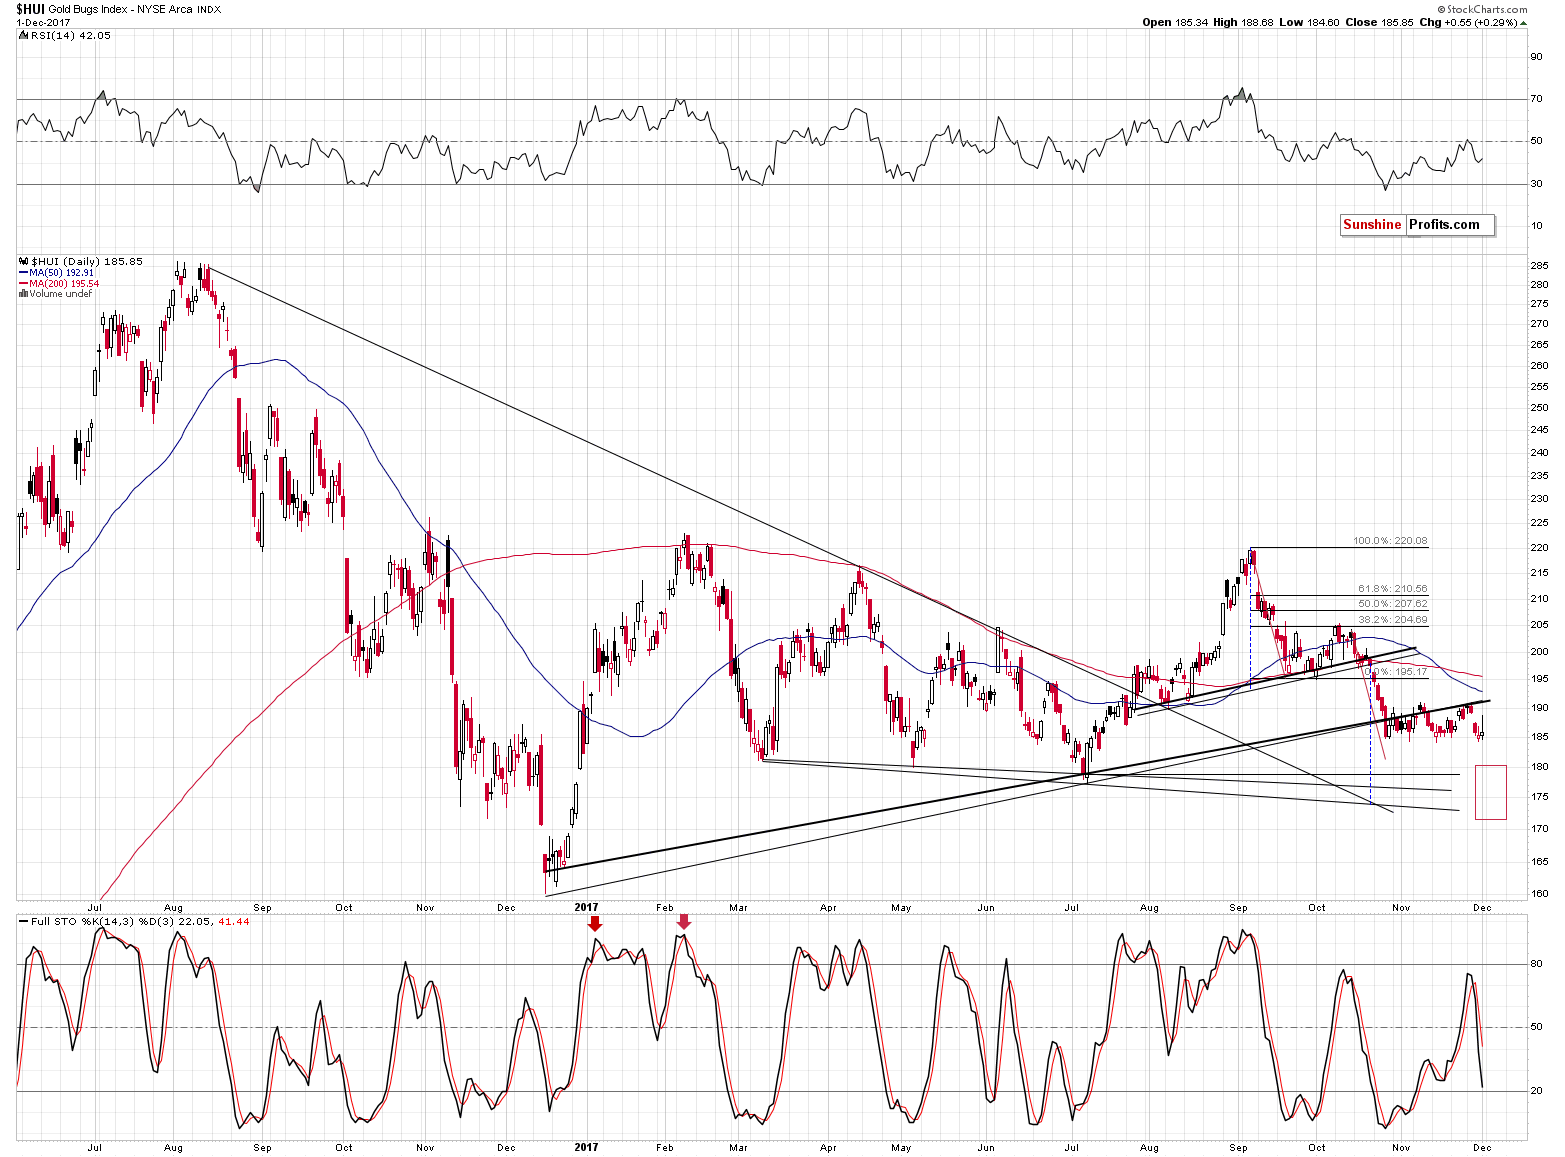
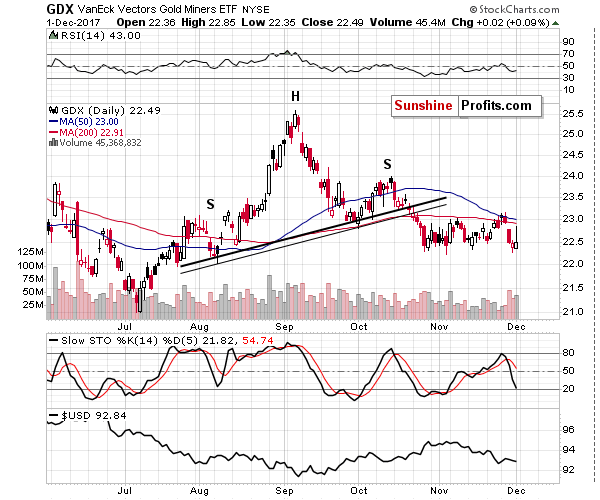
Mining stocks, just like gold moved back and forth and ended the session higher, however, the move was too tiny in terms of daily closing prices to be viewed as bullish. It’s more of a big-volume reversal and the implications thereof are bearish.
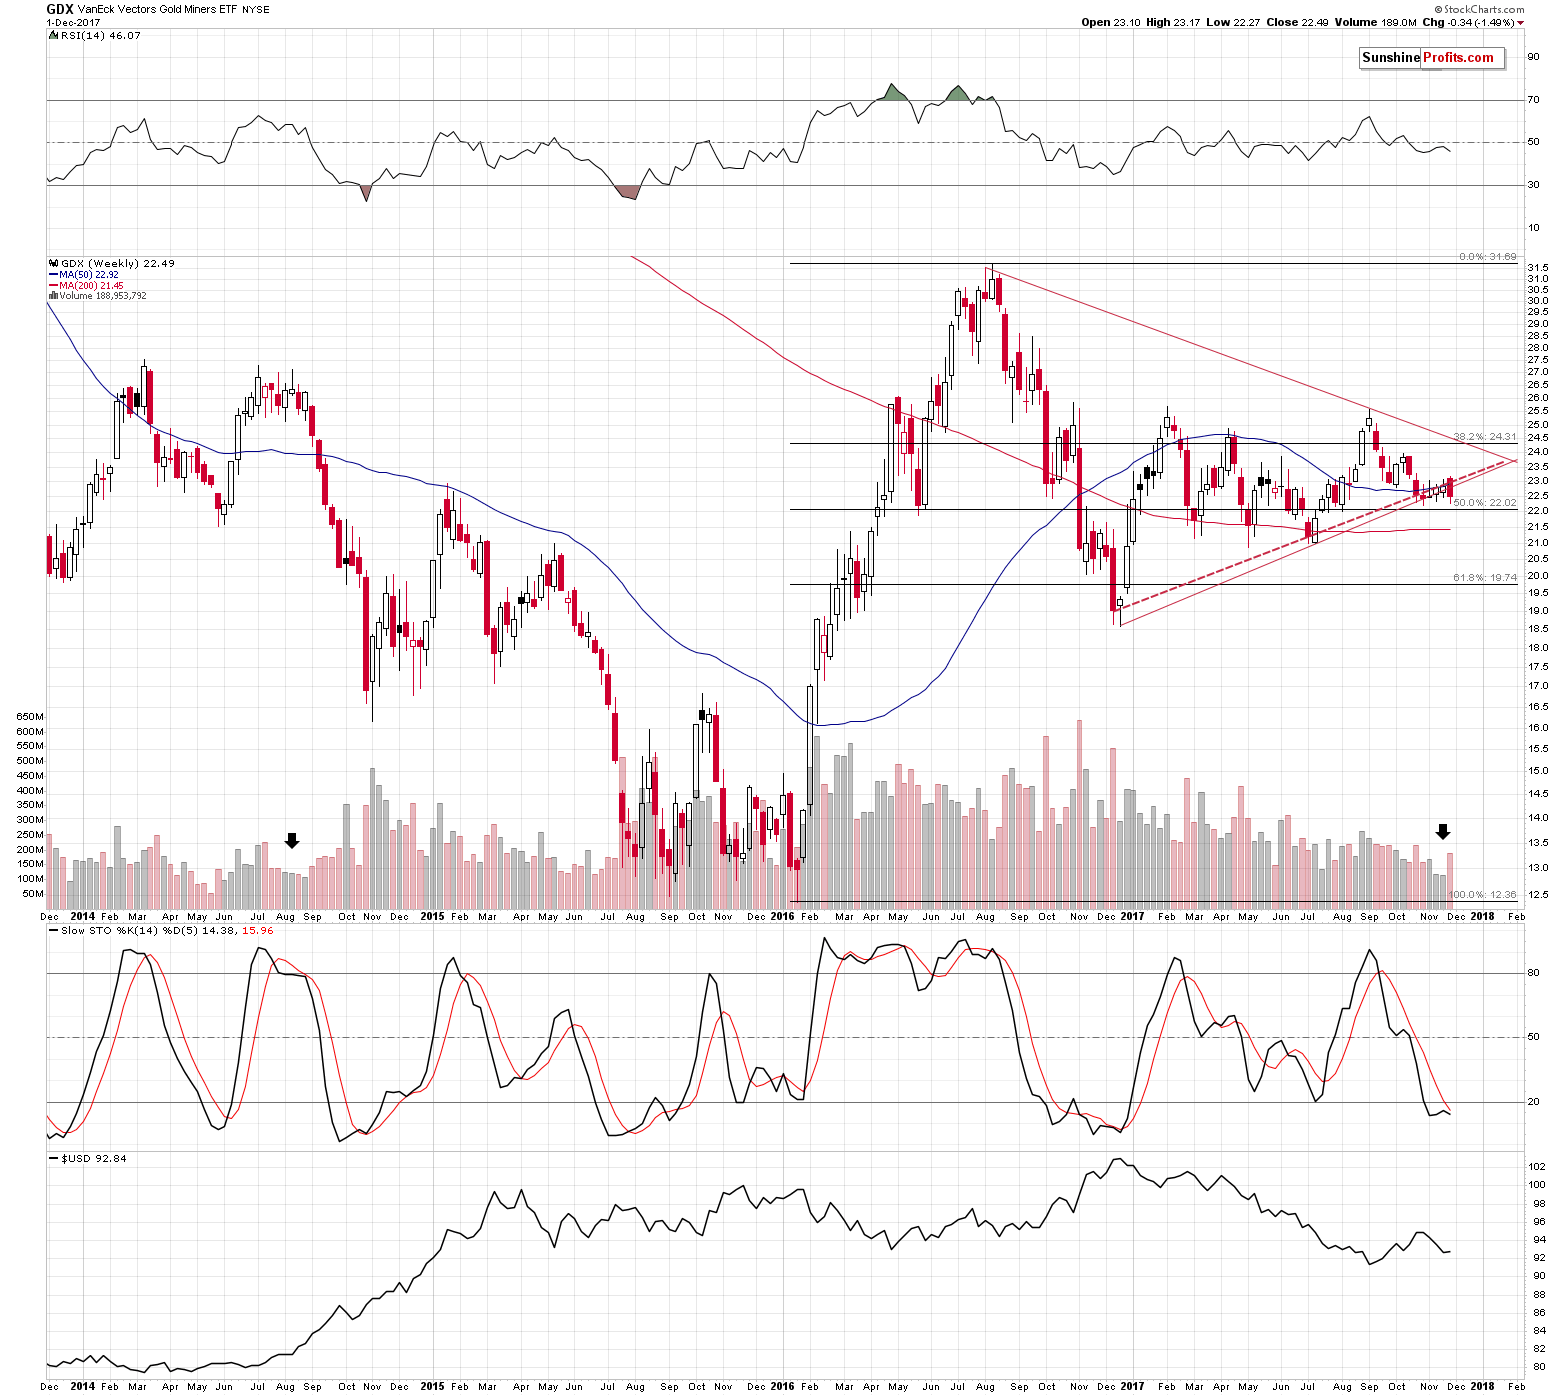
From the weekly point of view, we see that mining stocks declined and broke below the rising support lines based on the 2016 and 2017 lows and that the breakdown took place on big volume. All that happened after two weeks of low-volume upswings that we commented on in last Monday’s alert:
Finally, the weekly volume levels in the GDX ETF paint a very bearish picture for the following weeks. The GDX ETF is after 2 small, weekly rallies that were accompanied by very low volume when compared with the previous weeks. The last week had less trading days, but that doesn’t explain the previous week’s low volume reading. Moreover, we didn’t see similarly low volume readings in the past Novembers, which suggests that we are correct to view the low volume levels as something important and meaningful.
The only comparable situation from the recent past took place in mid-2014 (marked with a black arrow). In the following weeks, the GDX price was cut by a third.
The bearish implications of the above just became more bearish as back in 2014, the first big-volume weekly decline meant that the big slide had just begun.
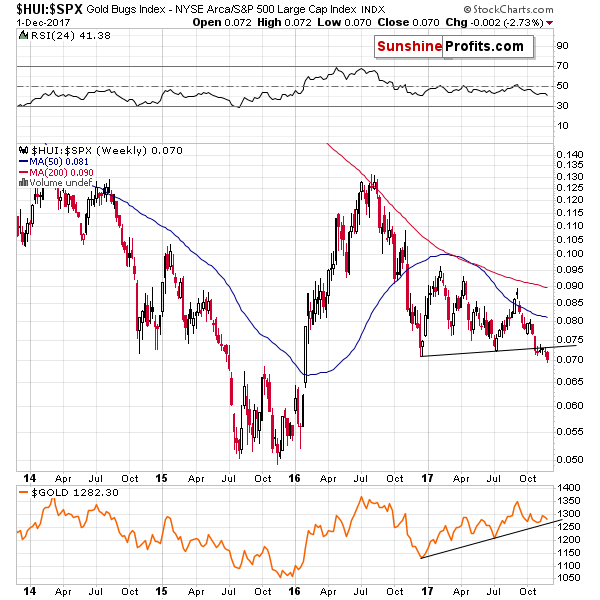
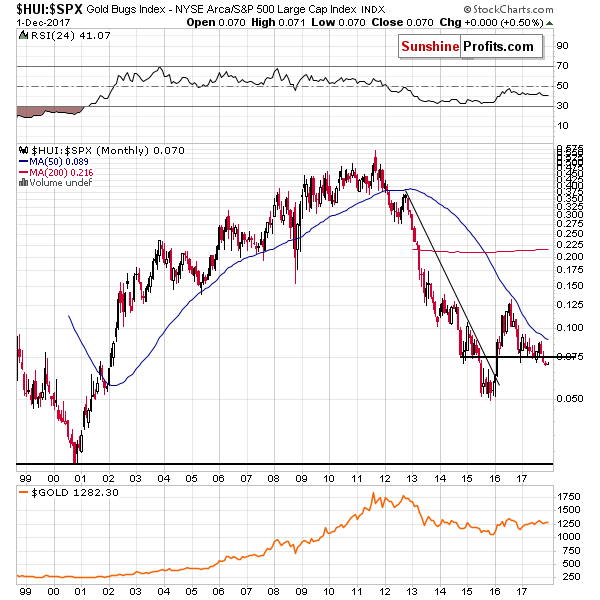
The breakdown can also be seen in the case of the HUI to S&P 500 index ratio. In other words, by looking at gold stocks’ performance relative to other stocks. The breakdown is clear and confirmed by both weekly and monthly closing prices. The implications are bearish.
All in all, the medium-term outlook is clearly bearish based on the above and based on the factors that we discussed previously and it seems that we’ve been correct to be holding the short positions in metals and miners (especially in silver and miners). Still, it seems that the vast majority of the potential that these positions have is still to be realized.
This is particularly the case given the similarities between what we’re seeing now and what we saw before the previous slides. We already discussed some of those similarities above, but there’s also something else that is likely in play right now.
In early October, we described the analogy in performance between 2008 and the current period (at the moment) in gold stocks. It was almost two months ago, so even if you read it at that time, it might be worth reading it once again today (by the way, we are making that alert available publicly, so if you know someone who’s interested in precious metals, but has doubts about using technical analysis to analyze it, please send them the link to that alert – they might change their minds - https://www.sunshineprofits.com/gold-silver/gold-trading/the-more-things-change-the-more-they-stay-the-same/) – it’s truly amazing how the similarity continued almost to the letter even though the two cases are almost a decade apart. Even the initial retracement of the HUI Index (38.2%) was identical.
However, today we are not going to repeat the October analysis – we are going to discuss something alike… in gold.
That’s right, the gold market features similarities to its performance back in 2008.
Before moving to details, let’s state that the analogy is far from perfect. That’s probably why we didn’t discover it earlier. However, it’s not the point to be picky about a technique, but rather to see if there is anything that it can give us and make us particularly aware of things that could come. With regard to the latter goal in mind, it seems that we have something very valuable.
In both cases, we have a sharp rally that preceded a top, then we saw some kind of consolidation and another attempt to move higher, which failed (mid-2008 and second half of 2012) and started a decline. The decline was more or less twice the size of the decline from the key (March 2008 and late 2011) top. In 2008, we saw a corrective upswing that was followed by a move to almost the final bottom and from mid-2013 to early 2015 we saw several such corrective upswings. After the initial bottom (September 2008 and the final part of 2015) gold soared sharply. The sizes of the upswings differ on a relative basis, but it’s understandable as back in 2008 the moves took place in a very short time, so the levels of emotionality among market participants were much higher.
After the sharp rally, gold consolidated a bit (late September 2008 and mid-2016), then declined and moved close to the previous highs once again (October 2008 and September 2017).
The decline that started thereafter in 2008 was the biggest and sharpest decline in many years. Naturally, this does not bode well for the near-term gold outlook. Conversely, it seems that we can expect the most important part of the decline to be just around the corner.
The above implication is not the only interesting thing about the analogy, though. The detail that could be important going forward is the moment when the decline took a breather. At this time, the moves take more time, so the pauses could be longer and more visible as well and if we get enough bullish confirmations once gold moves to certain price levels, we might even adjust the trading position temporarily.
In 2008, the first interim pause was at the most recent important low and the second pause was approximately the level from which the sharpest part of the previous huge rally started, which was strengthened by another support level (the previous low).
We don’t have price levels that would be 100% analogous, but we can see which levels are most similar. In our view, the most recent important lows would be close to the $1,200 level (March, May, and July 2017 bottoms) and the next strong support will be provided by the $1,120 - $1,130 area. That’s approximately from where gold soared most sharply in early 2016 and this level is strengthened by the December 2016 low.
These levels are most likely to generate support strong enough to trigger at least corrective rallies based on the analogy to what we saw in 2008 and based on their own strength as support. Naturally, that’s what appears likely based on the data that we have today and the likely scenario could change as new developments unfold.
There’s one more thing that we left for the analytical dessert. Namely, back in 2008 the previous key low (September 2008 low, which is analogous to the late 2015 bottom) didn’t trigger even a small rally. Consequently, even though a bottom or at least a correction will be widely expected once gold moves below $1,100, gold may continue to move lower and slide through $1,050 like a hot knife through butter.
Finally, there’s one more thing that makes the current situation in gold similar to 2008 – the overall increase in the volume levels. We already discussed, why the yearly volume levels at record highs should not be viewed as bullish (final part of the November 14 alert that we’re linking to) and today we would like to add the observation that back in 2008 the volume levels also broke to new highs and stayed there for a long time.
Yes, the volume has been growing almost constantly, but the 2008 and 2017 buildups in volume still stand out. The growth is much sharper than in other years and no other period is comparable to those years. Since the 2008 volume buildup was followed by a sharp decline in the precious metals sector, it seems that we might see something similar also this and/or the next year.
Summing up, there are multiple bearish signals in the gold market and in the rest of the precious metals sector and the analogies to previous major declines further support the bearish outlook. The big decline in PMs appears to be underway as the previously discussed long-term signals remain in place: gold’s huge monthly volume, the analogy in the HUI Index, the analogy between the two most recent series of interest rate hikes, and the RSI signal from gold priced in the Japanese yen.
To summarize:
Trading capital (supplementary part of the portfolio; our opinion): Short positions (150% of the full position) in gold, silver and mining stocks are justified from the risk/reward perspective with the following stop-loss orders and exit price levels / profit-take orders:
- Gold: exit price: $1,218; stop-loss: $1,366; exit price for the DGLD ETN: $51.98; stop-loss for the DGLD ETN $38.74
- Silver: exit price: $15.82; stop-loss: $19.22; exit price for the DSLV ETN: $28.88; stop-loss for the DSLV ETN $17.93
- Mining stocks (price levels for the GDX ETF): exit price: $21.23; stop-loss: $26.34; exit price for the DUST ETF: $29.97; stop-loss for the DUST ETF $21.37
In case one wants to bet on junior mining stocks' prices (we do not suggest doing so – we think senior mining stocks are more predictable in the case of short-term trades – if one wants to do it anyway, we provide the details), here are the stop-loss details and exit prices:
- GDXJ ETF: exit price: $30.28; stop-loss: $45.31
- JDST ETF: exit price: $66.27; stop-loss: $43.12
Long-term capital (core part of the portfolio; our opinion): No positions (in other words: cash)
Insurance capital (core part of the portfolio; our opinion): Full position
Important Details for New Subscribers
Whether you already subscribed or not, we encourage you to find out how to make the most of our alerts and read our replies to the most common alert-and-gold-trading-related-questions.
Please note that the in the trading section we describe the situation for the day that the alert is posted. In other words, it we are writing about a speculative position, it means that it is up-to-date on the day it was posted. We are also featuring the initial target prices, so that you can decide whether keeping a position on a given day is something that is in tune with your approach (some moves are too small for medium-term traders and some might appear too big for day-traders).
Plus, you might want to read why our stop-loss orders are usually relatively far from the current price.
Please note that a full position doesn’t mean using all of the capital for a given trade. You will find details on our thoughts on gold portfolio structuring in the Key Insights section on our website.
As a reminder – “initial target price” means exactly that – an “initial” one, it’s not a price level at which we suggest closing positions. If this becomes the case (like it did in the previous trade) we will refer to these levels as levels of exit orders (exactly as we’ve done previously). Stop-loss levels, however, are naturally not “initial”, but something that, in our opinion, might be entered as an order.
Since it is impossible to synchronize target prices and stop-loss levels for all the ETFs and ETNs with the main markets that we provide these levels for (gold, silver and mining stocks – the GDX ETF), the stop-loss levels and target prices for other ETNs and ETF (among other: UGLD, DGLD, USLV, DSLV, NUGT, DUST, JNUG, JDST) are provided as supplementary, and not as “final”. This means that if a stop-loss or a target level is reached for any of the “additional instruments” (DGLD for instance), but not for the “main instrument” (gold in this case), we will view positions in both gold and DGLD as still open and the stop-loss for DGLD would have to be moved lower. On the other hand, if gold moves to a stop-loss level but DGLD doesn’t, then we will view both positions (in gold and DGLD) as closed. In other words, since it’s not possible to be 100% certain that each related instrument moves to a given level when the underlying instrument does, we can’t provide levels that would be binding. The levels that we do provide are our best estimate of the levels that will correspond to the levels in the underlying assets, but it will be the underlying assets that one will need to focus on regarding the signs pointing to closing a given position or keeping it open. We might adjust the levels in the “additional instruments” without adjusting the levels in the “main instruments”, which will simply mean that we have improved our estimation of these levels, not that we changed our outlook on the markets. We are already working on a tool that would update these levels on a daily basis for the most popular ETFs, ETNs and individual mining stocks.
Our preferred ways to invest in and to trade gold along with the reasoning can be found in the how to buy gold section. Additionally, our preferred ETFs and ETNs can be found in our Gold & Silver ETF Ranking.
As a reminder, Gold & Silver Trading Alerts are posted before or on each trading day (we usually post them before the opening bell, but we don't promise doing that each day). If there's anything urgent, we will send you an additional small alert before posting the main one.
=====
Latest Free Trading Alerts:
On Wednesday, Trump nominated Goodfriend to the Fed’s Board of Governors. What does it mean for the gold market?
Goodfriend’s Nomination and Gold
S&P 500 index lost 0.2% on Friday, following volatile trading session and a bounce off support level at 2,600 mark. Is this a topping pattern or just another consolidation within medium-term uptrend?
Positive Expectations, But Will S&P 500 Continue Higher?
=====
Hand-picked precious-metals-related links:
PRECIOUS-Gold eases as dollar gains after U.S. Senate clears tax bill
Speculators raise net long positions in COMEX gold, copper: CFTC
Kitco News Gold Survey: Wall Street Flips To Bearish Outlook
=====
In other news:
Tax deal sends dollar surging, preps U.S. stocks for strong day
As Brokers Line Up to Offer Bitcoin Futures, Others Are Quiet
China says 2018 growth target to reflect new changes in economy
Bitcoin hits all-time high above $11,700 as recovery accelerates
Bitcoin: UK and EU plan crackdown amid crime and tax evasion fears
Enter the 'petro': Venezuela to launch oil-backed cryptocurrency
=====
Thank you.
Sincerely,
Przemyslaw Radomski, CFA
Founder, Editor-in-chief, Gold & Silver Fund Manager
Gold & Silver Trading Alerts
Forex Trading Alerts
Oil Investment Updates
Oil Trading Alerts

