

Briefly: In our opinion, full (150% of the regular full position) speculative short positions in gold, silver and mining stocks are justified from the risk/reward perspective at the moment of publishing this alert.
The August is over and we have the monthly closing prices as well as monthly volume levels. It turned out that the volume that we saw in August in gold was the highest reading… Ever. It wasn’t just a bit above the previous record reading – the difference is huge. Does this indicate something? Of course it does.
In today’s alert we’ll move away from the day-to-day price swings in order to discuss the latest long-term signals based on the monthly closing prices and volume levels – the implications appear very significant. Let’s move right to the gold chart (chart courtesy of http://stockcharts.com).
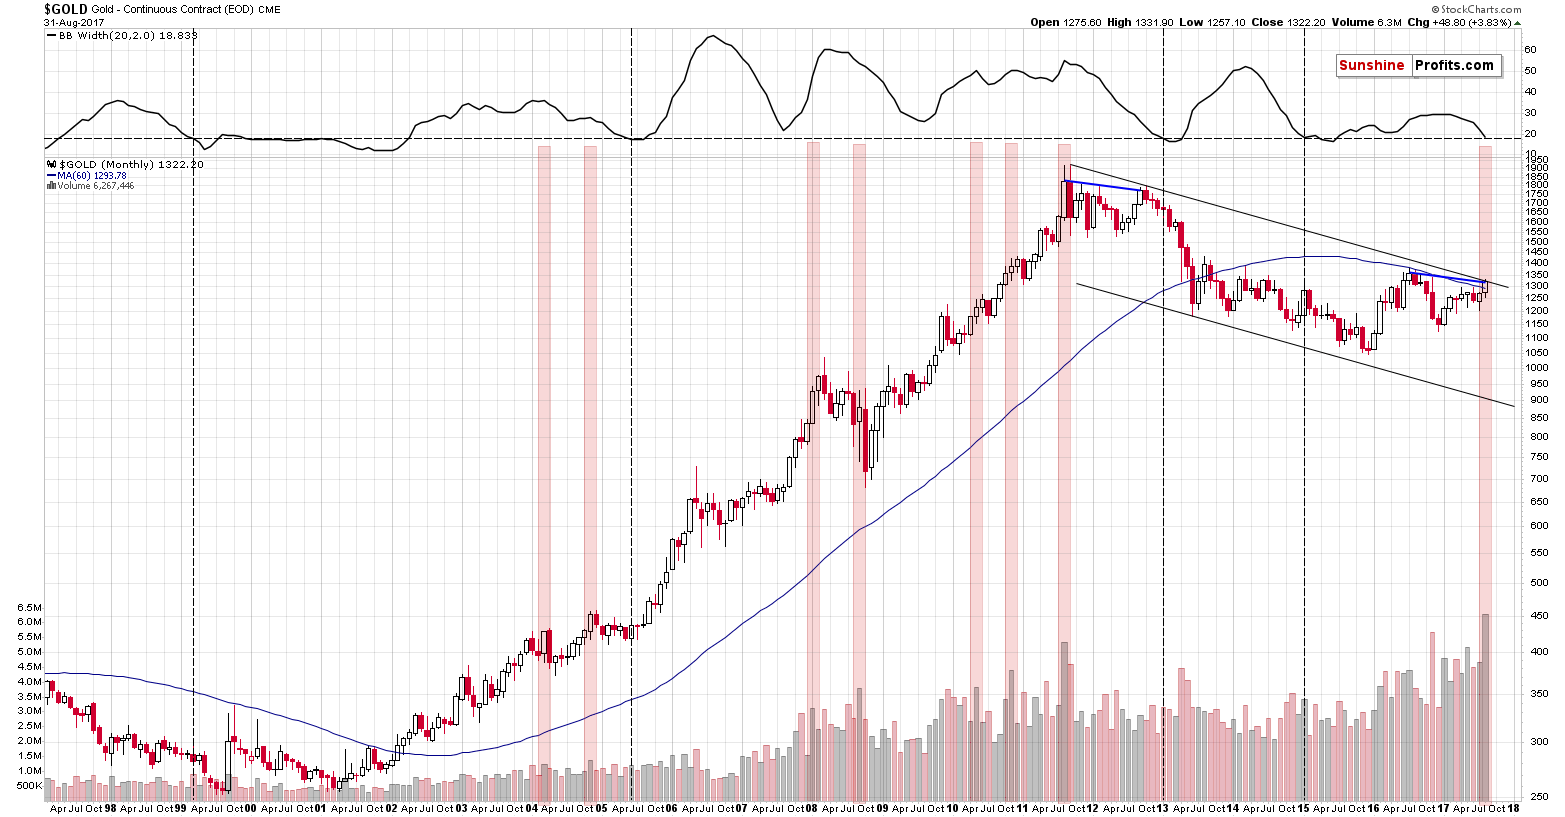
There are 2 important signals that we would like to discuss: the size of the monthly volume and the decline in the monthly volatility as measured by the Bollinger Band’s width (indicator in the upper part of the chart). There’s also one additional analogy that we’ll discuss later on. Let’s start with the former.
The August volume on which gold rallied in August was huge and it’s directly comparable to only one case from the past – the 2011 top. That’s the only case when gold’s monthly upswing was accompanied by volume that was similarly big. Since that was THE top, the implications here are naturally bearish.
However, there are more analogies that are also important. Considering other monthly volume readings, when gold moved higher on volume that was visibly bigger than the previous values, we get the same implication. We marked the similar cases with red rectangles. Two 2004 declines, the final part of the 2008 decline and – approximately – the 2008 top, the two 2010 corrective downswings, and finally the 2011 top were all accompanied by or preceded by huge monthly volume readings. In 3 cases (the 2008 top, both 2010 corrections) the signal was not precise as the decline started in 2 months not in the next month, but still, the efficiency of this signal in a strong bull market where gold rallied in the vast majority of months, is still remarkable.
The signal that we’re seeing right now is not a minor one – the volume was truly huge and thus the implications are not vague, but clearly bearish at this time.
The width of the Bollinger Bands – a proxy for gold's volatility – confirms the above, by strongly suggesting that a huge move is just around the corner. We added a horizontal line on the BB width chart to better compare its current value to the previous cases when it was seen after a downswing. We marked those cases with vertical dashed lines. There were 4 similar cases: in early 1999 (right before the final downswing of the previous bear market), in mid-2005 (before one of the biggest and sharpest rallies started), in early 2013 (before the biggest and sharpest decline started), and in early 2015 (when the most recent huge decline started). Most of the signals were followed by very important declines even though gold was moving higher for most of the past 2 decades - the implications are once again bearish.
Finally, there’s an interesting analogy between the 2011/2012 tops and the 2016/2017 tops. We marked the link between them with the blue lines. Actually, that’s only one line – between the 2011 and 2012 tops, which is then copied into the current situation. Surprisingly – it fits, which means that in case of the monthly closing prices, the 2017 rally could be just as significant as the 2012 rally. In other words, it could indicate that this year’s move is just a fake rally that’s here to fool the gold bulls, just like the 2012 rally did. Of course, it could be the case that the current rally is a beginning of a new long-term uptrend, but the signals – including the long-term ones - and the way the precious metals sector responded to USD’s decline in the past few months strongly suggest otherwise.
Summing up, in the summary of Tuesday’s alert, we wrote that if USD confirms the breakdown below its long-term support, the big slide in the precious metals market could be delayed once again, but we stated that for now, this didn’t appear to be the likely outcome – the reversal was. The breakdown below the intraday low was reversed almost immediately and the breakdown below the previous weekly lows is likely to be invalidated today. The odds are that the USD breakdowns will be completely invalidated before the week is over and this should serve as a strong signal indicating rallies in the following weeks. Exactly the opposite is likely for the precious metals market – the outlook for the latter is bearish and it appears that the big decline is already underway.
The above is confirmed by the long-term signals that we saw based on the final August prices and volume readings – the record monthly volume in gold suggests that a reversal is here or just around the corner.
As always, we will keep you – our subscribers – informed.
To summarize:
Trading capital (supplementary part of the portfolio; our opinion): Short positions (150% of the full position) in gold, silver and mining stocks are justified from the risk/reward perspective with the following stop-loss orders and initial target price levels / profit-take orders:
- Gold: initial target price level: $1,063; stop-loss: $1,346; initial target price for the DGLD ETN: $81.88; stop-loss for the DGLD ETN $39.94
- Silver: initial target price: $13.12; stop-loss: $19.22; initial target price for the DSLV ETN: $46.18; stop-loss for the DSLV ETN $17.93
- Mining stocks (price levels for the GDX ETF): initial target price: $9.34; stop-loss: $26.34; initial target price for the DUST ETF: $143.56; stop-loss for the DUST ETF $21.37
In case one wants to bet on junior mining stocks' prices (we do not suggest doing so – we think senior mining stocks are more predictable in the case of short-term trades – if one wants to do it anyway, we provide the details), here are the stop-loss details and initial target prices:
- GDXJ ETF: initial target price: $14.13; stop-loss: $45.31
- JDST ETF: initial target price: $417.04; stop-loss: $43.12
Long-term capital (core part of the portfolio; our opinion): No positions (in other words: cash)
Insurance capital (core part of the portfolio; our opinion): Full position
Important Details for New Subscribers
Whether you already subscribed or not, we encourage you to find out how to make the most of our alerts and read our replies to the most common alert-and-gold-trading-related-questions.
Please note that the in the trading section we describe the situation for the day that the alert is posted. In other words, it we are writing about a speculative position, it means that it is up-to-date on the day it was posted. We are also featuring the initial target prices, so that you can decide whether keeping a position on a given day is something that is in tune with your approach (some moves are too small for medium-term traders and some might appear too big for day-traders).
Plus, you might want to read why our stop-loss orders are usually relatively far from the current price.
Please note that a full position doesn’t mean using all of the capital for a given trade. You will find details on our thoughts on gold portfolio structuring in the Key Insights section on our website.
As a reminder – “initial target price” means exactly that – an “initial” one, it’s not a price level at which we suggest closing positions. If this becomes the case (like it did in the previous trade) we will refer to these levels as levels of exit orders (exactly as we’ve done previously). Stop-loss levels, however, are naturally not “initial”, but something that, in our opinion, might be entered as an order.
Since it is impossible to synchronize target prices and stop-loss levels for all the ETFs and ETNs with the main markets that we provide these levels for (gold, silver and mining stocks – the GDX ETF), the stop-loss levels and target prices for other ETNs and ETF (among other: UGLD, DGLD, USLV, DSLV, NUGT, DUST, JNUG, JDST) are provided as supplementary, and not as “final”. This means that if a stop-loss or a target level is reached for any of the “additional instruments” (DGLD for instance), but not for the “main instrument” (gold in this case), we will view positions in both gold and DGLD as still open and the stop-loss for DGLD would have to be moved lower. On the other hand, if gold moves to a stop-loss level but DGLD doesn’t, then we will view both positions (in gold and DGLD) as closed. In other words, since it’s not possible to be 100% certain that each related instrument moves to a given level when the underlying instrument does, we can’t provide levels that would be binding. The levels that we do provide are our best estimate of the levels that will correspond to the levels in the underlying assets, but it will be the underlying assets that one will need to focus on regarding the signs pointing to closing a given position or keeping it open. We might adjust the levels in the “additional instruments” without adjusting the levels in the “main instruments”, which will simply mean that we have improved our estimation of these levels, not that we changed our outlook on the markets. We are already working on a tool that would update these levels on a daily basis for the most popular ETFs, ETNs and individual mining stocks.
Our preferred ways to invest in and to trade gold along with the reasoning can be found in the how to buy gold section. Additionally, our preferred ETFs and ETNs can be found in our Gold & Silver ETF Ranking.
As a reminder, Gold & Silver Trading Alerts are posted before or on each trading day (we usually post them before the opening bell, but we don't promise doing that each day). If there's anything urgent, we will send you an additional small alert before posting the main one.
=====
Latest Free Trading Alerts:
S&P 500 index gained 0.5% on Wednesday, as it continued its short-term uptrend. Is this another leg of a bull market or just move up within few-week-long consolidation? Is holding medium-term short position still justified?
New Record Highs Ahead Or Just Bounce? S&P 500 Above 2,450 Mark
=====
Hand-picked precious-metals-related links:
PRECIOUS-Gold edges lower on profit-taking before U.S. jobs data
=====
In other news:
Stocks, dollar advance ahead of U.S. jobs data
U.S. job growth likely slowed in August; wages seen tepid
Raising euro zone inflation more difficult - ECB's Constancio
Greece hopes for debt relief as bailout program enters final 12 months
Junk Bonds Face Wave of Supply Just as Investors Sour on Market
=====
Thank you.
Sincerely,
Przemyslaw Radomski, CFA
Founder, Editor-in-chief, Gold & Silver Fund Manager
Gold & Silver Trading Alerts
Forex Trading Alerts
Oil Investment Updates
Oil Trading Alerts

