

Briefly: In our opinion, full (150% of the regular full position) speculative short positions in gold, silver and mining stocks are justified from the risk/reward perspective at the moment of publishing this alert.
The previous week, especially its final part, was quite rich in developments in the case of the currency market. The USD Index took a dive and we saw some strength in the precious metals market as well. How much changed? Is the USD just starting another major move lower and what would that mean for gold and silver investors?
If the USD Index was indeed likely to decline substantially and for a long time, then the outlook would be quite bullish for the precious metals market. If, however, the USD’s downswing was in tune with the previous corrective downswings and at the same time the precious metals’ reaction to the decline indicated weakness in the latter, then the implications would continue to be very bearish for the PMs. It seems that the latter is the case.
Let’s start today’s alert by recalling what we wrote last week about the USD’s corrections (chart courtesy of http://stockcharts.com).
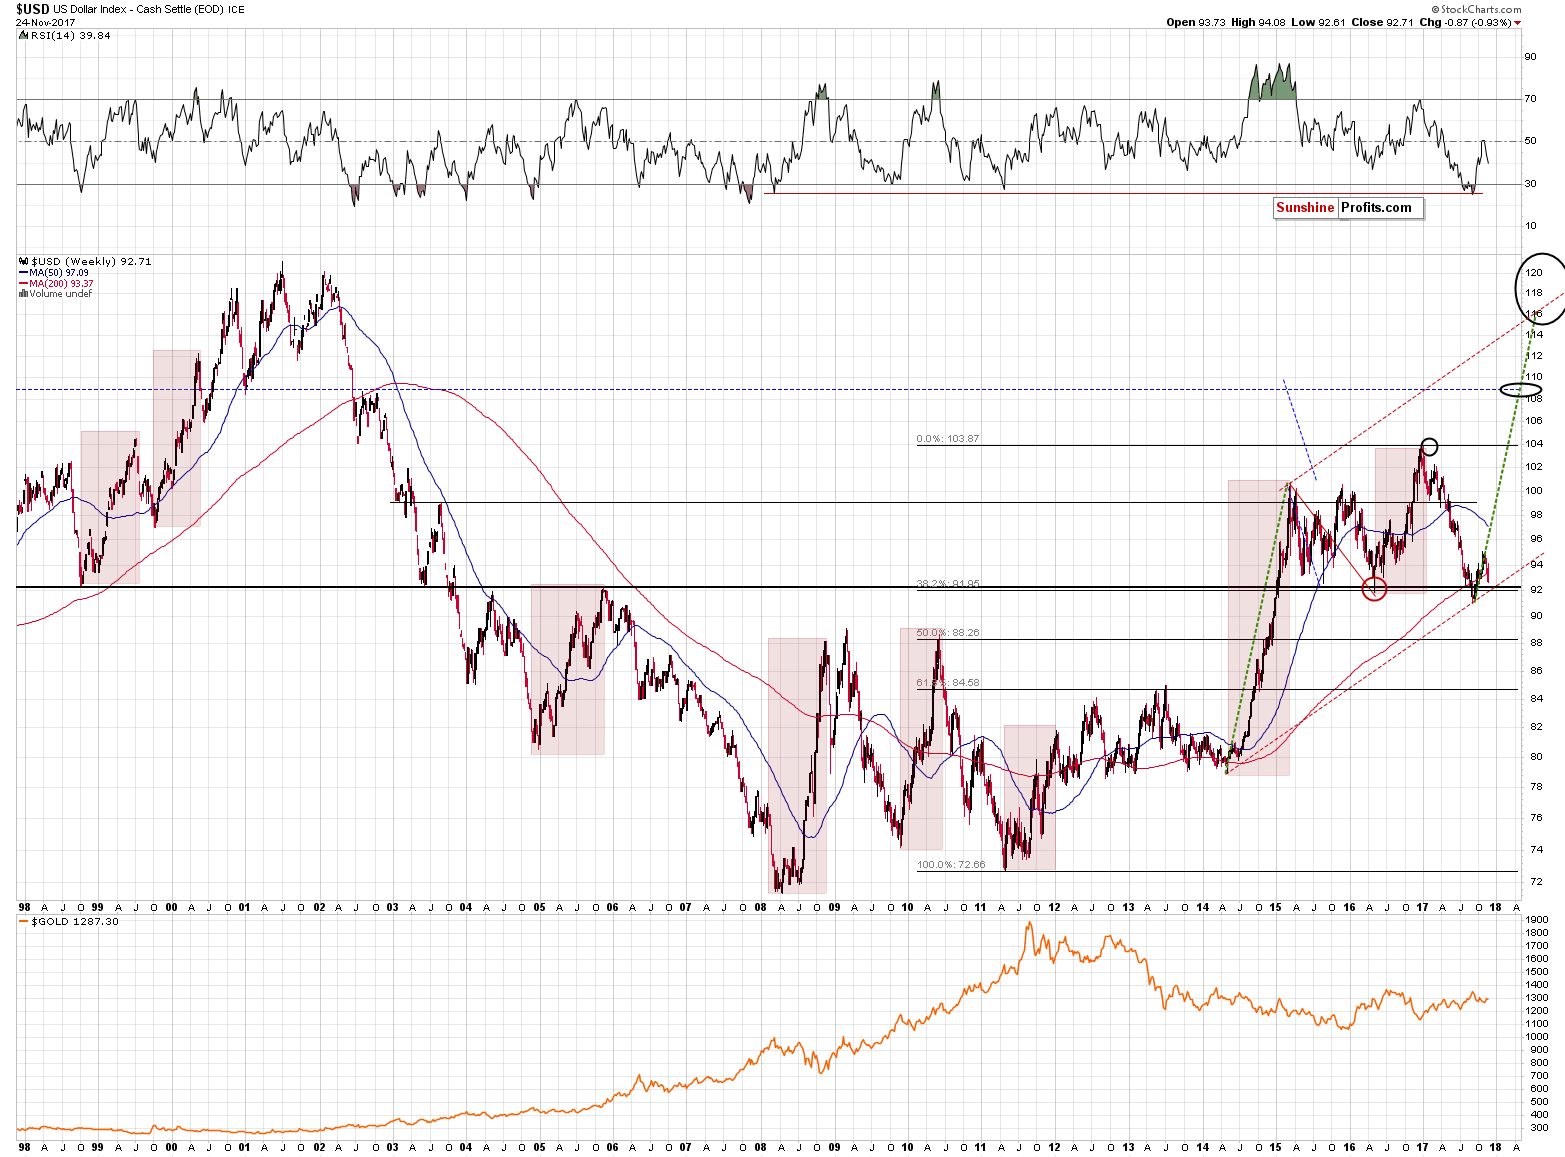
In light of the recent developments (namely, another week of lower prices instead of a rally toward the target area) we decided to take a closer look at the analogy to the previous major bottoms and the early parts of major rallies. It is often said that time is more important than price and we analyzed the previous upswings and the early corrections with the above in mind. Namely, we checked how long the initial rallies lasted and how long the USD was correcting. You will find the details below:
- 1998 – 1999: the initial rally: 6 weeks, followed by 2 weeks of declines
- 1999 - 2000 the initial rally: 7 weeks, followed by 5 weeks of declines
- 2005 - the initial rally: 6 weeks, followed by 4 weeks of declines
- 2008 - the initial rally: 7 weeks, followed by 5 weeks of declines
- 2009 – 2010 - the initial rally: 4 weeks, followed by 3 weeks of declines
- 2011 - the initial rally: 10 weeks, followed by 2-5 (unclear) weeks of declines
- 2014 - 2015 - the initial rally: 4 weeks, followed by 4 weeks of declines
- 2016 - the initial rally: 4 weeks, followed by 3 weeks of declines
- 2017 (current upswing) - the initial rally: 7? weeks, followed by 3? weeks of declines
The initial rallies lasted between 4 and 10 weeks with the 10 number being the outlier. The average is 6, while the most recent rally either took 7 weeks (quite in tune with the past patterns) or it’s not over yet with 10 weeks so far. If it’s not over, then it would need to rally for an additional week or two, thus making the entire rally even longer than the previous outlier at 11 or 12 weeks (or longer).
Is it therefore possible that the rally will still continue before a bigger correction is seen? Yes. Is it likely - no. Based on the above time analogies it’s more likely that the initial rally is already over and we are after 3 weeks of declines.
Is the above good or bad? Both. It’s good, because we’re likely closer to the big decline in the precious metals market than it first appeared, but it’s bad because we may not get a meaningful and tradable corrective upswing in the precious metals sector after the USD Index moves close to the 96 level. Ultimately, it’s not really a matter of deciding whether the current environment is better or worse, but adapting to it and tweaking the strategy so that it remains up-to-date with the most recent observations. After all, trading is like a game of poker - at times you will get a good hand and at times you will get a back hand, but by having a good strategy toward both situations you’ll likely come out ahead over time.
So, what’s the likely follow-up action from here? If we are indeed after 3 weeks of declines, then if we can estimate how long the rally is likely to last, we could check how long it should take, additionally, for the USD to bottom.
The average length of the correction is between 3.5 and 3.875 weeks depending on the interpretation of the 2011 action. We are already after 3 weeks and when you are reading this (we’re writing this over the weekend), we will already be in the fourth week.
What if instead of using the average, we take into account the most similar cases - where the initial rallies took 6 or 7 weeks. In this case we get an average of 4 weeks (based on 2, 5, 4, and 5 weeks). 5 weeks is the most common analogy (half of the cases), though.
Finally, what if we assume that the most recent rally (2016) is most likely to be repeated as it’s most similar fundamental-wise? In this case, we should expect the decline to take 3 weeks. In other words, it could be over.
All in all, if we average the above approaches, it seems that this week we are likely to see the bottom in the USD, but next week is also quite possible. There’s also a good change that the bottom was just formed.
In other words, the decline that we saw last week was not something out-of-the-box. Conversely, it was in tune with the past price patterns that characterized the early parts of the biggest multi-month upswings in the USD. In light of the above, there’s no reason to view the above as something bearish for the following weeks as far as the USD Index is concerned.
Now, we are after 4 weeks of declines in the USD and in the fifth week. The USD Index could therefore start to rally immediately, sometime this week or even next week and all these scenarios will be in tune with the long-term bullish pattern.
The implications are very bullish, but the timing of the short-term bottom is imprecise, at least based on the mentioned analogies.
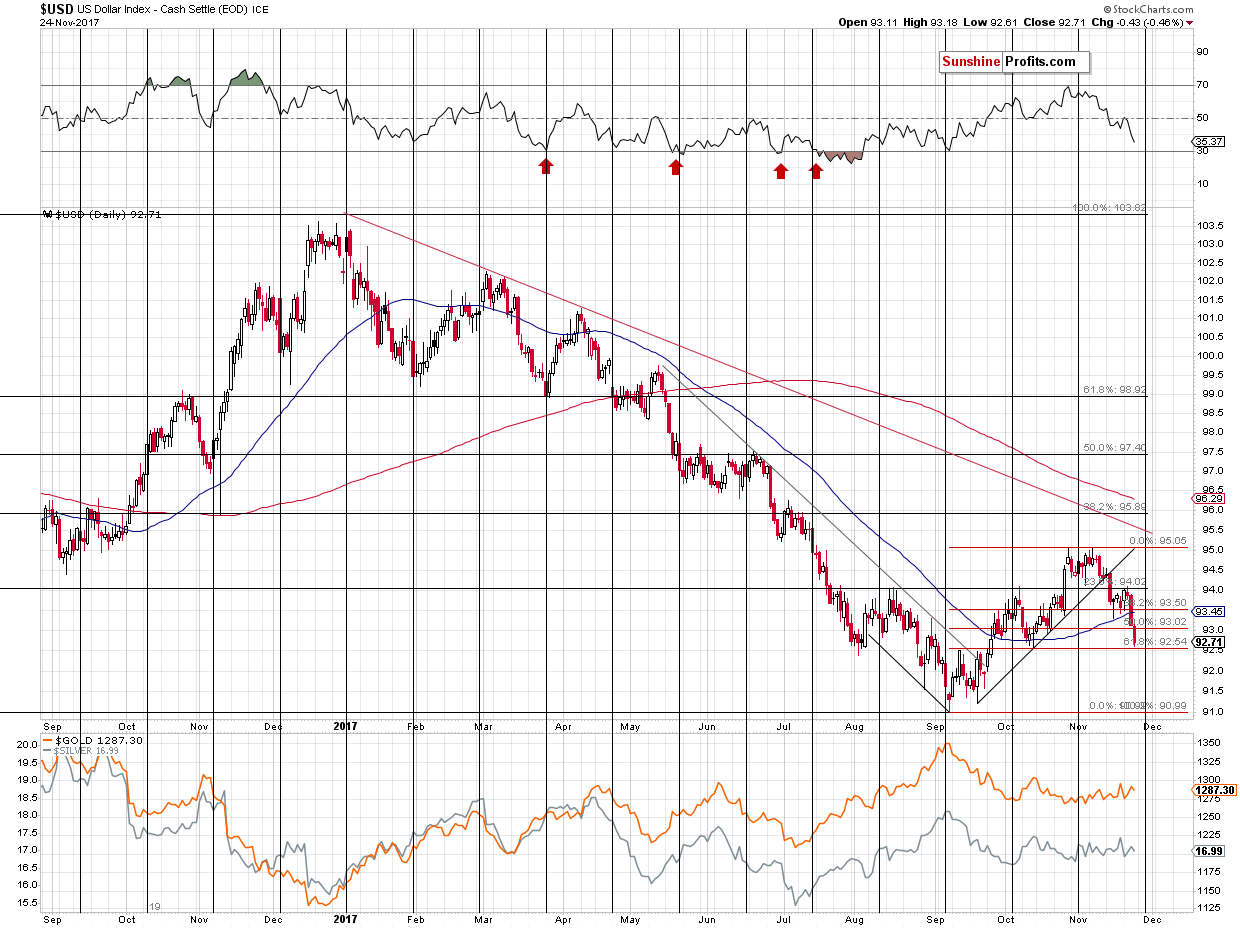
The short-term picture confirms that the USD Index could rally right away or in a few days, but to expect it to decline for another 2 weeks or so is rather unrealistic. The 61.8% Fibonacci retracement level was almost reached and the USD is right before its cyclical turning point. The former suggests that the USD could rally from the current price levels or go on without a visible decline, while the latter suggests that the rally should start shortly. The turning points tend to work on a “near to” basis, so the current one is already in play and it will remain in play until the first days of December.
The RSI indicator is not yet at the 30 level and since that’s something that accompanied local bottoms quite a few times in the past, we shouldn’t be surprised to see even lower USD values in the near future. For instance, a decline below the 61.8% Fibonacci retracement, which is then invalidated in the following days – at or close to the turning point – would be in perfect tune with the signals that we have right now.
Shouldn’t the short-term uncertainty in the USD make one exit their short positions in the precious metals sector?
Naturally, the decision is always up to you, but in our opinion, the above doesn’t imply that.
The direct reason is the way gold and silver have reacted to the USD’s slide so far – barely.
If the move lower in the USD is going to be small and/or temporary, and the precious metals sector didn’t rally significantly even in light of a quite visible decline in the USD (over 2 index points), then the PMs’ reaction to the small move is likely to be tiny. On the other hand, if the USD reverses, then the metals’ response could be huge. There are quite a few sings suggesting that the metals and miners “can’t wait” to start their declines in a more volatile manner.
One of those signs is gold’s performance in the euro.
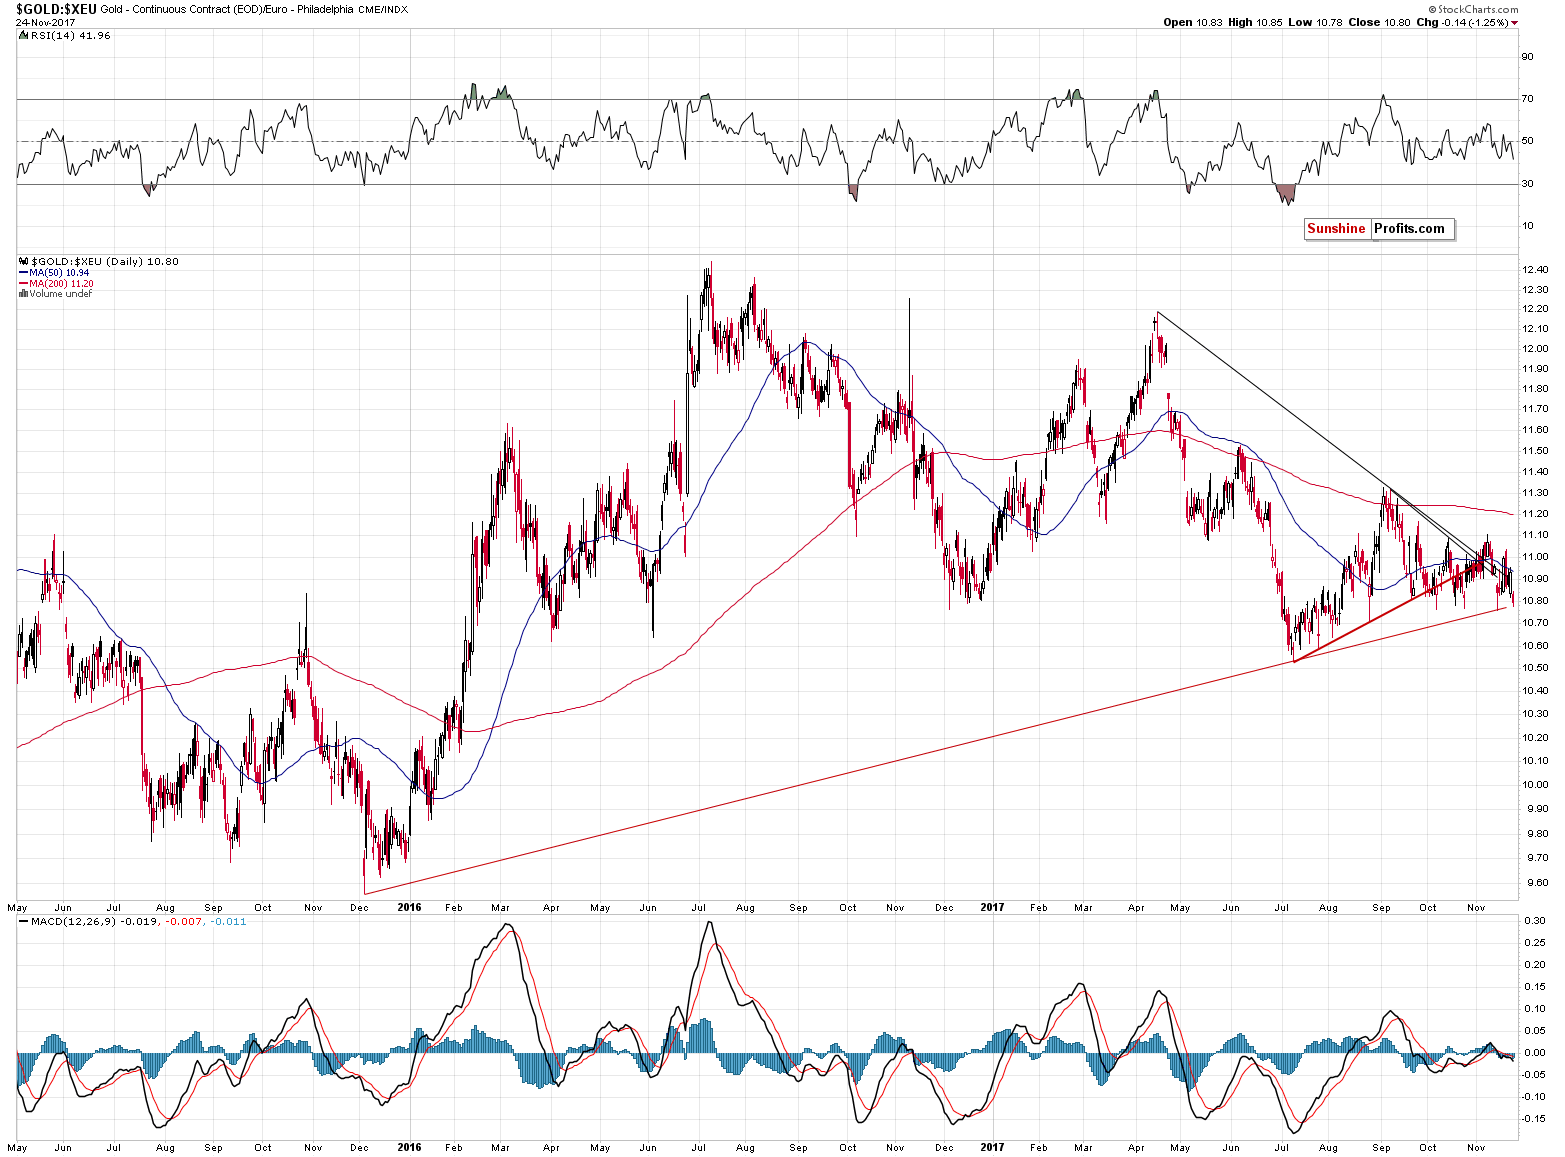
From this perspective, gold closed at new weekly lows that had not been seen since August. That’s clearly a bearish indication.
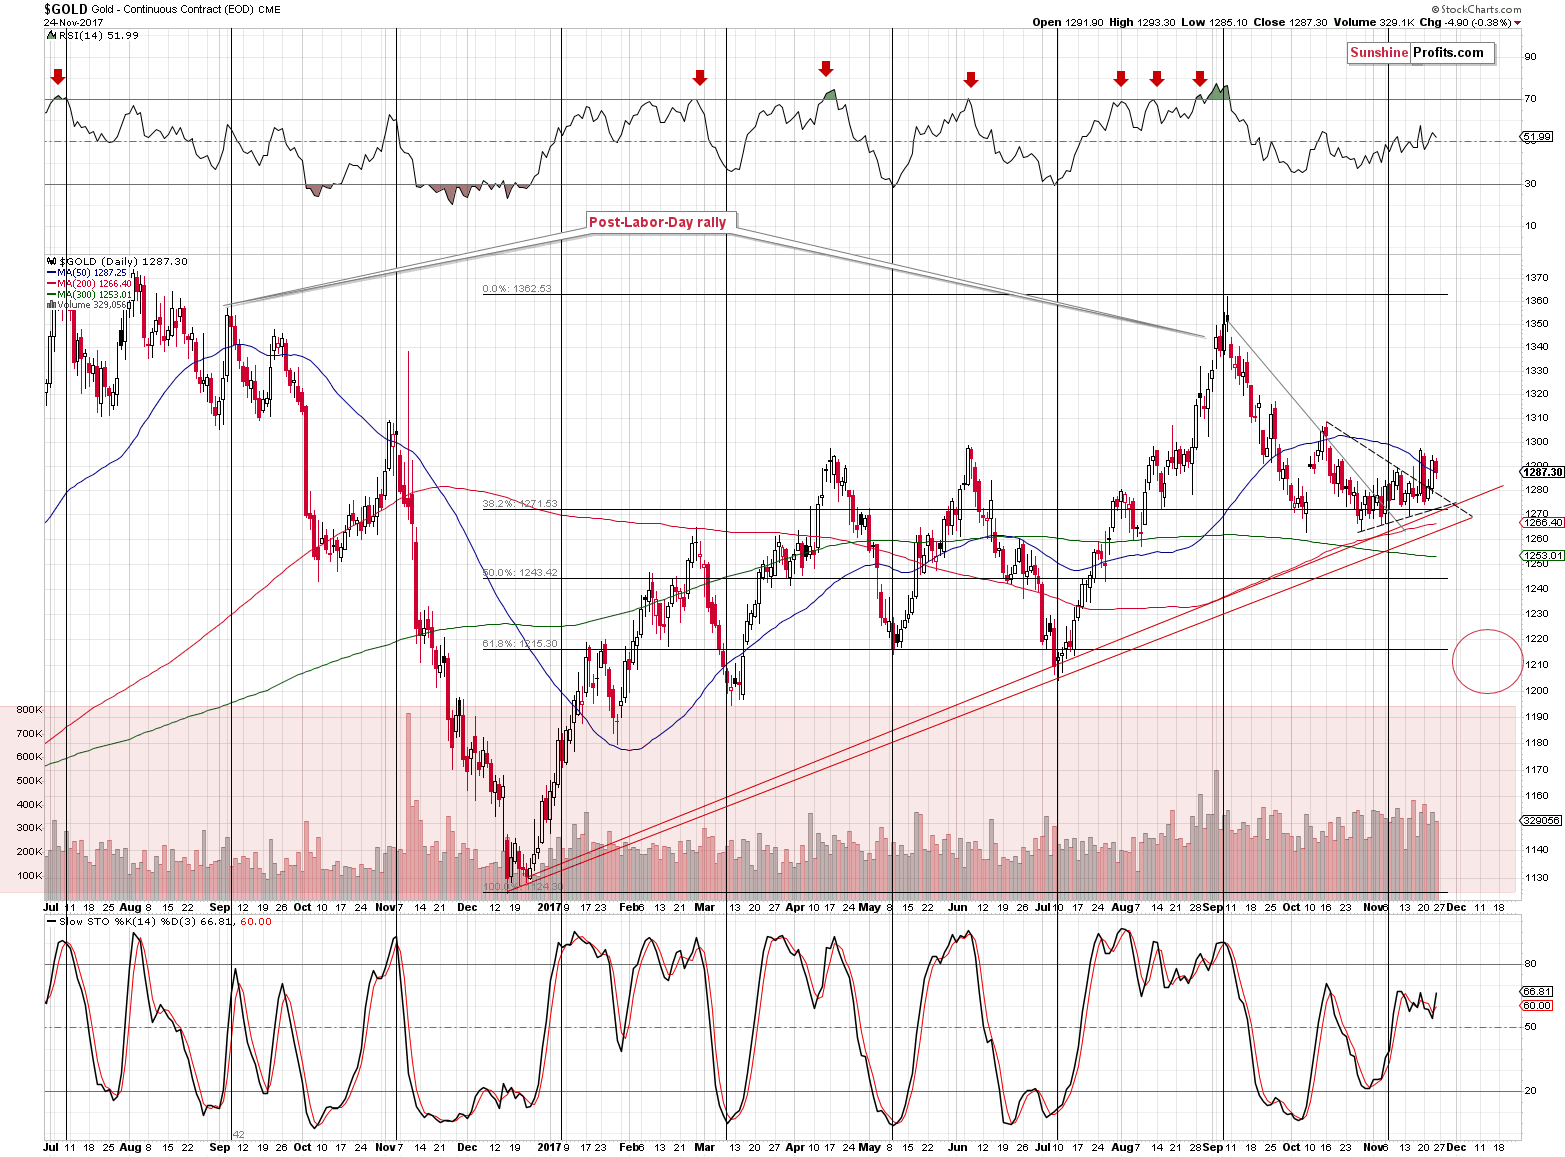
In terms of the USD, gold continues to move back and forth below the $1,300 level. Its move above the 50-day moving average and then 2 closes above it seem similar to the October top. The Stochastic and RSI levels are similar as well. The above is a weak, but still, bearish sign.
On the bullish note, gold broke and closed for 2 days above the triangle pattern, which could result in a short-term rally (3 days of confirmations are necessary for this to be very likely), but since gold is moving higher today, this could very well be the case. Still, we don’t expect the upswing to take gold much higher – the October high seems to be a likely target in the case of gold’s rally continues. Again, that’s a big if, as based i.a. on the 61.8% Fibonacci retracement in the USD, the latter could rally immediately and gold could decline immediately as a result.
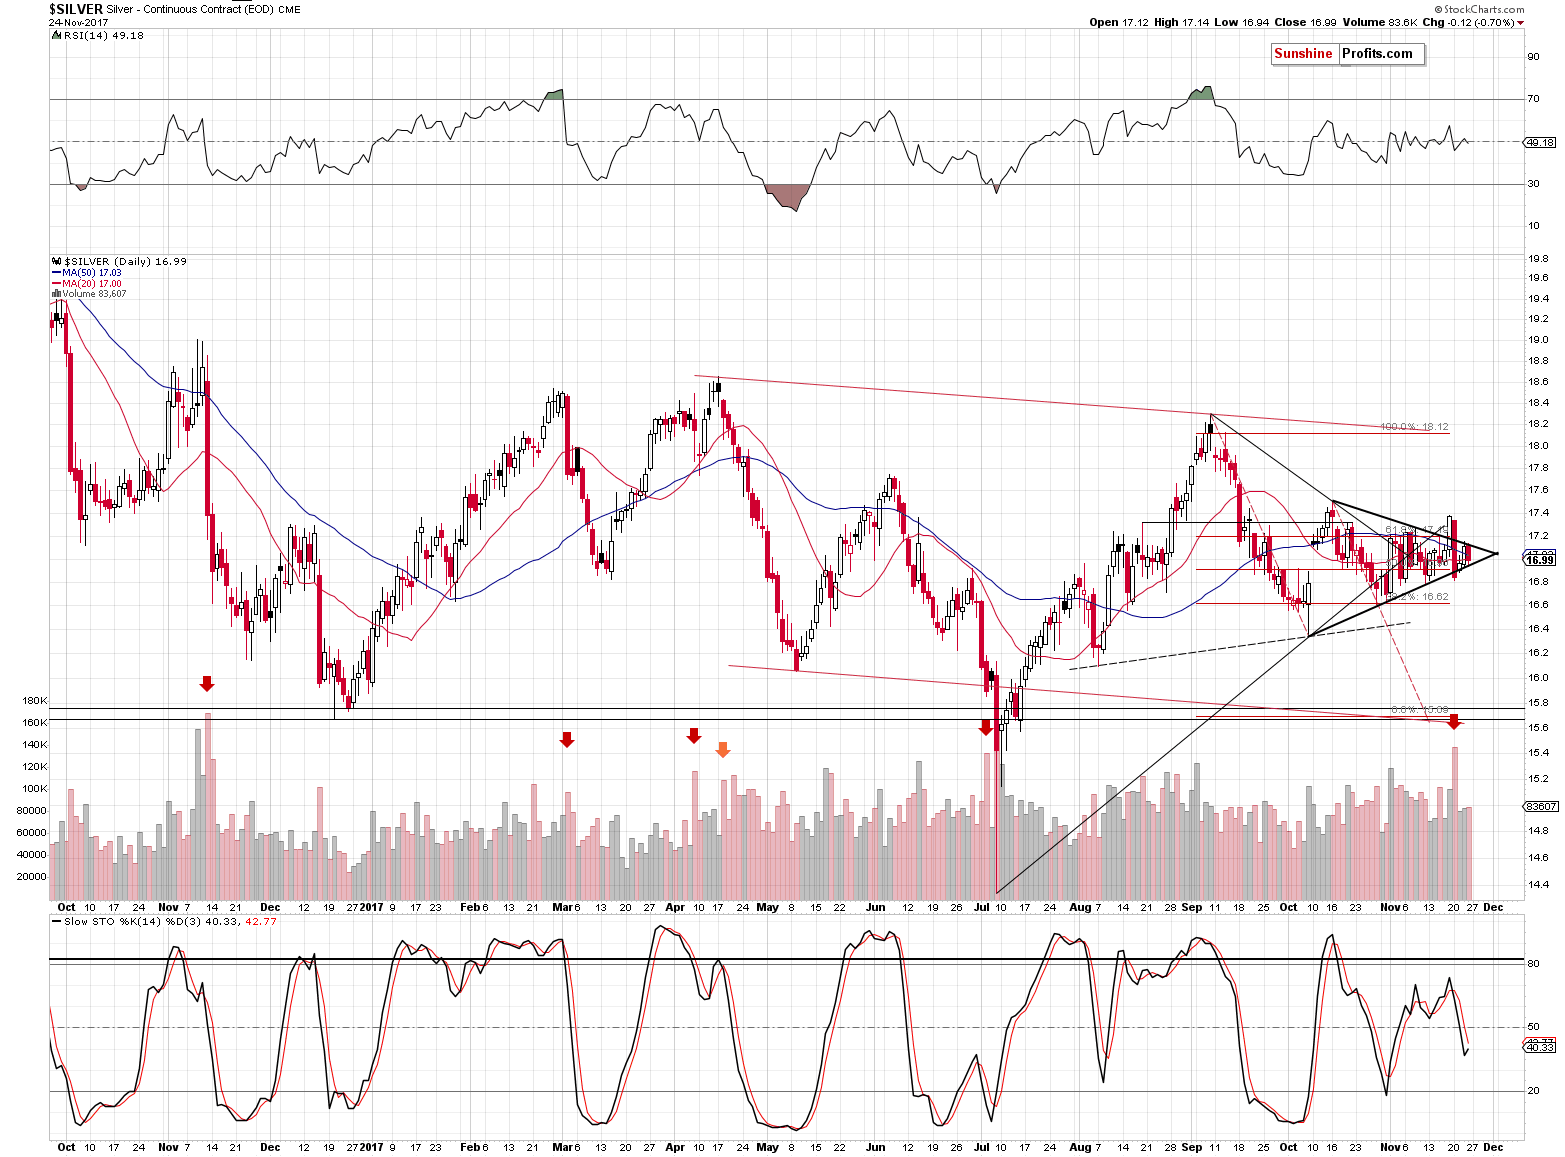
Silver didn’t do much – it continues to trade back and for within the triangle. The apex of the triangle is in early December and we therefore expect to see an important turnaround at that time.
We previously expected this turning point to be the next local bottom, but at this time, in light of the situation in the USD Index and the fact that it’s only a few days left until the end of November, we need to adjust this expectation and take into account the possibility that the turnaround will be seen at a local top.
So, the situation could go in the following way: silver breaks above the triangle this week as the USD declines and forms a bottom. That would be very close to the end of the month and the apex-based turning point would come into play. The USD would start a multi-week rally and silver would decline, invalidating the previous breakout above the triangle pattern and sliding well below it, likely moving below the $16 level before the next pause.
Naturally, the above is just one of the ways things could evolve from here, but it seems that it’s quite likely.
The generally bearish outlook for the precious metals sector didn’t change, tough, and mining stocks provide additional confirmations.
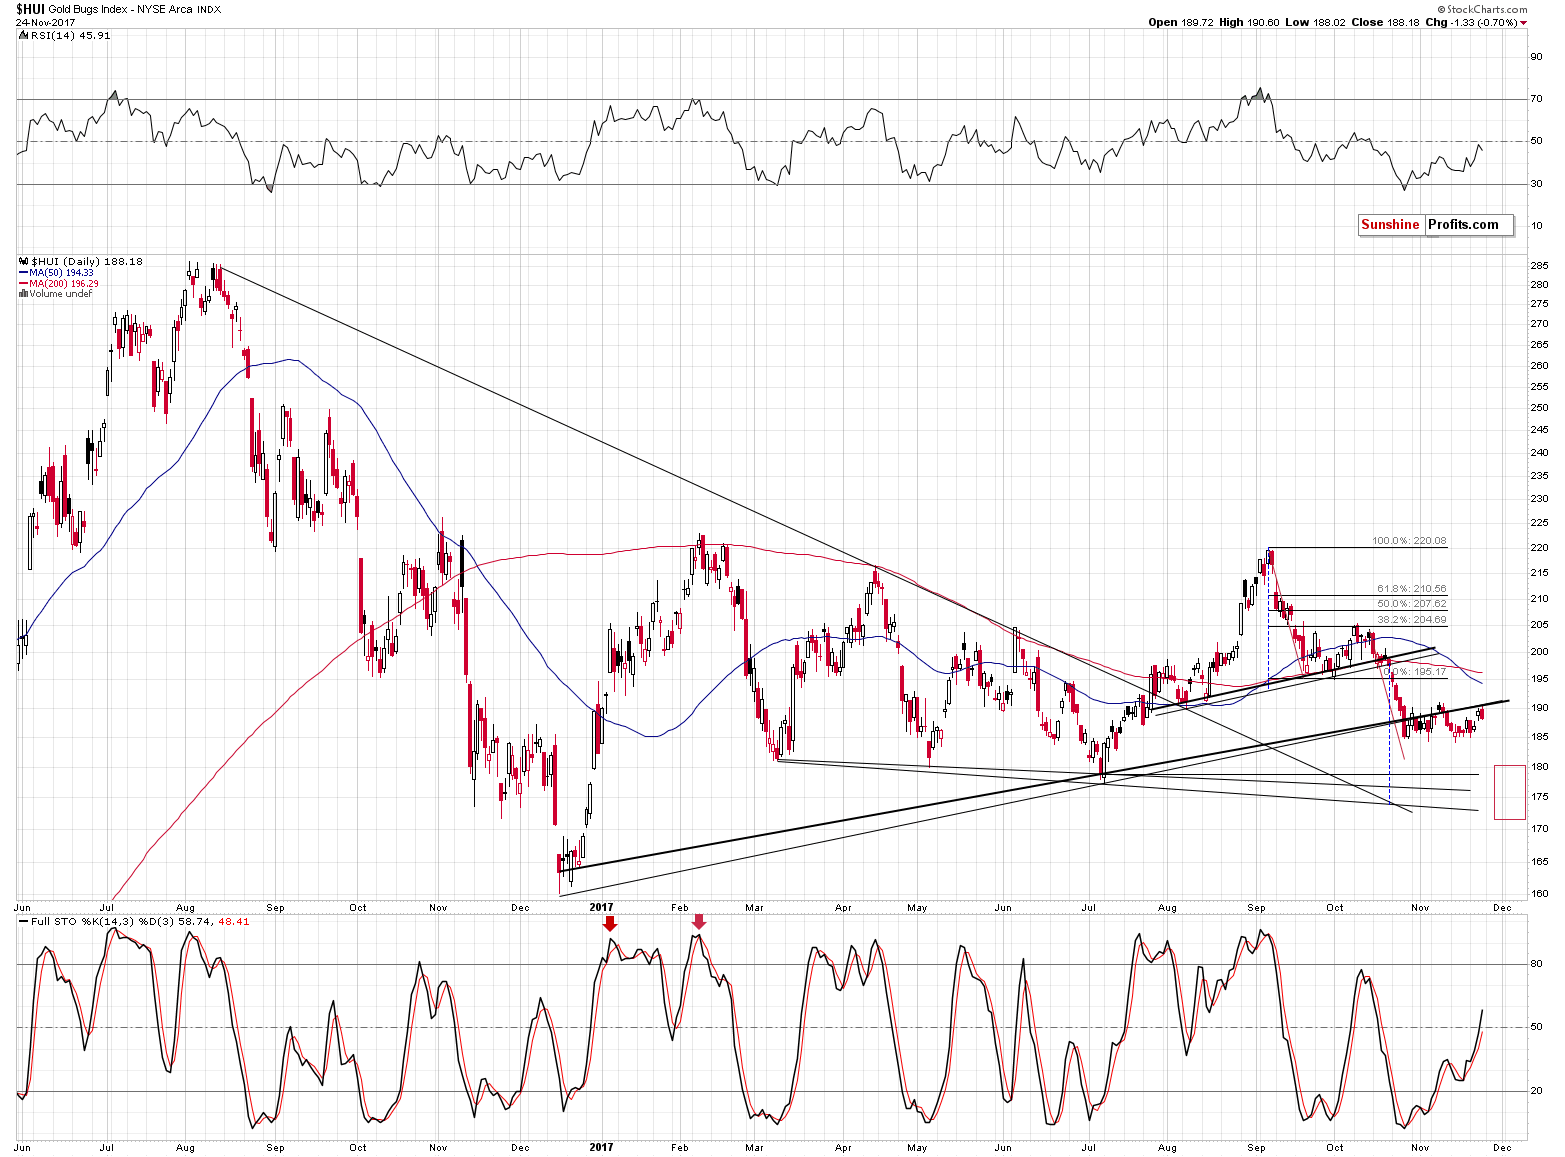
The above HUI Index chart shows that last week’s rally didn’t change anything – it was yet another move to the previously broken lines, which once again proved to be strong resistance.
At the same time the RSI and Stochastic moved visibly higher, which suggests that the monthly pause managed to cool down the investors’ emotions and that makes room for another downswing. The RSI level close to 50 was quite often seen at local tops during bigger declines (especially in 2016), which serves as another bearish sign.
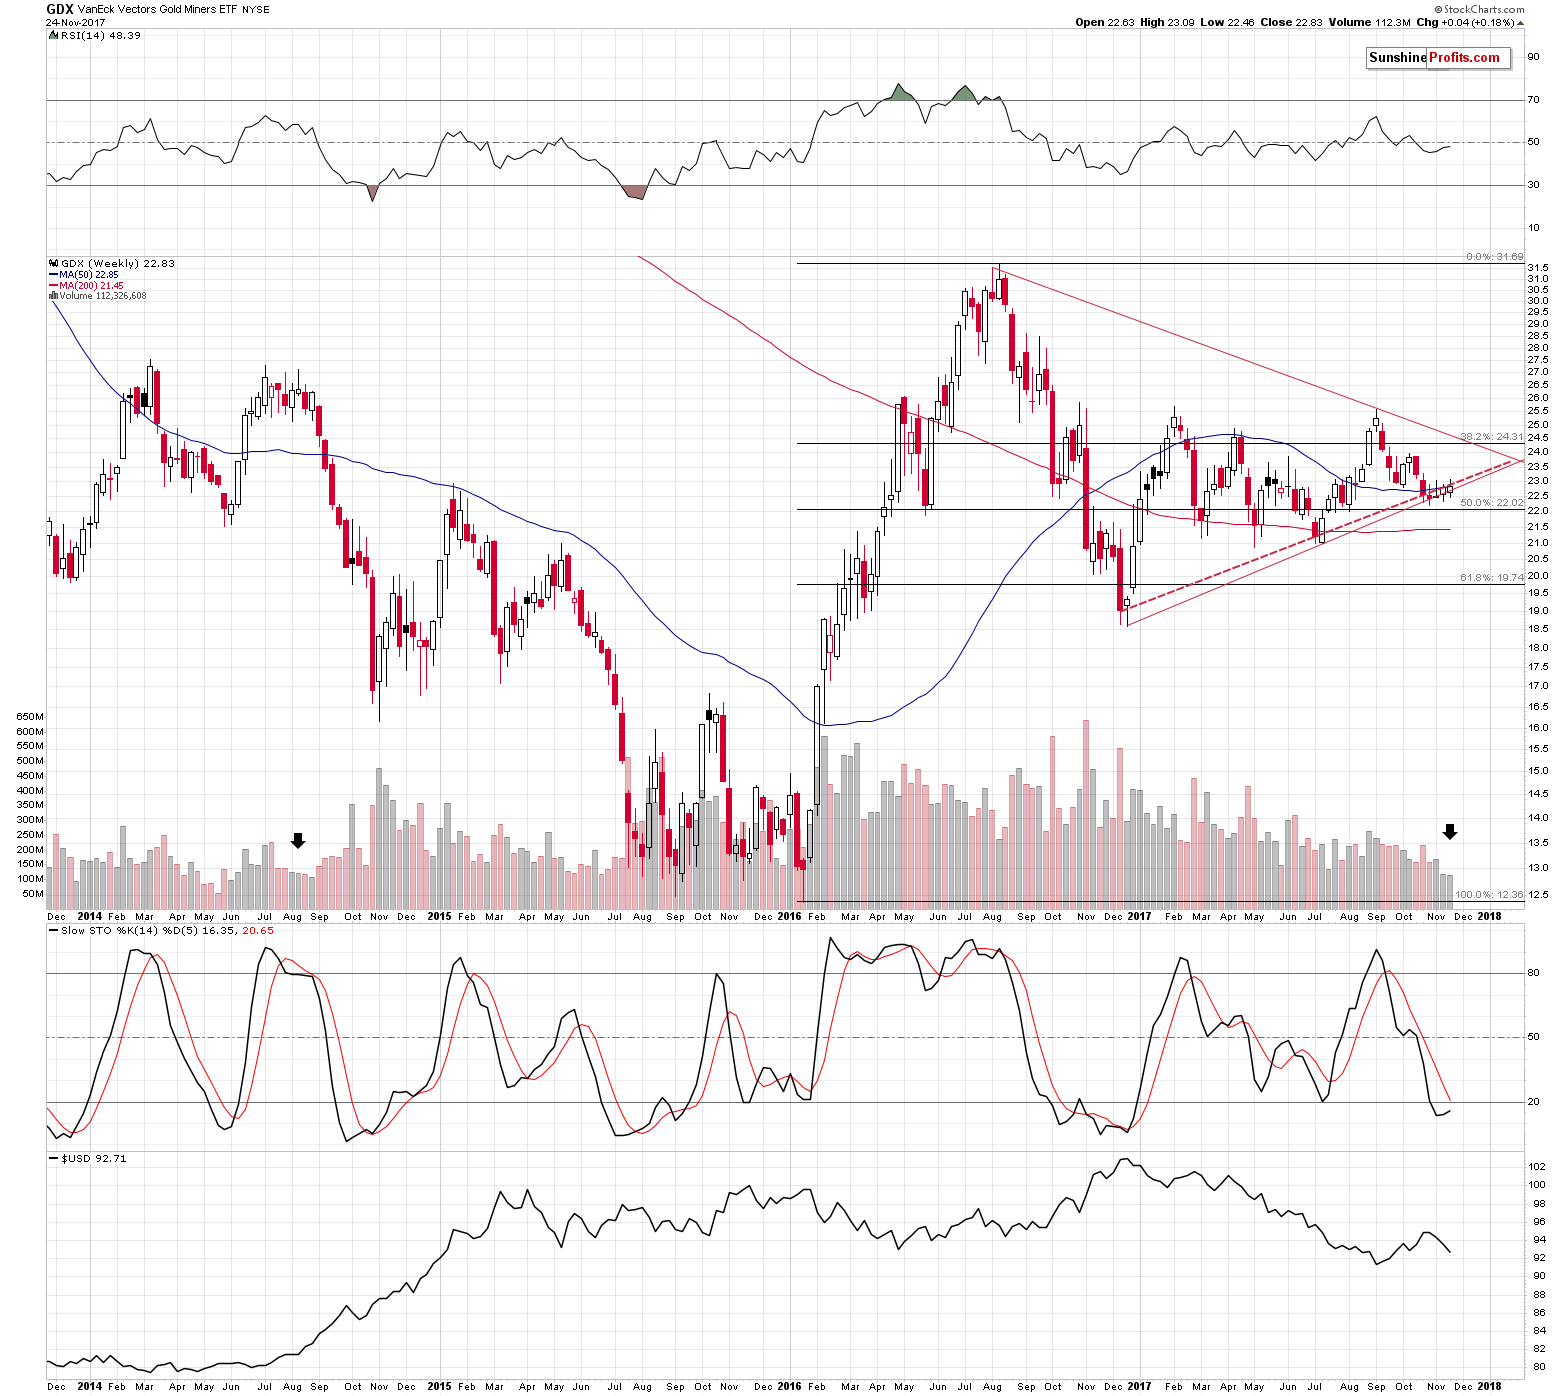
Finally, the weekly volume levels in the GDX ETF paint a very bearish picture for the following weeks. The GDX ETF is after 2 small, weekly rallies that were accompanied by very low volume when compared with the previous weeks. The last week had less trading days, but that doesn’t explain the previous week’s low volume reading. Moreover, we didn’t see similarly low volume readings in the past Novembers, which suggests that we are correct to view the low volume levels as something important and meaningful.
The only comparable situation from the recent past took place in mid-2014 (marked with a black arrow). In the following weeks, the GDX price was cut by a third. An analogous decline here would imply the GDX below $16 and if the GDX confirms the breakdown below the late 2016 low (slightly below $19), then it shouldn’t take long for the miners to slide all the way down to the 2015 bottom or lower.
While the above doesn’t tell us much about the miners’ likely performance this week, it does point out what kind of moves we should be focusing on – after the huge decline starts, the current intraweek and intraday price swings will not really matter and most likely nobody will even remember them.
Summing up, while the situation in the currency market is not crystal clear, based on how the precious metals market reacted to the recent decline in the USD, it doesn’t seem that we should be concerned with its possible continuation this week. There are many signs pointing to a big move lower in the coming weeks and it seems that any short-term strength will be reversed sooner rather than later.
Naturally, the medium-term outlook remains bearish, especially that the analogy to the 2012-2013 decline remains in place and the previously discussed long-term signals remain in place: gold’s huge monthly volume, the analogy in the HUI Index, the analogy between the two most recent series of interest rate hikes, and the RSI signal from gold priced in the Japanese yen.
As always, we will keep you – our subscribers – informed.
To summarize:
Trading capital (supplementary part of the portfolio; our opinion): Short positions (150% of the full position) in gold, silver and mining stocks are justified from the risk/reward perspective with the following stop-loss orders and exit price levels / profit-take orders:
- Gold: exit price: $1,218; stop-loss: $1,366; exit price for the DGLD ETN: $51.98; stop-loss for the DGLD ETN $38.74
- Silver: exit price: $15.82; stop-loss: $19.22; exit price for the DSLV ETN: $28.88; stop-loss for the DSLV ETN $17.93
- Mining stocks (price levels for the GDX ETF): exit price: $21.23; stop-loss: $26.34; exit price for the DUST ETF: $29.97; stop-loss for the DUST ETF $21.37
In case one wants to bet on junior mining stocks' prices (we do not suggest doing so – we think senior mining stocks are more predictable in the case of short-term trades – if one wants to do it anyway, we provide the details), here are the stop-loss details and exit prices:
- GDXJ ETF: exit price: $30.28; stop-loss: $45.31
- JDST ETF: exit price: $66.27; stop-loss: $43.12
Long-term capital (core part of the portfolio; our opinion): No positions (in other words: cash)
Insurance capital (core part of the portfolio; our opinion): Full position
Important Details for New Subscribers
Whether you already subscribed or not, we encourage you to find out how to make the most of our alerts and read our replies to the most common alert-and-gold-trading-related-questions.
Please note that the in the trading section we describe the situation for the day that the alert is posted. In other words, it we are writing about a speculative position, it means that it is up-to-date on the day it was posted. We are also featuring the initial target prices, so that you can decide whether keeping a position on a given day is something that is in tune with your approach (some moves are too small for medium-term traders and some might appear too big for day-traders).
Plus, you might want to read why our stop-loss orders are usually relatively far from the current price.
Please note that a full position doesn’t mean using all of the capital for a given trade. You will find details on our thoughts on gold portfolio structuring in the Key Insights section on our website.
As a reminder – “initial target price” means exactly that – an “initial” one, it’s not a price level at which we suggest closing positions. If this becomes the case (like it did in the previous trade) we will refer to these levels as levels of exit orders (exactly as we’ve done previously). Stop-loss levels, however, are naturally not “initial”, but something that, in our opinion, might be entered as an order.
Since it is impossible to synchronize target prices and stop-loss levels for all the ETFs and ETNs with the main markets that we provide these levels for (gold, silver and mining stocks – the GDX ETF), the stop-loss levels and target prices for other ETNs and ETF (among other: UGLD, DGLD, USLV, DSLV, NUGT, DUST, JNUG, JDST) are provided as supplementary, and not as “final”. This means that if a stop-loss or a target level is reached for any of the “additional instruments” (DGLD for instance), but not for the “main instrument” (gold in this case), we will view positions in both gold and DGLD as still open and the stop-loss for DGLD would have to be moved lower. On the other hand, if gold moves to a stop-loss level but DGLD doesn’t, then we will view both positions (in gold and DGLD) as closed. In other words, since it’s not possible to be 100% certain that each related instrument moves to a given level when the underlying instrument does, we can’t provide levels that would be binding. The levels that we do provide are our best estimate of the levels that will correspond to the levels in the underlying assets, but it will be the underlying assets that one will need to focus on regarding the signs pointing to closing a given position or keeping it open. We might adjust the levels in the “additional instruments” without adjusting the levels in the “main instruments”, which will simply mean that we have improved our estimation of these levels, not that we changed our outlook on the markets. We are already working on a tool that would update these levels on a daily basis for the most popular ETFs, ETNs and individual mining stocks.
Our preferred ways to invest in and to trade gold along with the reasoning can be found in the how to buy gold section. Additionally, our preferred ETFs and ETNs can be found in our Gold & Silver ETF Ranking.
As a reminder, Gold & Silver Trading Alerts are posted before or on each trading day (we usually post them before the opening bell, but we don't promise doing that each day). If there's anything urgent, we will send you an additional small alert before posting the main one.
=====
Latest Free Trading Alerts:
Last week, the minutes of the FOMC November meeting were released. What do they say about the Fed’s stance and what do they mean for the gold market?
Minutes from November 2017 FOMC Meeting and Gold
S&P 500 index gained 0.2% on Friday, as it slightly extended its Tuesday's breakout above the early November high. Will it continue higher? Or is this some topping pattern ahead of downward correction?
S&P 500 At New Record High, Will Uptrend Continue?
We see a move to an all-time high above $8,000. At the same time, the volume isn’t spectacular. What might this mean for the Bitcoin market?
Bitcoin Moves above $8,000 to All-time High
=====
Hand-picked precious-metals-related links:
Gold Prices Drift Higher at Start of Busy Week of Fed Speakers
PRECIOUS-Gold edges higher as dollar hits 2-month low vs euro
=====
In other news:
Dollar extends three-week losing streak as Powell, U.S. tax plan eyed
China wobble knocks stocks, bitcoin eyes $10,000
Powell Is About to Show Whether He's Change Agent or Yellen 2.0
What the Renewed Upward Move in Stocks Tells Us
The Fed launched QE nine years ago — these four charts show its impact
Tax reform hangs in balance in critical week for GOP
Bitcoin nears $10,000 mark as hedge funds plough in
Here’s What the World's Central Banks Really Think About Bitcoin
OPEC meeting: Cartel poised to announce deal extension despite Russia concerns
=====
Thank you.
Sincerely,
Przemyslaw Radomski, CFA
Founder, Editor-in-chief, Gold & Silver Fund Manager
Gold & Silver Trading Alerts
Forex Trading Alerts
Oil Investment Updates
Oil Trading Alerts

