

Briefly: In our opinion, full (150% of the regular full position) speculative short positions in gold, silver and mining stocks are justified from the risk/reward perspective at the moment of publishing this alert.
Yesterday’s session was not as eventful as the entire previous week, but this doesn’t mean that what happened was without meaning. Conversely, in addition to fresh sell signals from the Stochastic indicator in gold and the HUI Index, we saw two important short-term signs and one long-term one. How did they change the outlook? Was today’s pre-market flash crash in gold and silver just a blip on the radar screen or a beginning of something bigger?
Not at all. The short-term signals that we saw yesterday were: silver’s outperformance (the white metal indeed outperformed gold) and mining stocks’ underperformance (the HUI ended lower even though gold ended higher). That’s a classic bearish combination. Let’s take a look at the charts for details (chart courtesy of http://stockcharts.com).
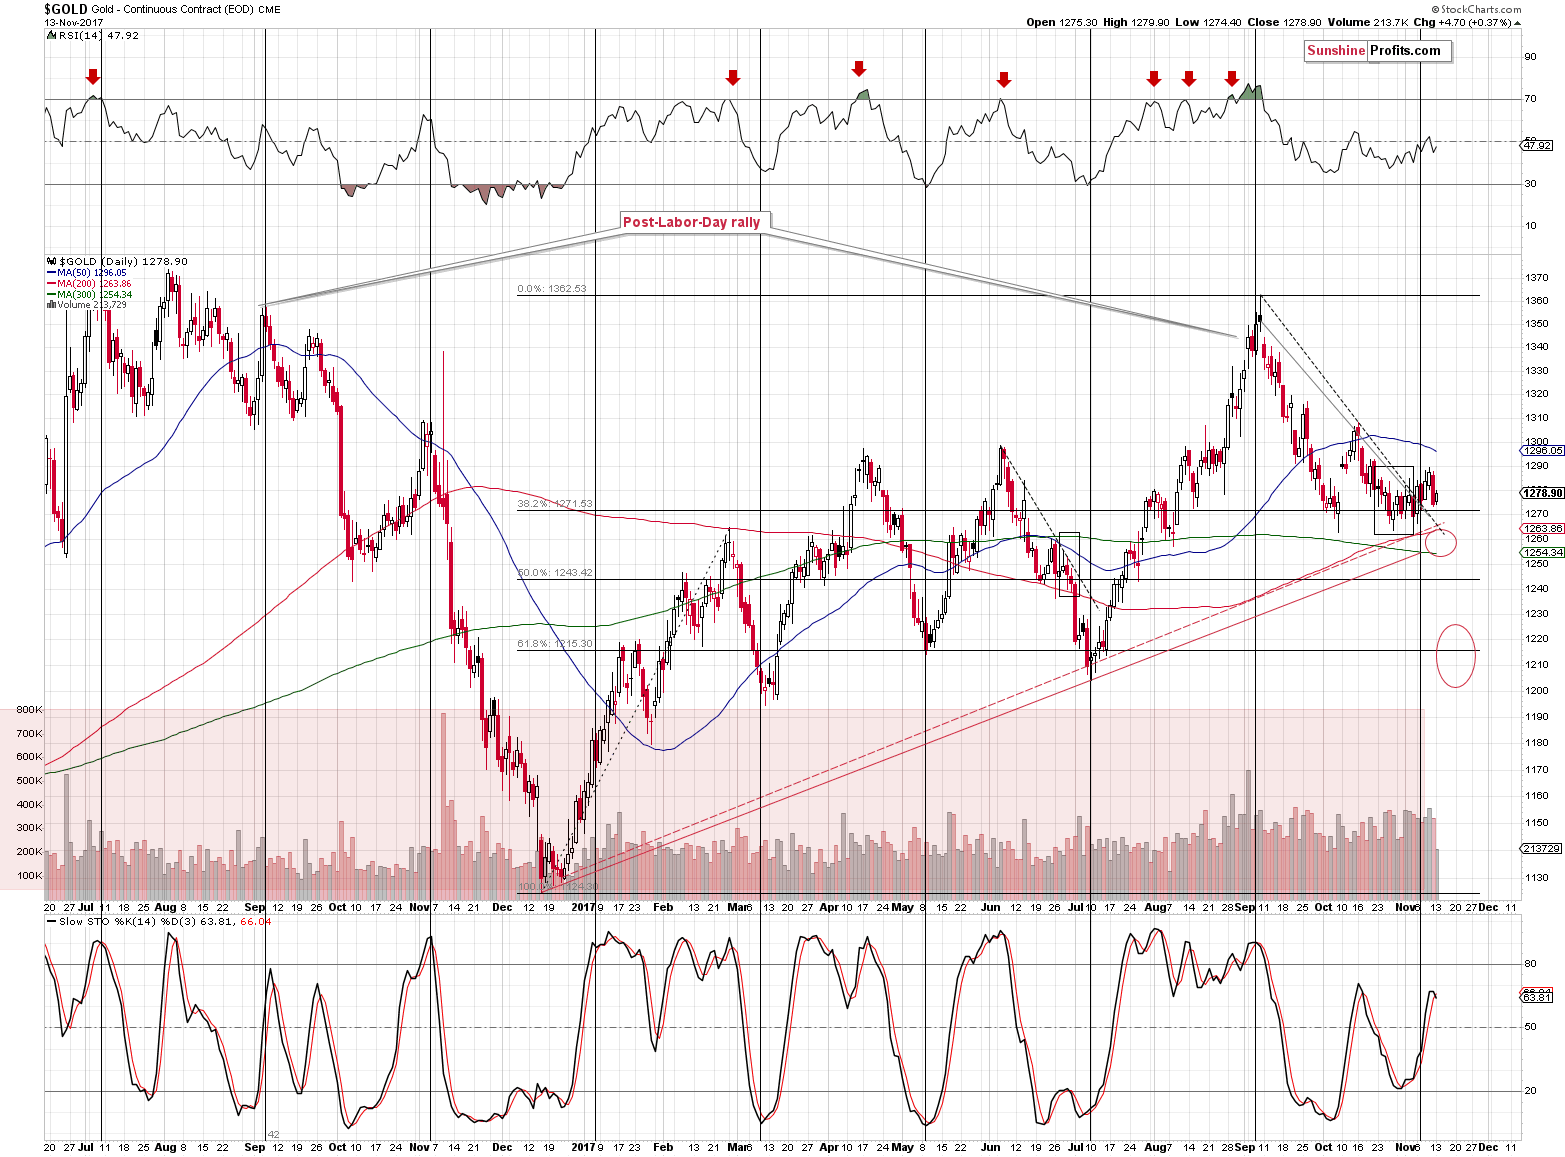
The additional interesting development on the gold chart is the new sell signal from the Stochastic indicator. The daily version of this indicator is not as reliable as the weekly one, but still, the past two sell signals were followed by quite visible declines, so we could see one shortly as well.
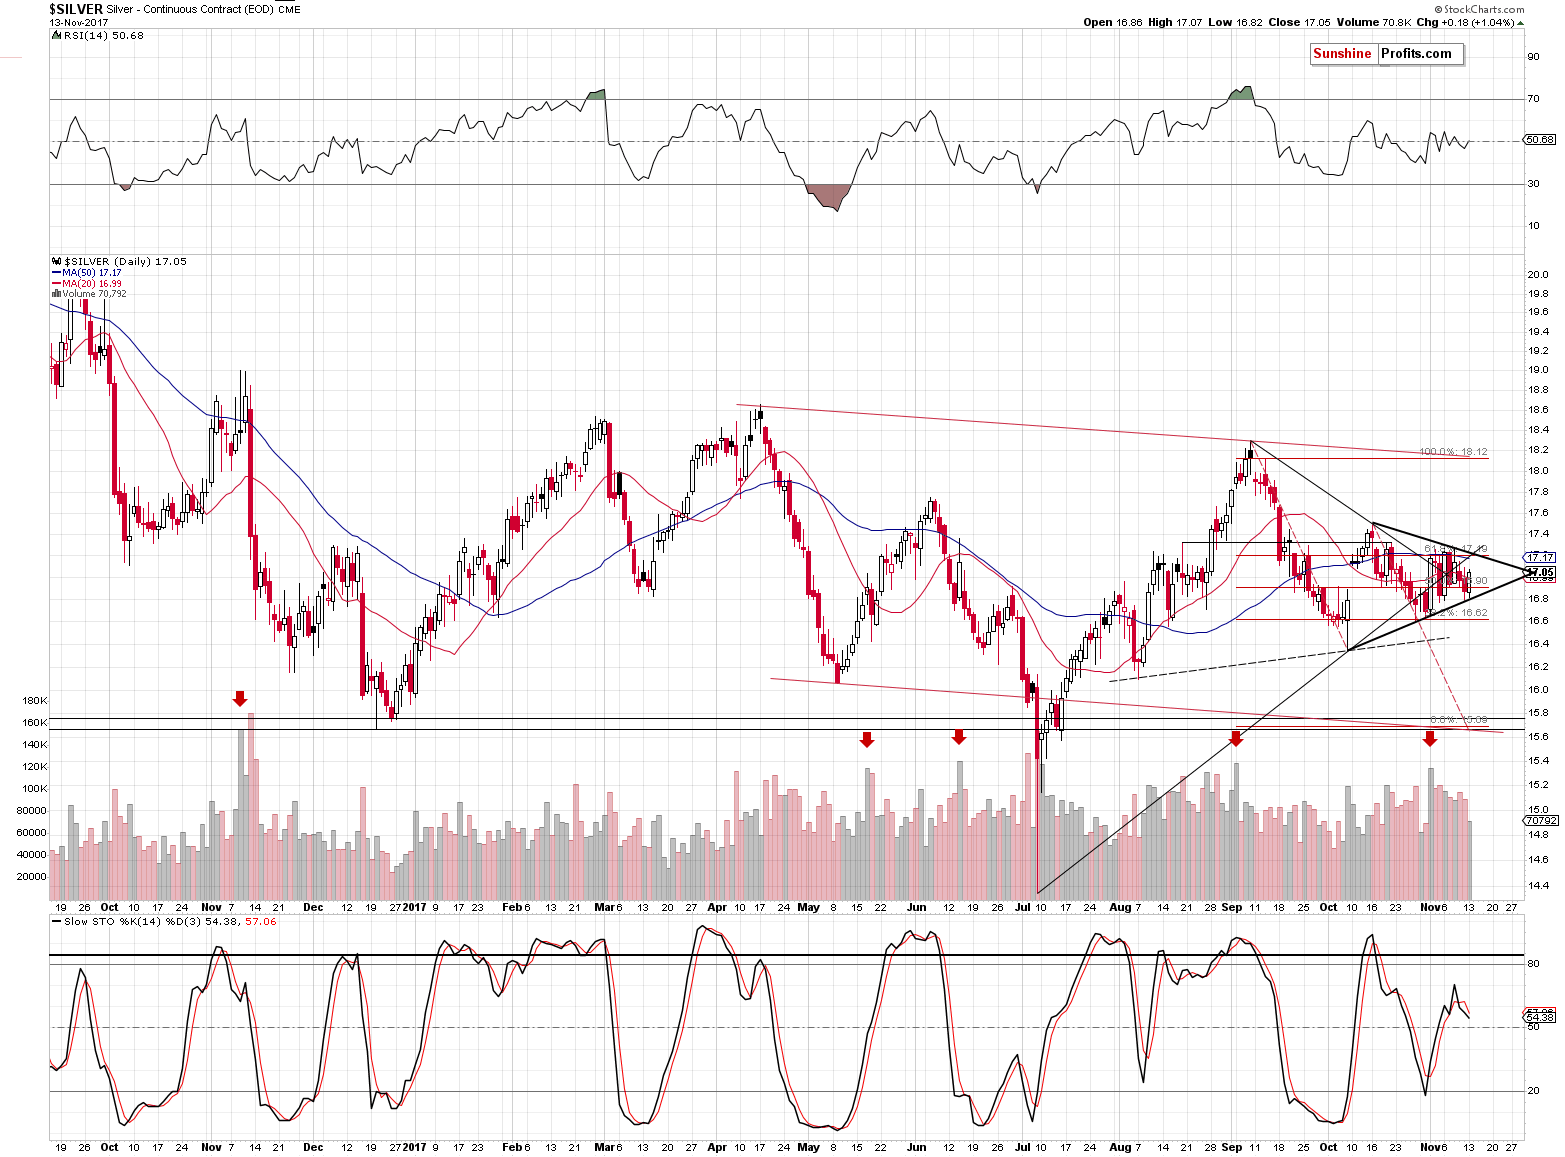
Silver moved higher on low volume, which made the rally rather insignificant. We didn’t have to wait long for the confirmation as silver declined in today’s pre-market trading and moved back to where it was before yesterday’s intraday rally. The sell signal from the Stochastic indicator remains in place and our comments on it remain up-to-date as well:
The sell signal from the Stochastic indicator is even clearer based on Friday’s move lower, so the implications are bearish. In fact, there were only three other cases visible on the above chart when the Stochastic flashed visible sell signals (moving below its red signal line) while not being above the 80 level, but below it. They all were followed by very sharp declines: the late September 2016 signal was followed by a sharp slide in early October, the mid-November 2016 signal and declines are clearly visible and the same goes for the late-June 2017 decline that temporarily took silver below $15. Naturally, the implications are bearish.
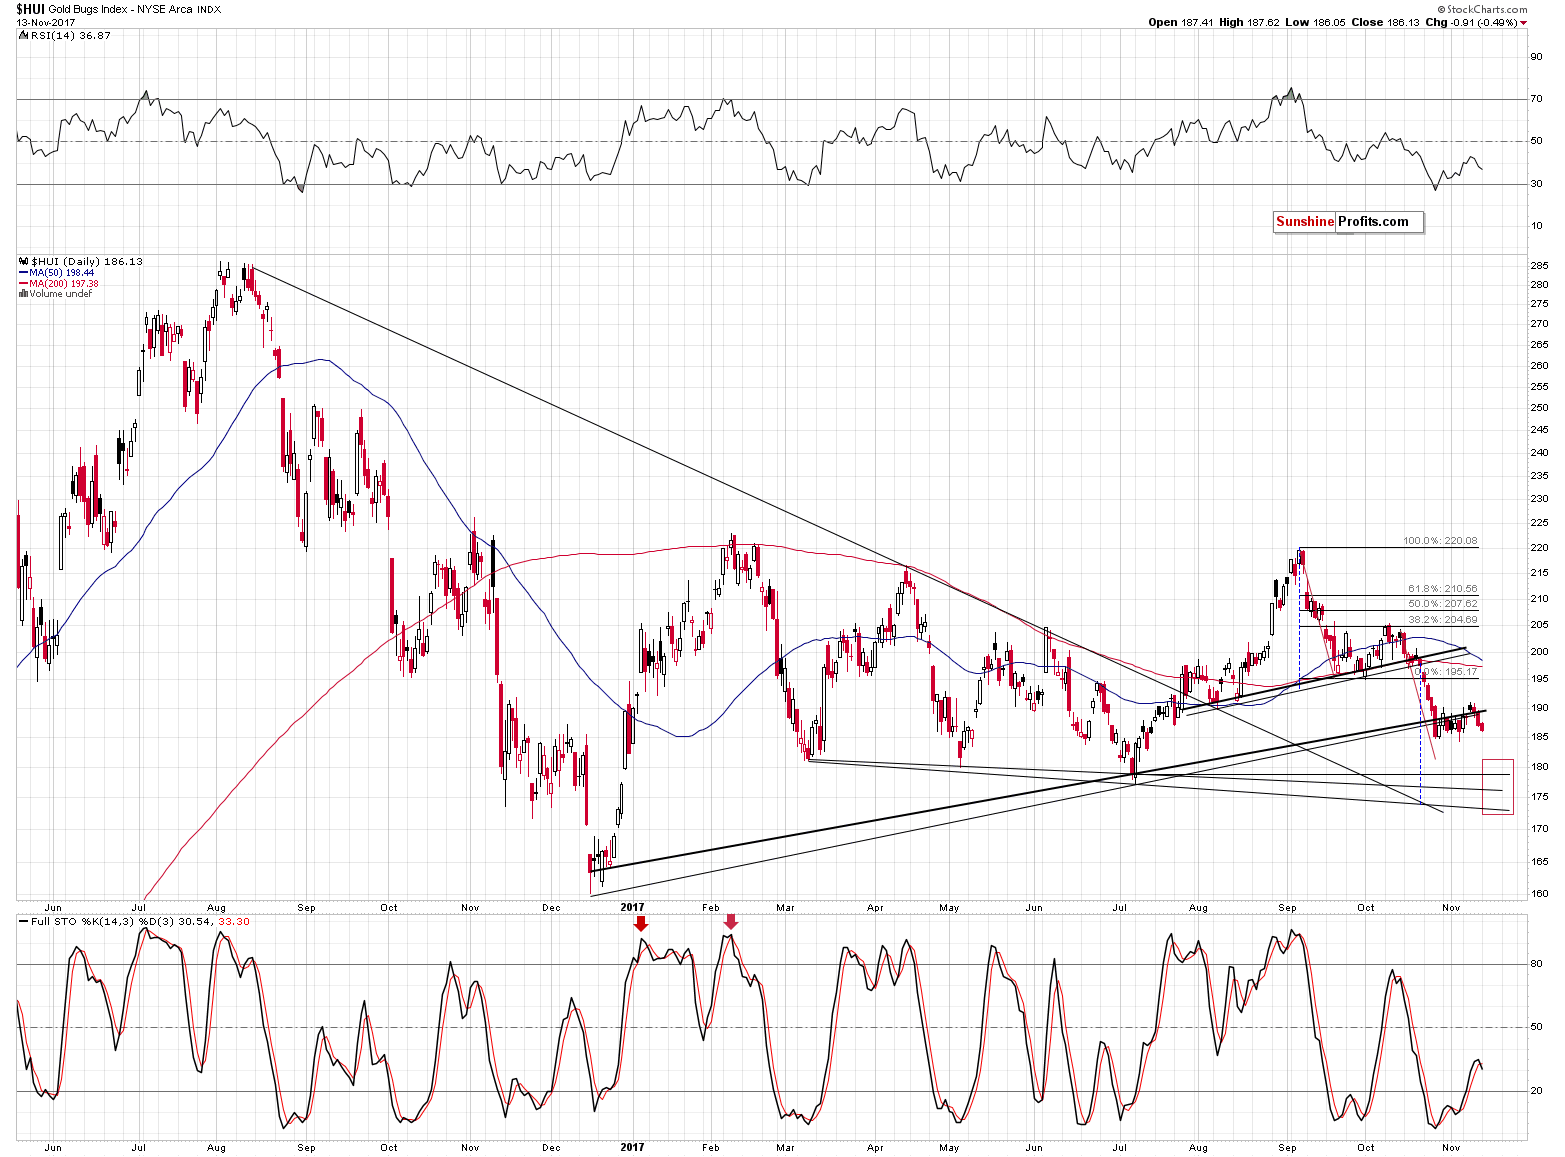
Gold stocks declined and their Stochastic indicator also flashed a sell signal – now we have the entire trio: gold, silver and miners providing the same signal, which increases its reliability and importance.
Naturally, the miners’ underperformance is a bearish indication as well.
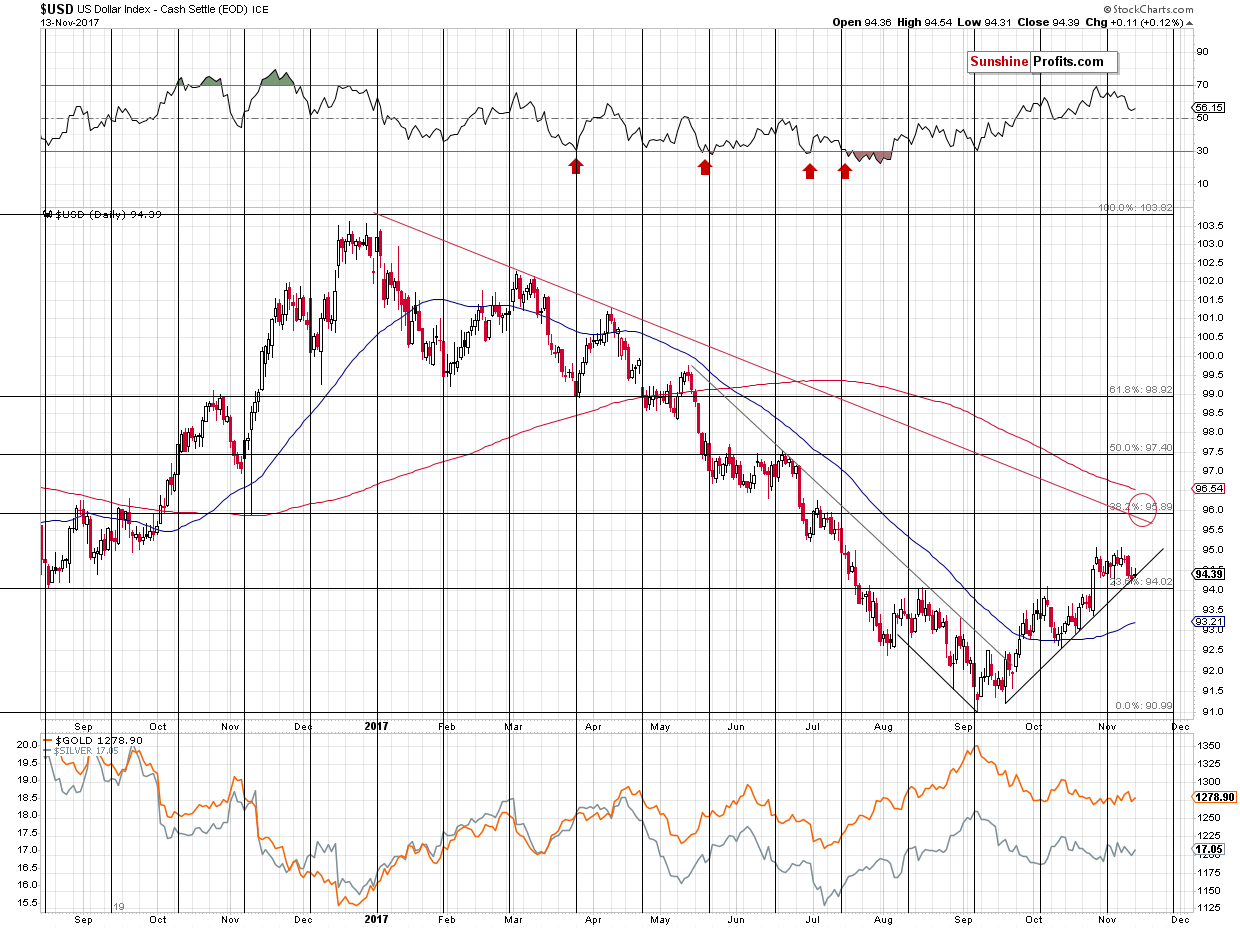
In yesterday’s alert, we wrote that the USD Index moved to the rising short-term support line without breaking below it. Consequently, it was likely to bounce and continue its rally. The 95.89 still served as the most likely short-term target.
We can say exactly the same thing based on yesterday’s non-performance. Nothing really changed and the USD is still likely to rally based on the proximity of the rising support line and the target area remains up-to-date as well.
In today’s pre-market trading, the USD Index moved a bit below the rising support line, but not below the early October high – the key breakout was not invalidated and the breakdown below the rising support line is small and not confirmed by daily closing prices. Consequently, it doesn’t seem that it changes anything. Besides, since gold and silver are down today (at least at the moment of writing these words) even despite USD’s small decline, the implications are bearish for the former anyway.
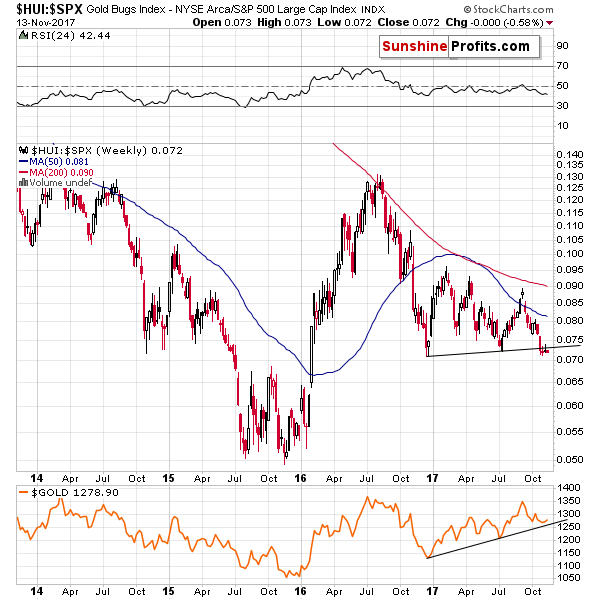
The long-term sign that we mentioned above is the continuation of the decline in the HUI to S&P 500 ratio.
Quoting yesterday’s alert:
If we compare the golds stocks’ performance to the one of the general stock market, we’ll also see that the breakdown and its bearish implications remain in place.
The above does not only remain in place – we also saw a continuation of the decline. So far it is small, but since the ratio is so close to the support / resistance line, even the relatively small decline means that the breakdown below the support line is becoming a fact.
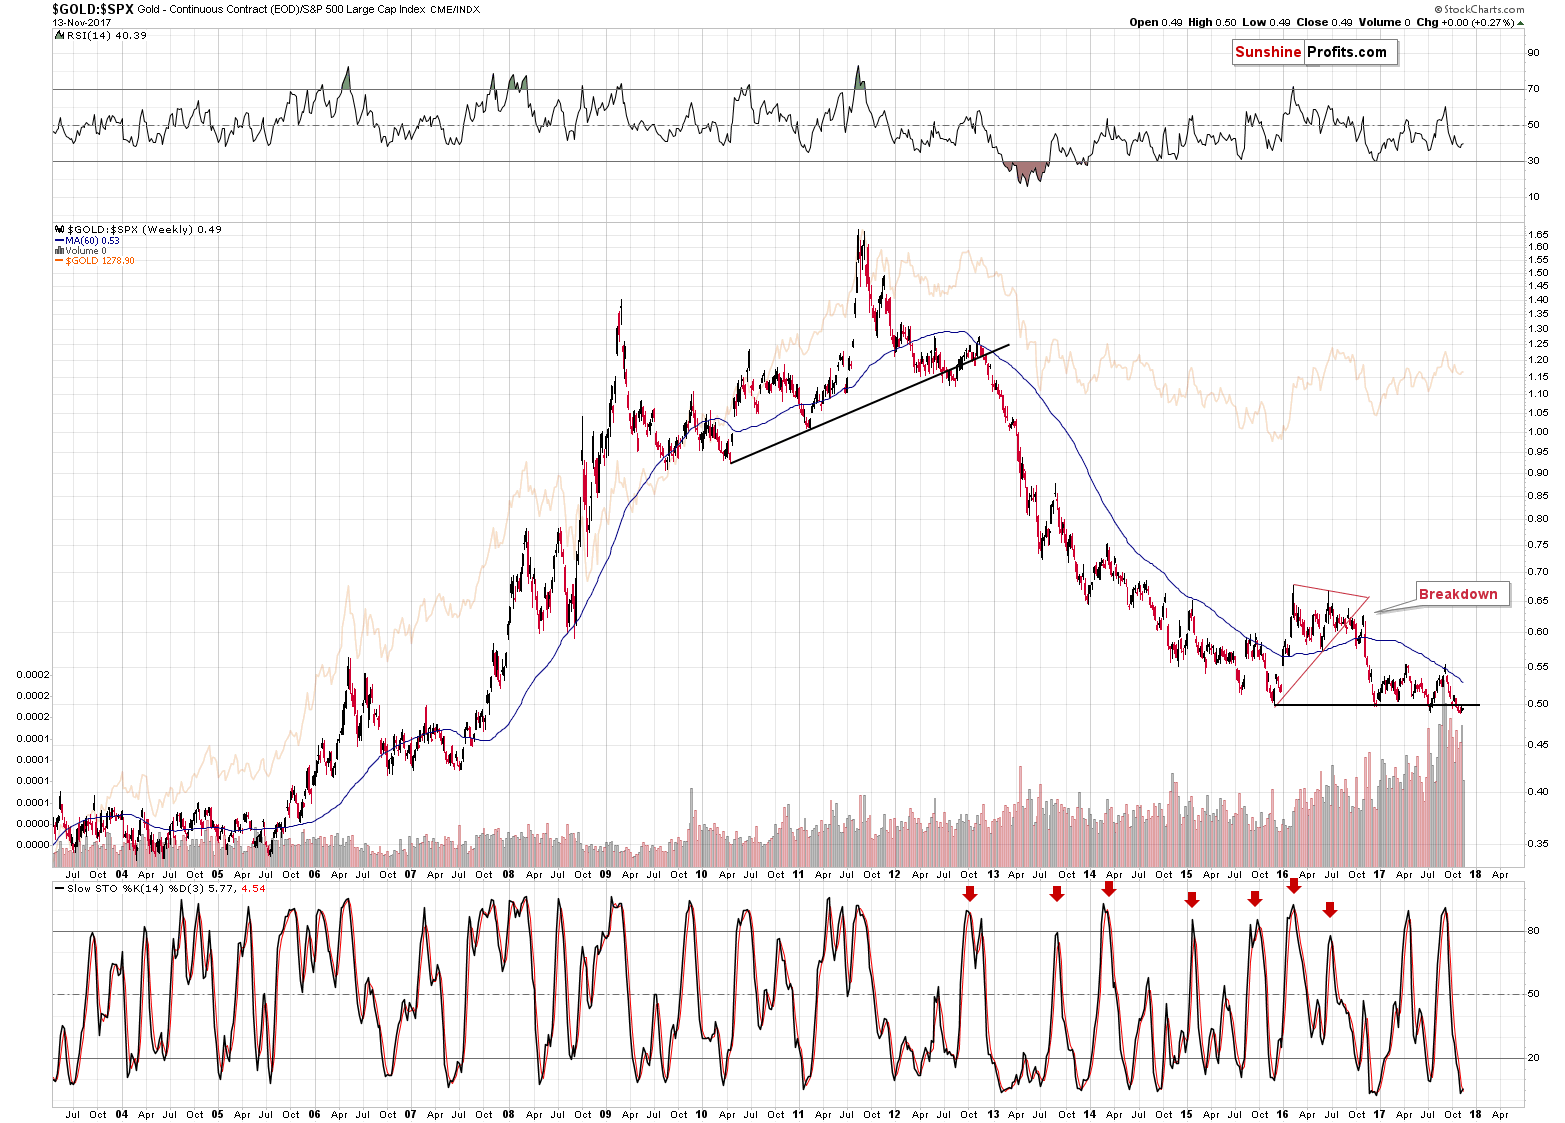
The gold to S&P 500 ratio is still only a little below its support/resistance line, so the breakdown could still be invalidated quite easily, but one should note that this breakdown is bigger and took longer than any previous one. So, the chance of a confirmation thereof and continuation of the decline are now bigger than they were in late 2016 and so far this year.
Before summarizing, we would like to provide you with a reply to a question that we recently received. We were asked to comment on the fact that the yearly volume in gold in 2016 was huge (even bigger than the one from 2011) and that the volume in gold so far this year is already bigger than in 2016. In particular, the question is if this is bullish, as both 2016 and 2017 were years when gold rallied. After all, an upswing on big volume is generally a bullish sign. This question was likely based on this article: http://www.swpcayman.com/news/commentary.php?u=buildup-gold-trading-volumes
In short, it doesn’t seem that it’s an important factor for the gold market’s outlook. It’s not even clear that it’s bullish at all.
The reason is provided by the context and there are multiple factors that make any bullish implications rather irrelevant:
- The volume was high in 2016 and 2017 and so was the price, but if we consider the starting and ending price of 2016 (and the intra-year high) and we consider the same for this year (taking the current price instead of the yearly closing price), we’ll see that the yearly performance is not a clear rally (a big bright candlestick on a yearly candlestick chart) - it’s a… reversal, especially in the case of 2016. In 2016 gold rallied from $1,060 to $1,377 only to close the year at about $1,152, invalidating most of the rally. Huge volume confirms the bearish implications of reversals, so the implications here are bearish rather than bullish. By the way, the months with the highest volume in both 2016 and 2017 were the ones when gold declined.
- Gold’s increase in yearly volume in terms of futures is not confirmed by yearly volume levels for the GLD ETF (this applies also to other precious metals ETFs, for instance PHYS and for the Central Fund of Canada). Yes, the volume for 2016 was higher than for 2015, but not as high as it was in 2010 or 2011. The 2017 performance is also far from spectacular - it appears that the 2017 volume for the GLD ETF will be lower than in 2016. Consequently, it could be the case that the increase in the gold futures’ volume is not suggesting anything very bullish for the gold market, but it simply shows an increase in the interest in the futures market. The following points seem to confirm it.
- Gold is not the only market where the futures volume moved to record highs. The same is the case with crude oil and copper. Why are the commodity futures’ volume soaring, but not the one for the GLD ETF? Because the likely common denominator is not the performance of gold, but the interest in the futures market.
- When gold futures’ volume previous increased substantially it meant that bigger declines were to be seen in the following months - this happened in 2008 and 2011. So, why would the move above the previous highs in the volume levels mean something else than a bigger decline this time? “This time is different” is often a costly phrase.
All in all, it doesn’t seem that the increase in the volume levels in the gold futures market is significant and it’s definitely not something to be viewed as bullish.
Summing up, the situation in the USD Index continues to support a short-term rally to approximately 96 and the precious metals’ and mining stocks’ new signals – along with multiple signs that we saw previously - point to lower PM prices in the near future.
The upcoming bottom is likely to be followed by a tradable rally, so we’re monitoring the market for confirmations and reliable signs of strength.
To be clear, the medium-term outlook remains bearish, especially that the analogy to the 2012-2013 decline remains in place and the previously discussed long-term signals remain in place: gold’s huge monthly volume, the analogy in the HUI Index, the analogy between the two most recent series of interest rate hikes, and the RSI signal from gold priced in the Japanese yen. However, it seems to be a good idea to take advantage of the upcoming short-term correction, should we get bullish confirmations from metals or miners.
As always, we will keep you – our subscribers – informed.
To summarize:
Trading capital (supplementary part of the portfolio; our opinion): Short positions (150% of the full position) in gold, silver and mining stocks are justified from the risk/reward perspective with the following stop-loss orders and exit price levels / profit-take orders:
- Gold: exit price: $1,218; stop-loss: $1,366; exit price for the DGLD ETN: $51.98; stop-loss for the DGLD ETN $38.74
- Silver: exit price: $15.82; stop-loss: $19.22; exit price for the DSLV ETN: $28.88; stop-loss for the DSLV ETN $17.93
- Mining stocks (price levels for the GDX ETF): exit price: $21.23; stop-loss: $26.34; exit price for the DUST ETF: $29.97; stop-loss for the DUST ETF $21.37
In case one wants to bet on junior mining stocks' prices (we do not suggest doing so – we think senior mining stocks are more predictable in the case of short-term trades – if one wants to do it anyway, we provide the details), here are the stop-loss details and exit prices:
- GDXJ ETF: exit price: $30.28; stop-loss: $45.31
- JDST ETF: exit price: $66.27; stop-loss: $43.12
Long-term capital (core part of the portfolio; our opinion): No positions (in other words: cash)
Insurance capital (core part of the portfolio; our opinion): Full position
Important Details for New Subscribers
Whether you already subscribed or not, we encourage you to find out how to make the most of our alerts and read our replies to the most common alert-and-gold-trading-related-questions.
Please note that the in the trading section we describe the situation for the day that the alert is posted. In other words, it we are writing about a speculative position, it means that it is up-to-date on the day it was posted. We are also featuring the initial target prices, so that you can decide whether keeping a position on a given day is something that is in tune with your approach (some moves are too small for medium-term traders and some might appear too big for day-traders).
Plus, you might want to read why our stop-loss orders are usually relatively far from the current price.
Please note that a full position doesn’t mean using all of the capital for a given trade. You will find details on our thoughts on gold portfolio structuring in the Key Insights section on our website.
As a reminder – “initial target price” means exactly that – an “initial” one, it’s not a price level at which we suggest closing positions. If this becomes the case (like it did in the previous trade) we will refer to these levels as levels of exit orders (exactly as we’ve done previously). Stop-loss levels, however, are naturally not “initial”, but something that, in our opinion, might be entered as an order.
Since it is impossible to synchronize target prices and stop-loss levels for all the ETFs and ETNs with the main markets that we provide these levels for (gold, silver and mining stocks – the GDX ETF), the stop-loss levels and target prices for other ETNs and ETF (among other: UGLD, DGLD, USLV, DSLV, NUGT, DUST, JNUG, JDST) are provided as supplementary, and not as “final”. This means that if a stop-loss or a target level is reached for any of the “additional instruments” (DGLD for instance), but not for the “main instrument” (gold in this case), we will view positions in both gold and DGLD as still open and the stop-loss for DGLD would have to be moved lower. On the other hand, if gold moves to a stop-loss level but DGLD doesn’t, then we will view both positions (in gold and DGLD) as closed. In other words, since it’s not possible to be 100% certain that each related instrument moves to a given level when the underlying instrument does, we can’t provide levels that would be binding. The levels that we do provide are our best estimate of the levels that will correspond to the levels in the underlying assets, but it will be the underlying assets that one will need to focus on regarding the signs pointing to closing a given position or keeping it open. We might adjust the levels in the “additional instruments” without adjusting the levels in the “main instruments”, which will simply mean that we have improved our estimation of these levels, not that we changed our outlook on the markets. We are already working on a tool that would update these levels on a daily basis for the most popular ETFs, ETNs and individual mining stocks.
Our preferred ways to invest in and to trade gold along with the reasoning can be found in the how to buy gold section. Additionally, our preferred ETFs and ETNs can be found in our Gold & Silver ETF Ranking.
As a reminder, Gold & Silver Trading Alerts are posted before or on each trading day (we usually post them before the opening bell, but we don't promise doing that each day). If there's anything urgent, we will send you an additional small alert before posting the main one.
=====
Latest Free Trading Alerts:
On Friday, there was a flash crash in the gold market. What happened and what does it mean?
4 Million Ounces of Gold Traded in 15 Minutes
=====
Hand-picked precious-metals-related links:
PRECIOUS-Gold hits one-week low as higher U.S. yields weigh
Gold’s Future Path Looks Distinctly Rocky
Dalio's Bridgewater Boosts Gold Holdings in SPDR, iShares
Strike shuts down Harmony's Kusasalethu gold mine
116 Internet Shutdowns Show Why Physical Gold Is Ultimate Protection
=====
In other news:
Dallas Fed's Kaplan 'actively considering' backing December rate rise: FT
Futures mixed, eyes on Fed speakers
U.K. Inflation Holds at 3% as Cheaper Fuel Offsets Food Prices
German growth surprise lifts Europe as China subdues Asia
The ECB Needs an Inflation Plan, Just in Case
ECB to only ask banks for extra capital for bad loans if talks fail
DEUTSCHE BANK: Something 'very unusual' is happening in markets
Fed may need 'extreme' policy to deal with future shocks: Evans
Venezuela just defaulted, moving deeper into crisis
Big money is coming to bitcoin: ex-Fortress executive Novogratz
=====
Thank you.
Sincerely,
Przemyslaw Radomski, CFA
Founder, Editor-in-chief, Gold & Silver Fund Manager
Gold & Silver Trading Alerts
Forex Trading Alerts
Oil Investment Updates
Oil Trading Alerts

