

Briefly: In our opinion, full (150% of the regular full position) speculative short positions in gold, silver and mining stocks are justified from the risk/reward perspective at the moment of publishing this alert.
In yesterday’s alert we discussed why the implications of the recent action in mining stocks were so important and yesterday’s session was in tune with our expectations. The signal from mining stocks is quite clear and while it is not perfectly confirmed yet, the consequences that are already in place should not be ignored.
The thing is that gold stocks not only did not invalidate the previously completed head-and-shoulders pattern, but they declined further, and they did it without gold’s help.
If, based on the Friday’s session, gold miners were suggesting that lower prices were likely, they are currently screaming it. Let’s take a look at the HUI Index chart for details (chart courtesy of http://stockcharts.com).
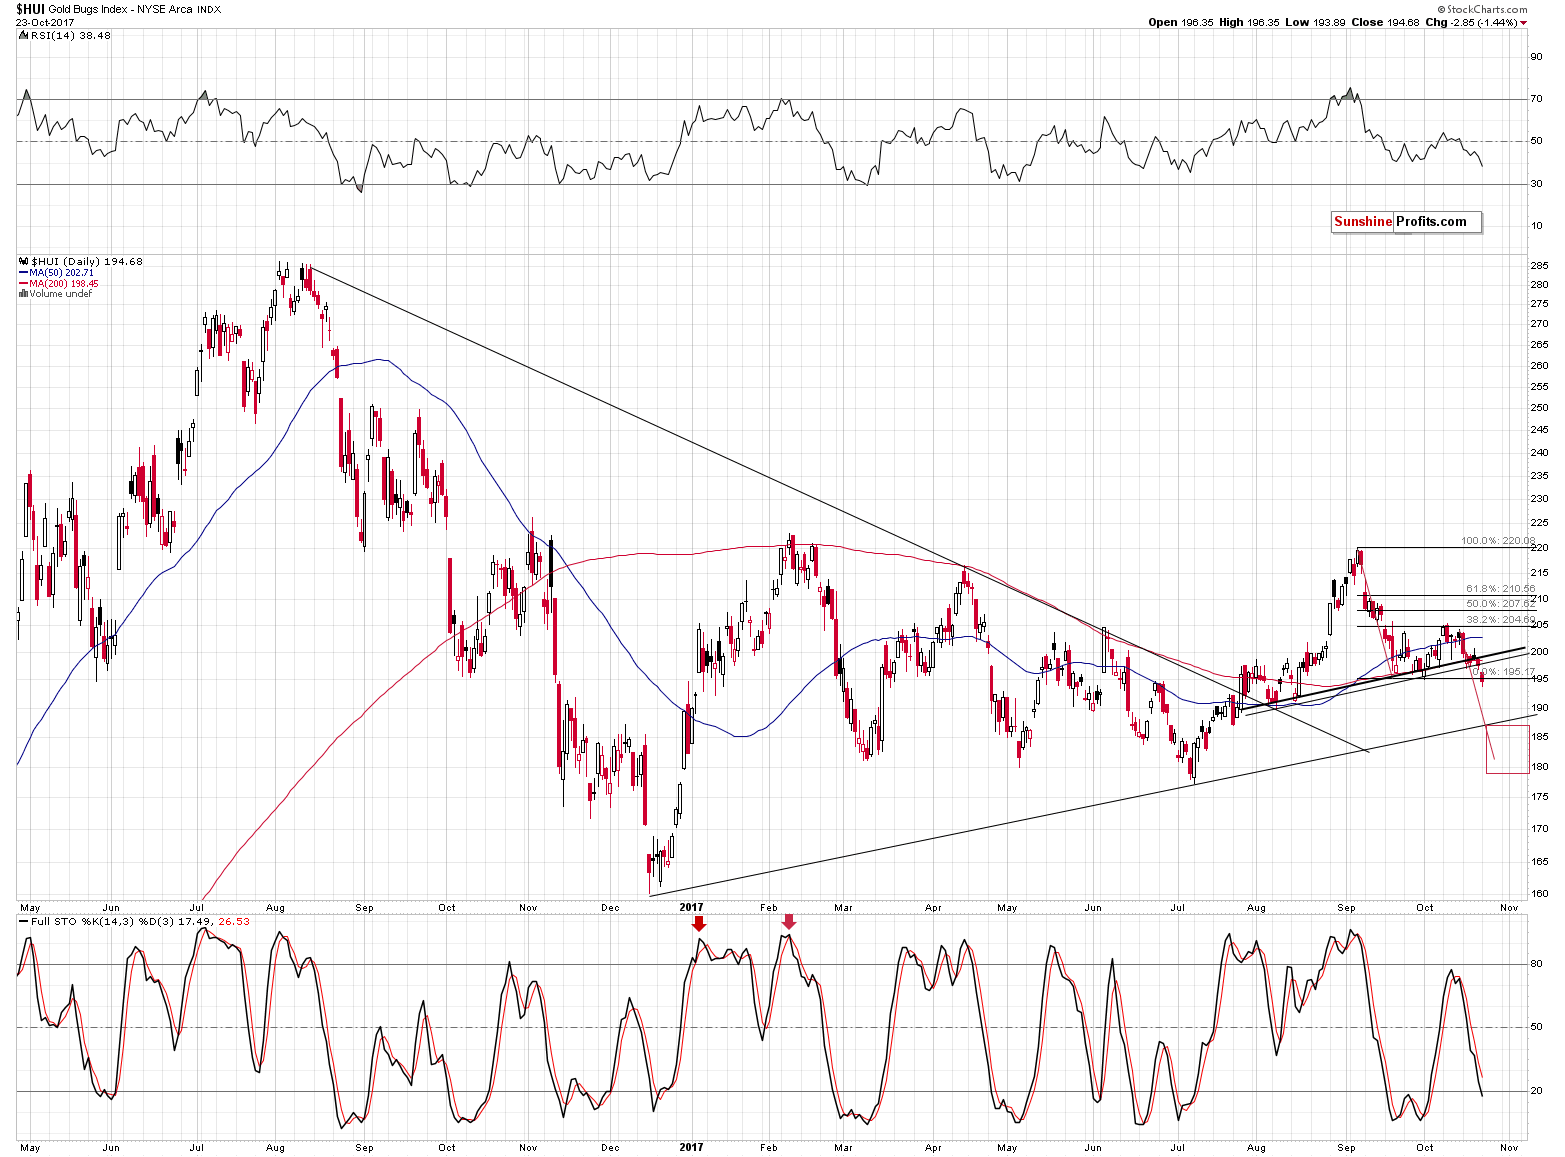
Gold stocks closed the session visibly below both neck levels and below the September and October lows. That’s a classic bearish confirmation. What’s not visible above, but very important in this case, is that gold didn’t decline.
Investors and traders are often short-sighted and see a decline as bearish, a rally as bullish without analyzing these moves more thoroughly (on a side note, this is particularly interesting, because rallies have to be seen before tops and declines have to be seen before bottoms, so the above should be counter-intuitive). In this case, we have a situation in which a lack of movement is not neutral, but has important and very strong implications for the short term.
As is usually the case, the context is the key thing to keep in mind and right now we have gold stocks that are declining and breaking lower even without gold’s help and that’s a very strong bearish sign for the following days and weeks.
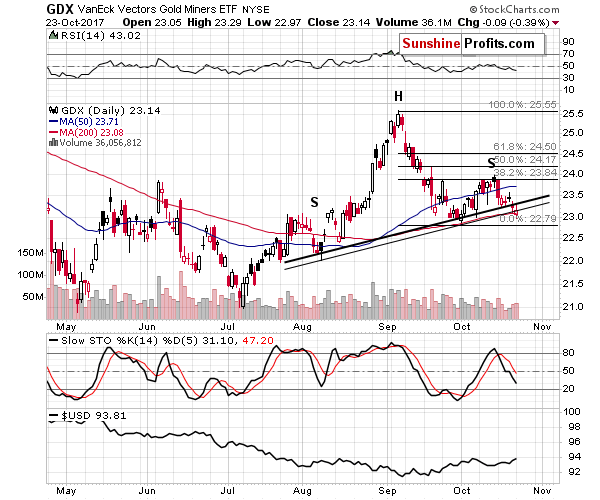
The GDX ETF chart shows that the volume was not low, so the decline is likely the true direction in which miners are currently heading.
All in all, the action in miners made the short-term outlook even more bearish even though gold and silver didn’t do much yesterday.
What about the USD Index?
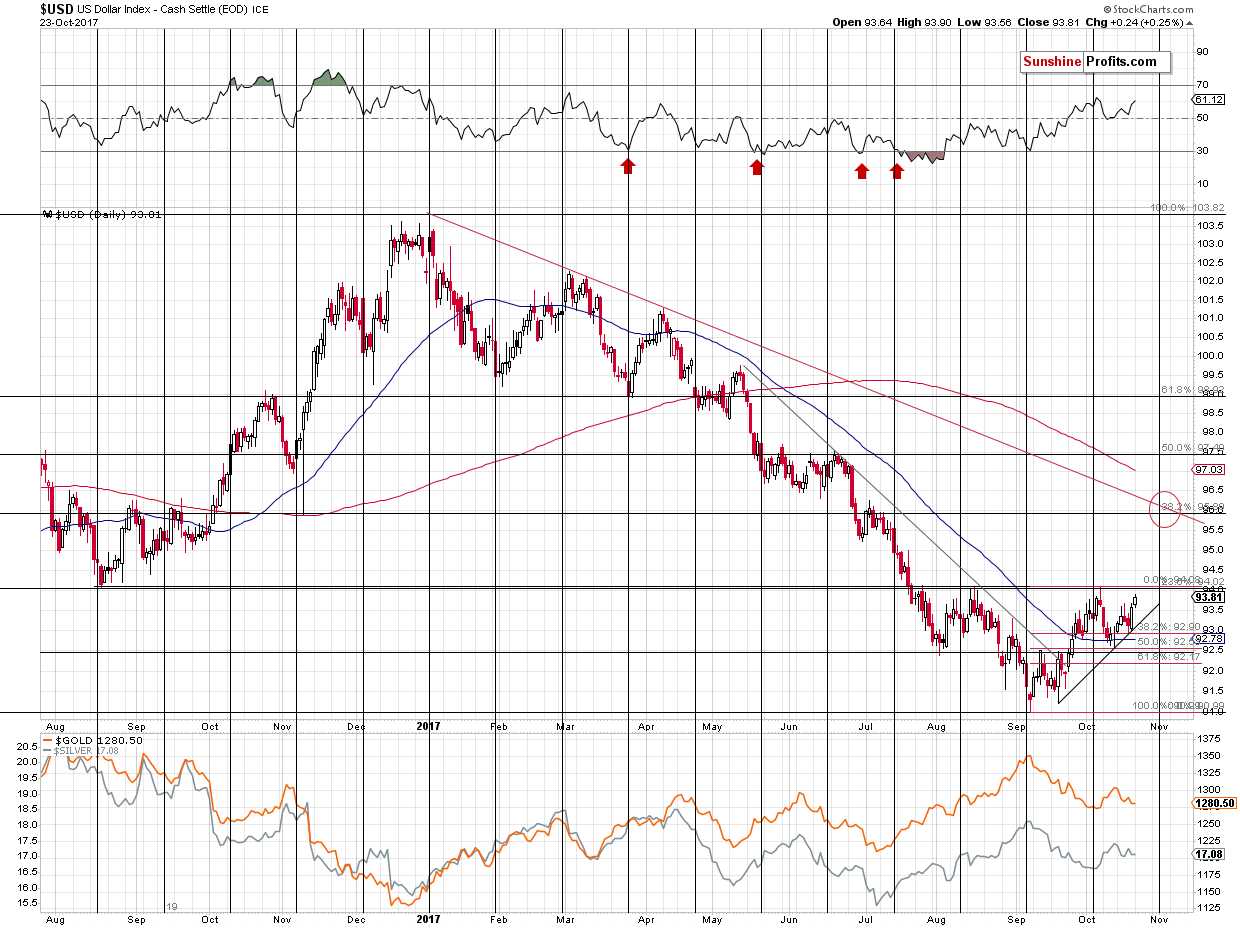
It moved higher and is moving back and forth between 93.8 and 93.9 at the moment of writing these words. There was no breakout above the 94 level, so our previous comments on the above chart remain up-to-date:
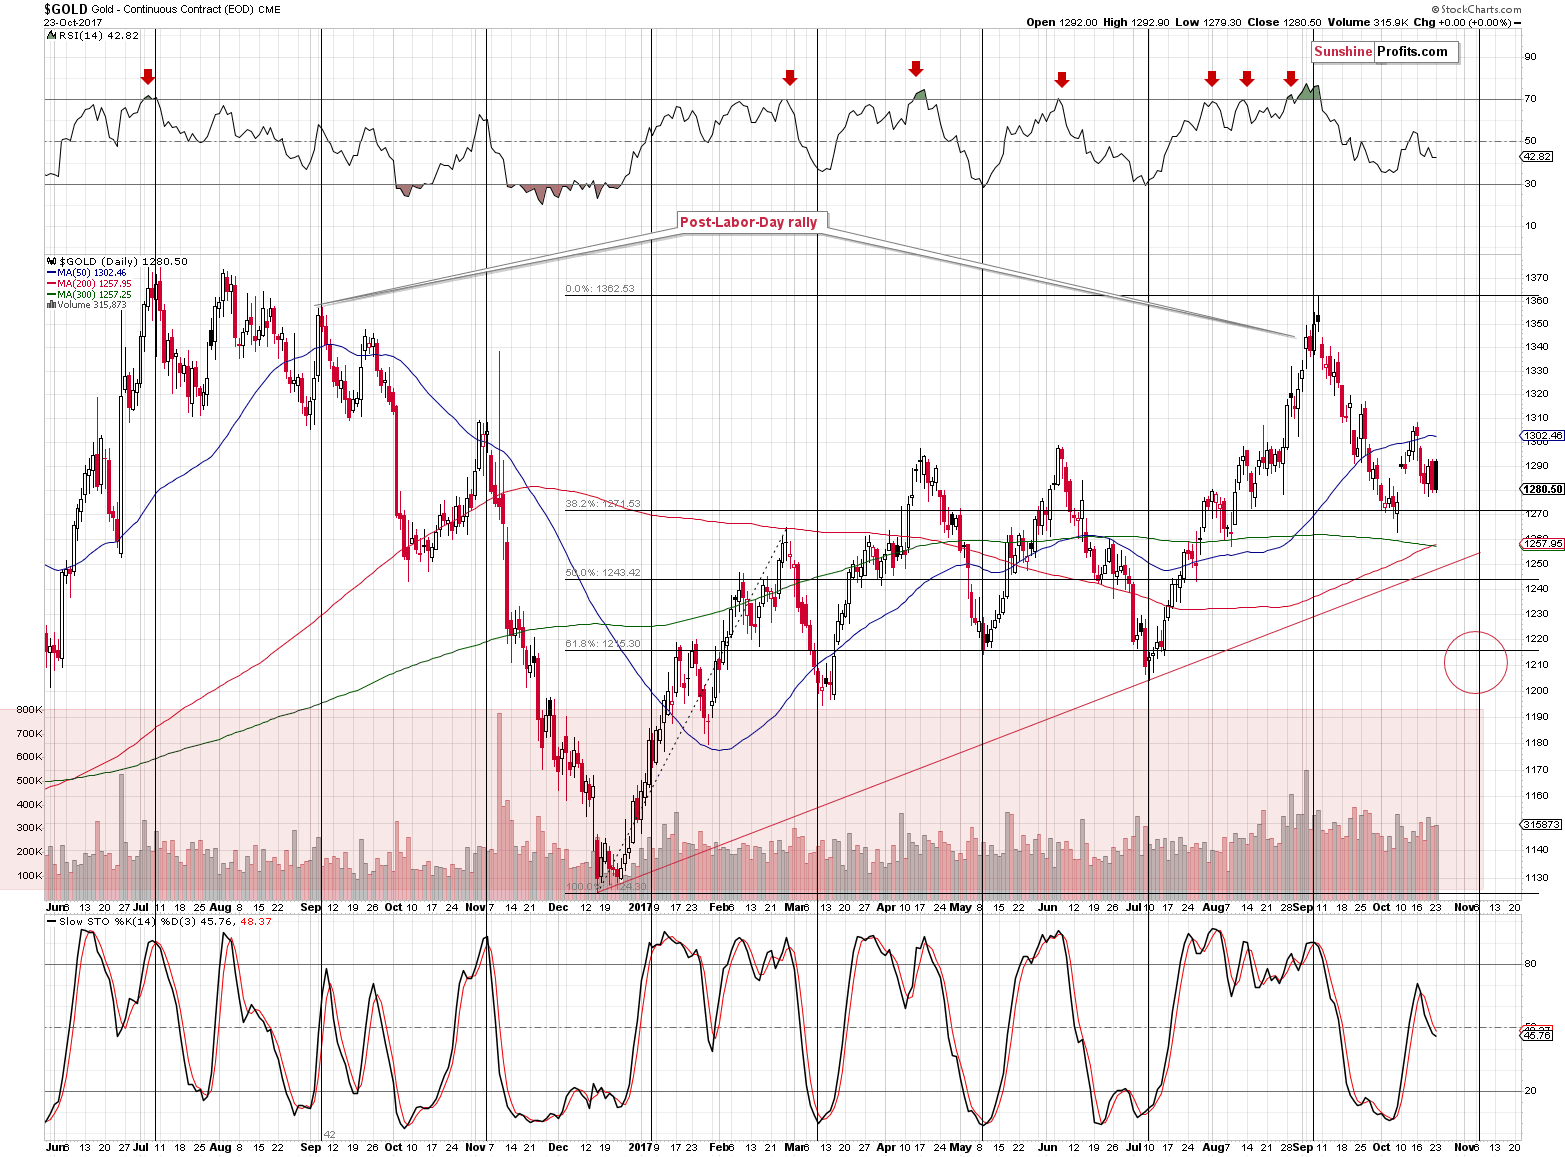
(…) we explained why the $1,200 - $1,220 is likely the next step for gold and the reason was that several support levels coincide there and it is also strengthened by the turning point.
Applying the same methodology to the USD Index, we arrive at the 95.5 – 96.5 range with the 96 level being the most likely target. The above is in tune with the reverse-head-and-shoulders formation (if it is completed, that is), the 38.2% Fibonacci retracement level, the July high and the USD’s turning point.
Why is this important if one aims to trade the precious metals market and not currencies? Because if the USD Index reaches its target before gold does, it could indicate that a turnaround in both the USD and gold will take place anyway and thus it might be a good idea to limit the exposure to the precious metals market at that time. It could also work the other way, if gold reaches its target, but the USD Index doesn’t and we see no signs of a reversal in the gold market other than the target being reached, then perhaps gold will have further to fall before the reversal is seen. All in all, being aware of what’s going on in the USD Index helps in determining what’s next for gold and the rest of the precious metals sector.
Now, to be objective, there is also a possibility of seeing another temporary (!) decline in the USD Index, which would not invalidate the bigger trend. If the reverse-head-and-shoulders formation is to be completely symmetrical, then we might see another move low slightly below 92.5, because that would be in tune with what happened in early August. The rally in the USD that we saw in the first half of August took the form of a zigzag and thus the October decline could also take this form. If this happens, precious metals would probably move higher once again while miners would continue to lag. This move seems too small to adjust the position for it, but let’s keep the above possibility in mind – it’s not something that should come as a surprise. The outlook for the USD remains bullish nonetheless and the opposite is the case for gold.
In the September 13 Gold & Silver Trading Alert, we wrote the following:
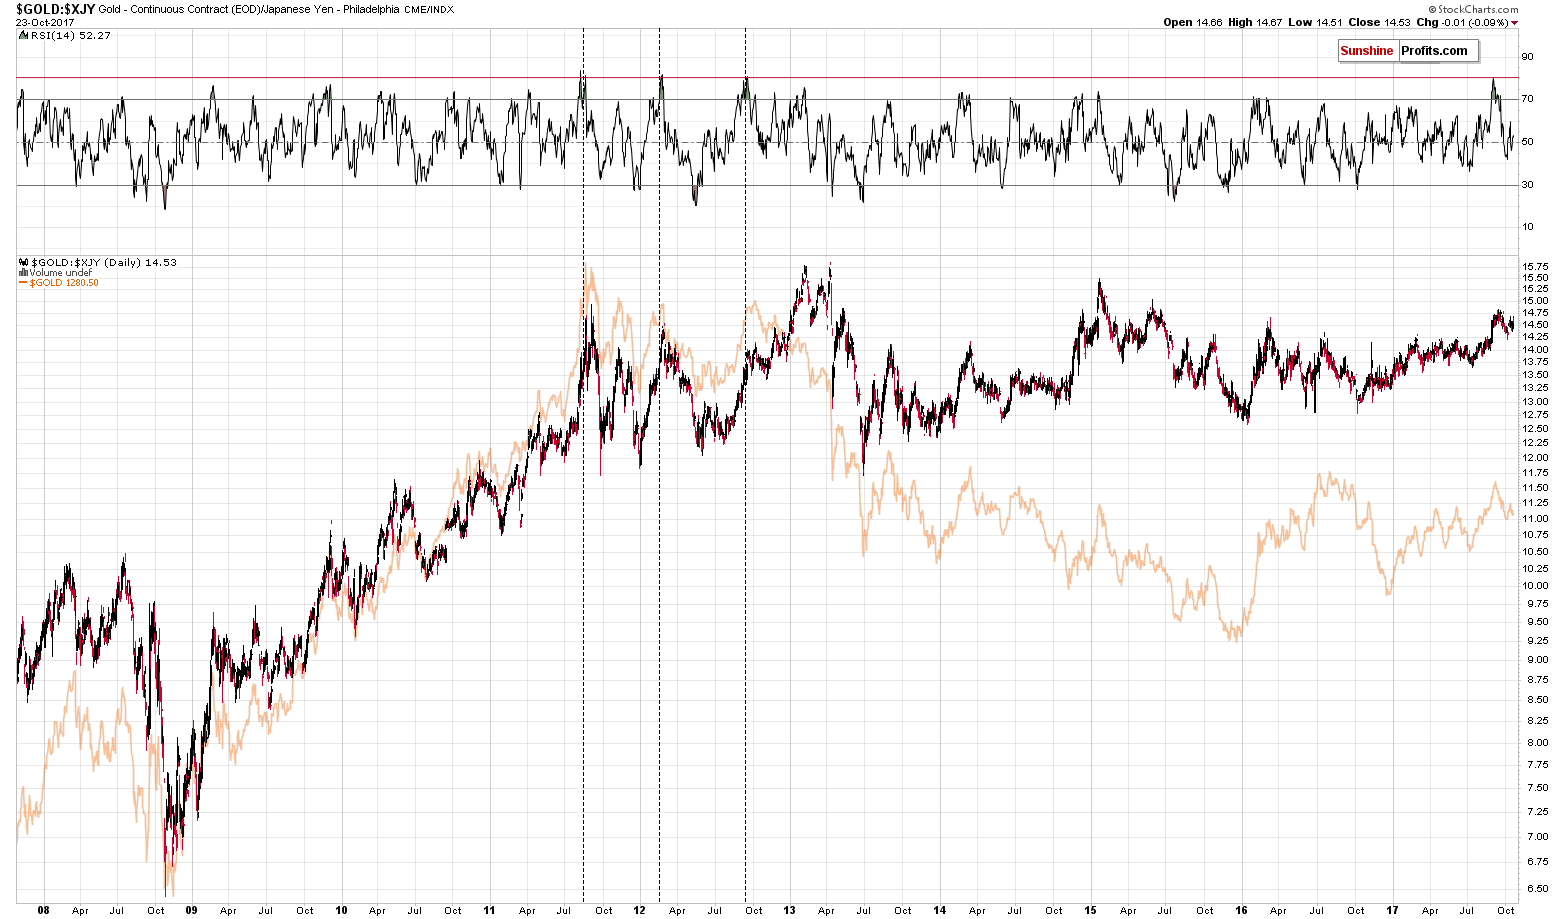
In this case, the price of gold doesn’t show a downtrend, but a big consolidation and the likely reason is the massive money printing by the Japanese monetary authorities. Still, even in the case of sideways trading, the more short-term moves in both the yen and USD terms are aligned. Consequently, the sell signals coming from the above chart are also important for our regular USD-oriented gold analysis.
What appears quite extraordinary on the above chart is the current position of the RSI indicator. It just moved to about the 80 level and then moved back down (moving even below 70). Such strong performance of the RSI is not something that we see every month or even every year. In fact, in the past decade, there were only 3 similar cases, when the RSI behaved in a similar manner. They took place once in 2011 and twice in 2012. The first case was the 2011 top and the other two cases were two out of three other key tops above $1,750.
We recently wrote that investors appear to be reacting to the breakout above $1,300, just like they were reacting to the breakout above $1,900. The above analogy in gold in terms of the Japanese yen seems to confirm it.
What happened after the RSI spikes in 2011 and 2012? Gold moved higher slightly and then started a big decline. This decline was not necessarily without periodic corrective upswings, but the overall size of the declines was huge.
What happened after we published the above? Gold moved higher only a little after which it started a decline. We’ve seen a corrective upswing recently, but the point that we would like to emphasize today is that all 3 previous declines that we saw after analogous signals from the RSI were much bigger than what we have seen in gold so far. Consequently, it seems that the implications of this signal haven’t completely played out and thus gold is likely to decline much more. This is in tune with other signals that we’ve been discussing recently (i.a. gold’s huge monthly volume, the analogy in the HUI Index, the analogy between the two most recent series of interest rate hikes, and a breakout in Nikkei).
Summing up, there are multiple signals pointing to much lower precious metals prices in the coming weeks and months and we’ve just seen a strong signal pointing to a decline also in the short term.
As far as the following weeks are concerned, it seems that we could see another rebound during the decline, but not likely until gold moves to the $1,200 - $1,220 range, which is likely to take place in the first half of November. The analogous range for the USD Index is 95.5 – 96.5 with the 96 level being the most likely target.
As always, we will keep you – our subscribers – informed.
To summarize:
Trading capital (supplementary part of the portfolio; our opinion): Short positions (150% of the full position) in gold, silver and mining stocks are justified from the risk/reward perspective with the following stop-loss orders and exit price levels / profit-take orders:
- Gold: exit price: $1,218; stop-loss: $1,366; exit price for the DGLD ETN: $51.98; stop-loss for the DGLD ETN $38.74
- Silver: exit price: $15.82; stop-loss: $19.22; exit price for the DSLV ETN: $28.88; stop-loss for the DSLV ETN $17.93
- Mining stocks (price levels for the GDX ETF): exit price: $21.23; stop-loss: $26.34; exit price for the DUST ETF: $29.97; stop-loss for the DUST ETF $21.37
In case one wants to bet on junior mining stocks' prices (we do not suggest doing so – we think senior mining stocks are more predictable in the case of short-term trades – if one wants to do it anyway, we provide the details), here are the stop-loss details and exit prices:
- GDXJ ETF: exit price: $30.28; stop-loss: $45.31
- JDST ETF: exit price: $66.27; stop-loss: $43.12
Long-term capital (core part of the portfolio; our opinion): No positions (in other words: cash)
Insurance capital (core part of the portfolio; our opinion): Full position
Important Details for New Subscribers
Whether you already subscribed or not, we encourage you to find out how to make the most of our alerts and read our replies to the most common alert-and-gold-trading-related-questions.
Please note that the in the trading section we describe the situation for the day that the alert is posted. In other words, it we are writing about a speculative position, it means that it is up-to-date on the day it was posted. We are also featuring the initial target prices, so that you can decide whether keeping a position on a given day is something that is in tune with your approach (some moves are too small for medium-term traders and some might appear too big for day-traders).
Plus, you might want to read why our stop-loss orders are usually relatively far from the current price.
Please note that a full position doesn’t mean using all of the capital for a given trade. You will find details on our thoughts on gold portfolio structuring in the Key Insights section on our website.
As a reminder – “initial target price” means exactly that – an “initial” one, it’s not a price level at which we suggest closing positions. If this becomes the case (like it did in the previous trade) we will refer to these levels as levels of exit orders (exactly as we’ve done previously). Stop-loss levels, however, are naturally not “initial”, but something that, in our opinion, might be entered as an order.
Since it is impossible to synchronize target prices and stop-loss levels for all the ETFs and ETNs with the main markets that we provide these levels for (gold, silver and mining stocks – the GDX ETF), the stop-loss levels and target prices for other ETNs and ETF (among other: UGLD, DGLD, USLV, DSLV, NUGT, DUST, JNUG, JDST) are provided as supplementary, and not as “final”. This means that if a stop-loss or a target level is reached for any of the “additional instruments” (DGLD for instance), but not for the “main instrument” (gold in this case), we will view positions in both gold and DGLD as still open and the stop-loss for DGLD would have to be moved lower. On the other hand, if gold moves to a stop-loss level but DGLD doesn’t, then we will view both positions (in gold and DGLD) as closed. In other words, since it’s not possible to be 100% certain that each related instrument moves to a given level when the underlying instrument does, we can’t provide levels that would be binding. The levels that we do provide are our best estimate of the levels that will correspond to the levels in the underlying assets, but it will be the underlying assets that one will need to focus on regarding the signs pointing to closing a given position or keeping it open. We might adjust the levels in the “additional instruments” without adjusting the levels in the “main instruments”, which will simply mean that we have improved our estimation of these levels, not that we changed our outlook on the markets. We are already working on a tool that would update these levels on a daily basis for the most popular ETFs, ETNs and individual mining stocks.
Our preferred ways to invest in and to trade gold along with the reasoning can be found in the how to buy gold section. Additionally, our preferred ETFs and ETNs can be found in our Gold & Silver ETF Ranking.
As a reminder, Gold & Silver Trading Alerts are posted before or on each trading day (we usually post them before the opening bell, but we don't promise doing that each day). If there's anything urgent, we will send you an additional small alert before posting the main one.
=====
Latest Free Trading Alerts:
On Sunday, Abe won the snap election in Japan. What does it mean for the gold market?
On Friday, crude oil bounced off session’s low and closed the previous week slightly below $52. Did it change anything in the short term?
Crude Oil – Major Resistances Hold
=====
Hand-picked precious-metals-related links:
PRECIOUS-Gold slips on nerves ahead of Fed chair decision
India’s biggest tax reform is choking the country’s big fat wedding industry
=====
In other news:
Dollar Extends Gain as Bonds Drop; Gold Declines: Markets Wrap
Stocks mostly rise amid Japanese election, US tax hopes
German bank regulator urges EU to be ready for Brexit cliff edge
BoE deputy governor cautious about November rate hike; eurozone PMI growth slows – business live
China has grand ambitions to dethrone the dollar. It may make a powerful move this year
The founder of the world's largest hedge fund just shared brutal analysis of the US economy
Goldman Sachs Now See $7,050 Copper Prices in Part Because of Tesla's Rise
=====
Thank you.
Sincerely,
Przemyslaw Radomski, CFA
Founder, Editor-in-chief, Gold & Silver Fund Manager
Gold & Silver Trading Alerts
Forex Trading Alerts
Oil Investment Updates
Oil Trading Alerts

