

Briefly: In our opinion, full (150% of the regular full position) speculative short positions in gold, silver and mining stocks are justified from the risk/reward perspective at the moment of publishing this alert.
Just a few hours ago we wrote an analytical piece, which was supposed to be the opening part of tomorrow’s alert, but based on where the HUI Index currently is, we thought that it will be more useful to you today. So, here’s the first part of tomorrow’s alert:
===
Before gold stocks reversed in a profound way, we wrote that this was possible given the extremely low-volume session. Their rally is not significant though, at least not yet. In yesterday’s alert, we wrote what price levels one might expect in case of gold and in today’s analysis, we will discuss the surprisingly fitting analogy to the previous price pattern in the HUI Index and we’ll feature the roadmap that this analogy provides. How high will miners rally shortly and what’s likely to happen next? Let’s find out by taking a closer look at the charts, starting with the HUI Index (chart courtesy of http://stockcharts.com).
Let’s start with quoting what we wrote in the September 25 Gold & Silver Trading Alert about the analogy that nobody else noticed (if you read somewhere about it, please let us know - we’ll correct ourselves):
The pace of decline is not the only thing that makes the two situations (the 2016 top – today and the distance between two 2008 tops) alike.
Please take a look at the charts below without looking at the time axis.
Identical? No. Similar? You bet. A decline for about 1/3 of the time, then a rally, then a few local bottoms and another rally to the previous local high. The performance of the red moving average is also similar. The more similar a given pattern is, the more likely the follow-up action is to be alike as well.
Both charts feature the HUI Index. The thing that makes them hard to spot for the average investor and analyst is that they are not created based on the same candlestick type. The first chart is based on daily candlesticks and the second one is based on the weekly ones. The first chart shows the HUI’s performance in a few months and the second features its performance in more than a year. Most people don’t know that the markets have a fractal nature and that they often are self-similar (roughly speaking, the pattern becomes similar once you zoom in or zoom out).
The fact that both patterns were preceded by sharp rallies in the HUI Index further increases the credibility of the analogy.
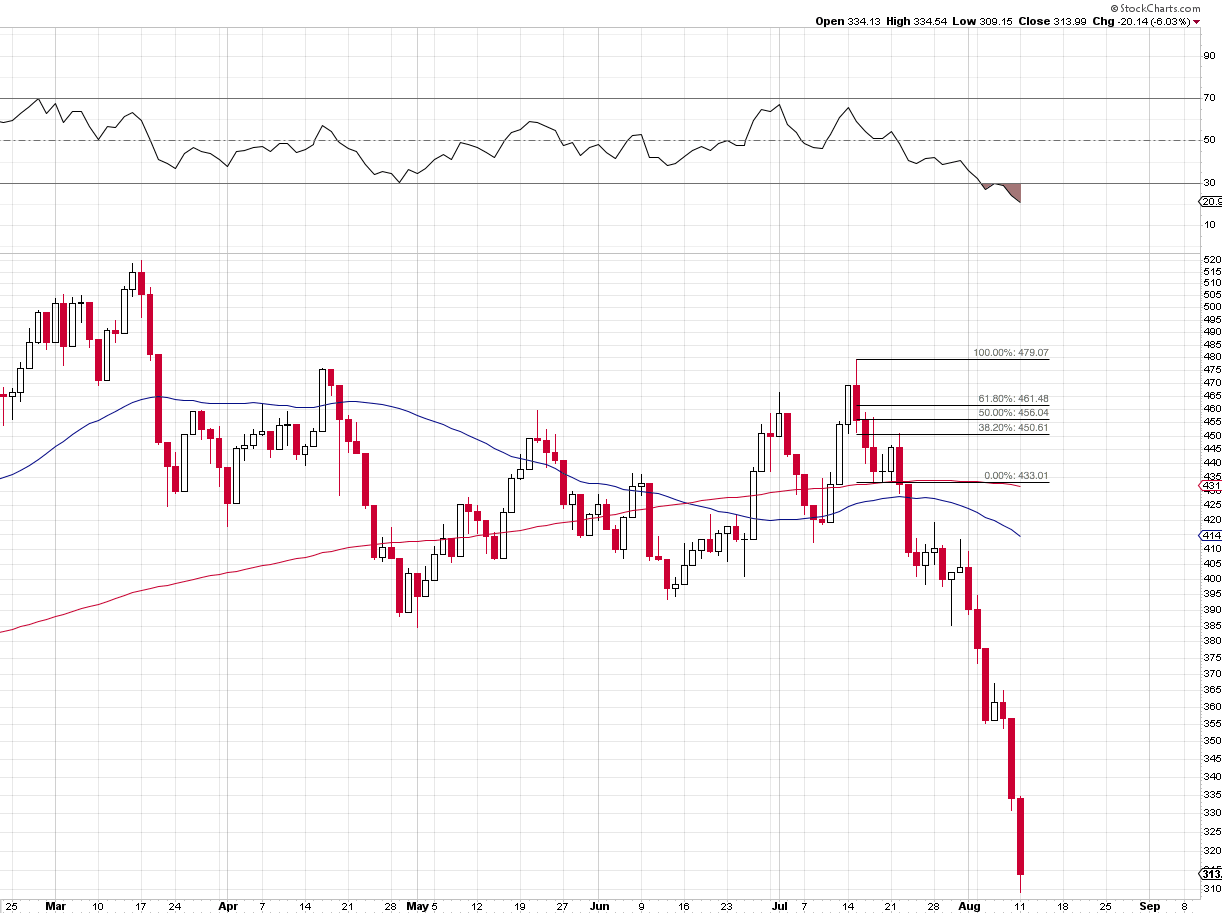
What happened in 2008 after the cut-off point of the above chart? The HUI Index declined by almost 300 points in a very sharp manner. Consequently, based on the above self-similar pattern, we’re likely to see a big and sharp move lower relatively soon – it’s likely that it’s already underway.
The analogy that we described in the opening paragraph of today’s alert is the above-described analogy along with what happened since the above was posted.
Let’s see what changed.
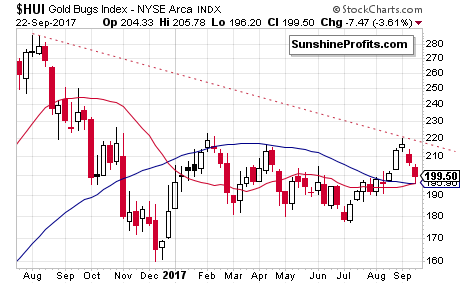
Gold stocks declined for 3 weeks, reached one of the classic moving averages and then started to move a bit higher.
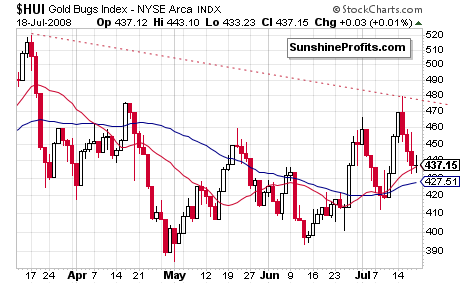
What happened in 2008?
Gold stocks declined for 3 days, reached one of the classic moving averages and then started to move a bit higher.
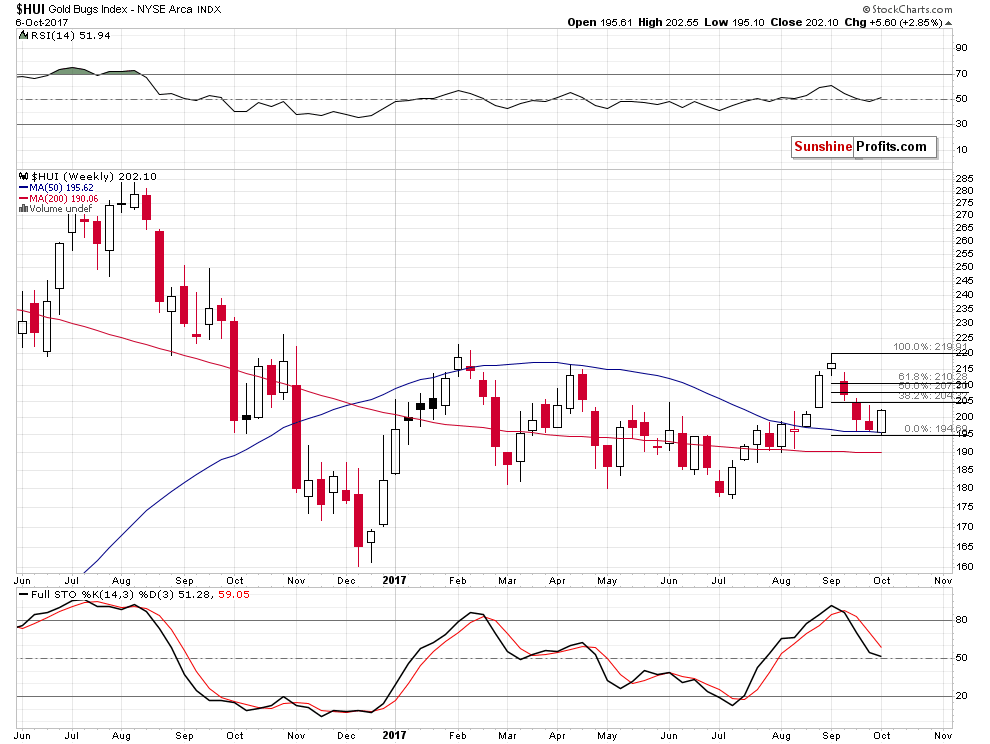
The week-to-day translation seems to be working in a near-perfect manner, so gold stocks could top more or less where they topped in 2008 – at the 38.2% Fibonacci retracement level based on the previous short-term decline.
Applying this technique to the current situation provides us with a target between 204 and 205. Consequently, even if the HUI Index moves to 205 or so, it will remain in perfect tune with what happened at the beginning of the most epic decline of the past decade.
===
Now you see why we decided to send you the above today – the HUI Index was just a little below 205. Consequently, while there could be more short-term upside – nobody can rule it out – the outlook here is not as bullish as it might appear at the first sight. In fact, the rally might already be over or close to being over.
As always, we will keep you – our subscribers – informed.
To summarize:
Trading capital (supplementary part of the portfolio; our opinion): Short positions (150% of the full position) in gold, silver and mining stocks are justified from the risk/reward perspective with the following stop-loss orders and initial target price levels / profit-take orders:
- Gold: initial target price level: $1,063; stop-loss: $1,366; initial target price for the DGLD ETN: $81.88; stop-loss for the DGLD ETN $38.74
- Silver: initial target price: $13.12; stop-loss: $19.22; initial target price for the DSLV ETN: $46.18; stop-loss for the DSLV ETN $17.93
- Mining stocks (price levels for the GDX ETF): initial target price: $9.34; stop-loss: $26.34; initial target price for the DUST ETF: $143.56; stop-loss for the DUST ETF $21.37
In case one wants to bet on junior mining stocks' prices (we do not suggest doing so – we think senior mining stocks are more predictable in the case of short-term trades – if one wants to do it anyway, we provide the details), here are the stop-loss details and initial target prices:
- GDXJ ETF: initial target price: $14.13; stop-loss: $45.31
- JDST ETF: initial target price: $417.04; stop-loss: $43.12
Long-term capital (core part of the portfolio; our opinion): No positions (in other words: cash)
Insurance capital (core part of the portfolio; our opinion): Full position
Important Details for New Subscribers
Whether you already subscribed or not, we encourage you to find out how to make the most of our alerts and read our replies to the most common alert-and-gold-trading-related-questions.
Please note that the in the trading section we describe the situation for the day that the alert is posted. In other words, it we are writing about a speculative position, it means that it is up-to-date on the day it was posted. We are also featuring the initial target prices, so that you can decide whether keeping a position on a given day is something that is in tune with your approach (some moves are too small for medium-term traders and some might appear too big for day-traders).
Plus, you might want to read why our stop-loss orders are usually relatively far from the current price.
Please note that a full position doesn’t mean using all of the capital for a given trade. You will find details on our thoughts on gold portfolio structuring in the Key Insights section on our website.
As a reminder – “initial target price” means exactly that – an “initial” one, it’s not a price level at which we suggest closing positions. If this becomes the case (like it did in the previous trade) we will refer to these levels as levels of exit orders (exactly as we’ve done previously). Stop-loss levels, however, are naturally not “initial”, but something that, in our opinion, might be entered as an order.
Since it is impossible to synchronize target prices and stop-loss levels for all the ETFs and ETNs with the main markets that we provide these levels for (gold, silver and mining stocks – the GDX ETF), the stop-loss levels and target prices for other ETNs and ETF (among other: UGLD, DGLD, USLV, DSLV, NUGT, DUST, JNUG, JDST) are provided as supplementary, and not as “final”. This means that if a stop-loss or a target level is reached for any of the “additional instruments” (DGLD for instance), but not for the “main instrument” (gold in this case), we will view positions in both gold and DGLD as still open and the stop-loss for DGLD would have to be moved lower. On the other hand, if gold moves to a stop-loss level but DGLD doesn’t, then we will view both positions (in gold and DGLD) as closed. In other words, since it’s not possible to be 100% certain that each related instrument moves to a given level when the underlying instrument does, we can’t provide levels that would be binding. The levels that we do provide are our best estimate of the levels that will correspond to the levels in the underlying assets, but it will be the underlying assets that one will need to focus on regarding the signs pointing to closing a given position or keeping it open. We might adjust the levels in the “additional instruments” without adjusting the levels in the “main instruments”, which will simply mean that we have improved our estimation of these levels, not that we changed our outlook on the markets. We are already working on a tool that would update these levels on a daily basis for the most popular ETFs, ETNs and individual mining stocks.
Our preferred ways to invest in and to trade gold along with the reasoning can be found in the how to buy gold section. Additionally, our preferred ETFs and ETNs can be found in our Gold & Silver ETF Ranking.
As a reminder, Gold & Silver Trading Alerts are posted before or on each trading day (we usually post them before the opening bell, but we don't promise doing that each day). If there's anything urgent, we will send you an additional small alert before posting the main one.
Thank you.
Sincerely,
Przemyslaw Radomski, CFA
Founder, Editor-in-chief, Gold & Silver Fund Manager
Gold & Silver Trading Alerts
Forex Trading Alerts
Oil Investment Updates
Oil Trading Alerts

