

Briefly: in our opinion, full (300% of the regular position size) speculative short positions in mining stocks are justified from the risk/reward point of view at the moment of publishing this Alert.
Some things changed based on the very recent price action (USD’s breakdown) and some things didn’t (gold confirmed its own breakdown). What does this imply to us?... Nothing. The bearish outlook for the following weeks (perhaps even a few months) for the precious metals sector remains intact.
Let’s start by looking at the USD Index.
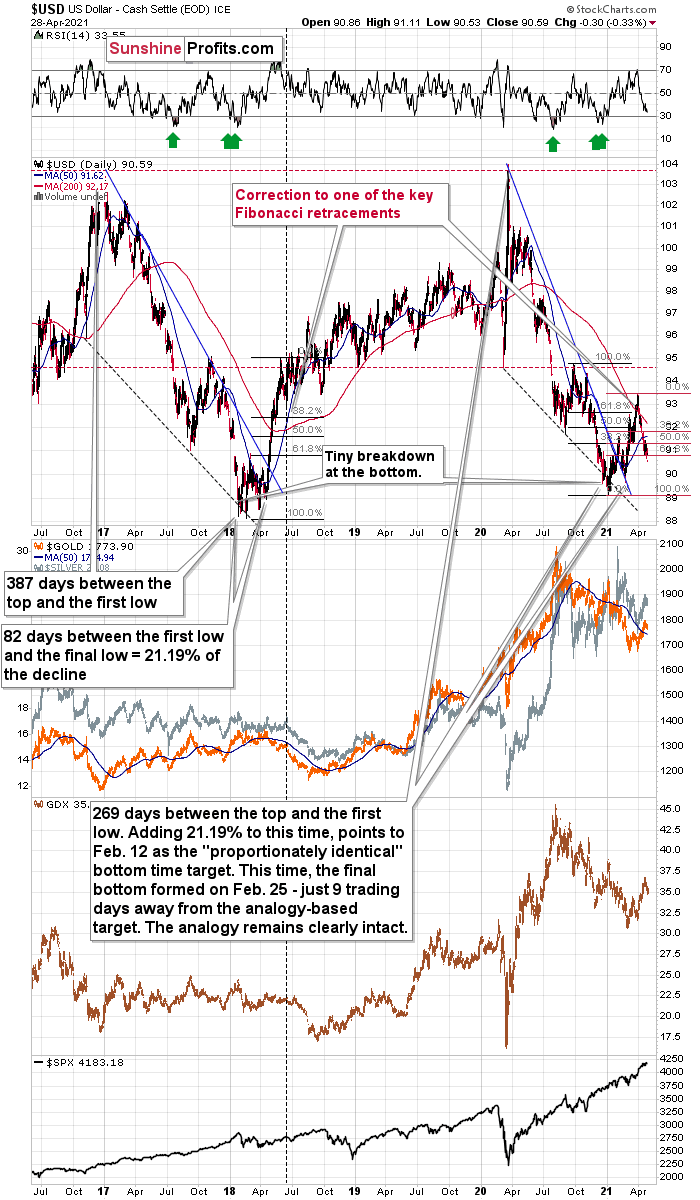
On the above chart you can see that the USD Index just broke (and closed) at a new monthly low. And you can also see that gold didn’t move to a new monthly high. In fact, it was not even close to doing so. This is a clearly bearish sign for gold.
And what about the USD Index?
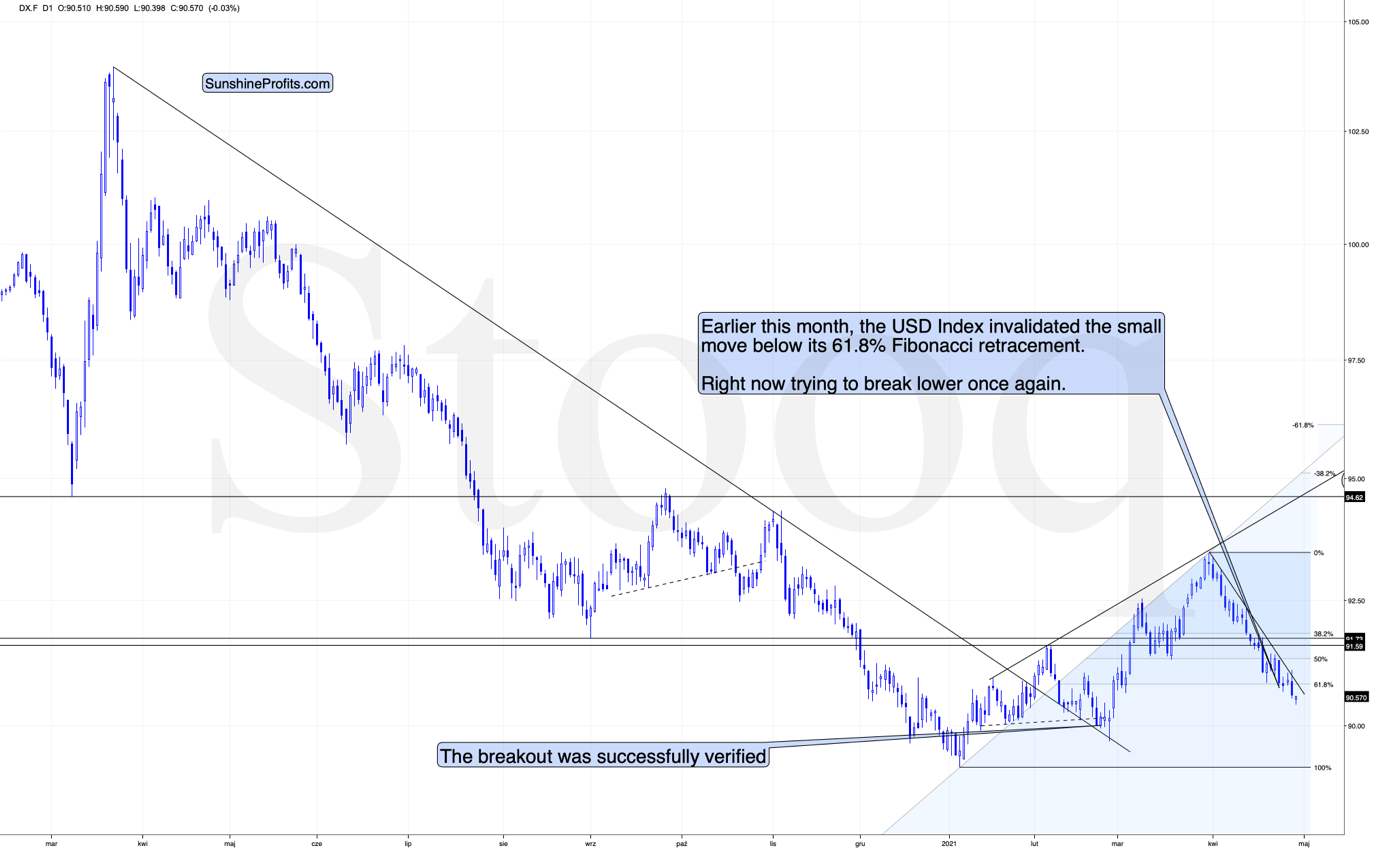
It’s making a second attempt to break below its 61.8% Fibonacci retracement level. At this time this breakdown is not confirmed, and – based on what we saw in gold recently – if it’s invalidated, it’s likely to make gold plunge. If it’s not invalidated and the USD Index declines, it’s not likely to trigger any substantial action in gold. After all, if gold wanted to react to USD’s declines, it should have already rallied above $1,800 by now. And at the moment of writing these words, gold futures are trading at $1,779.
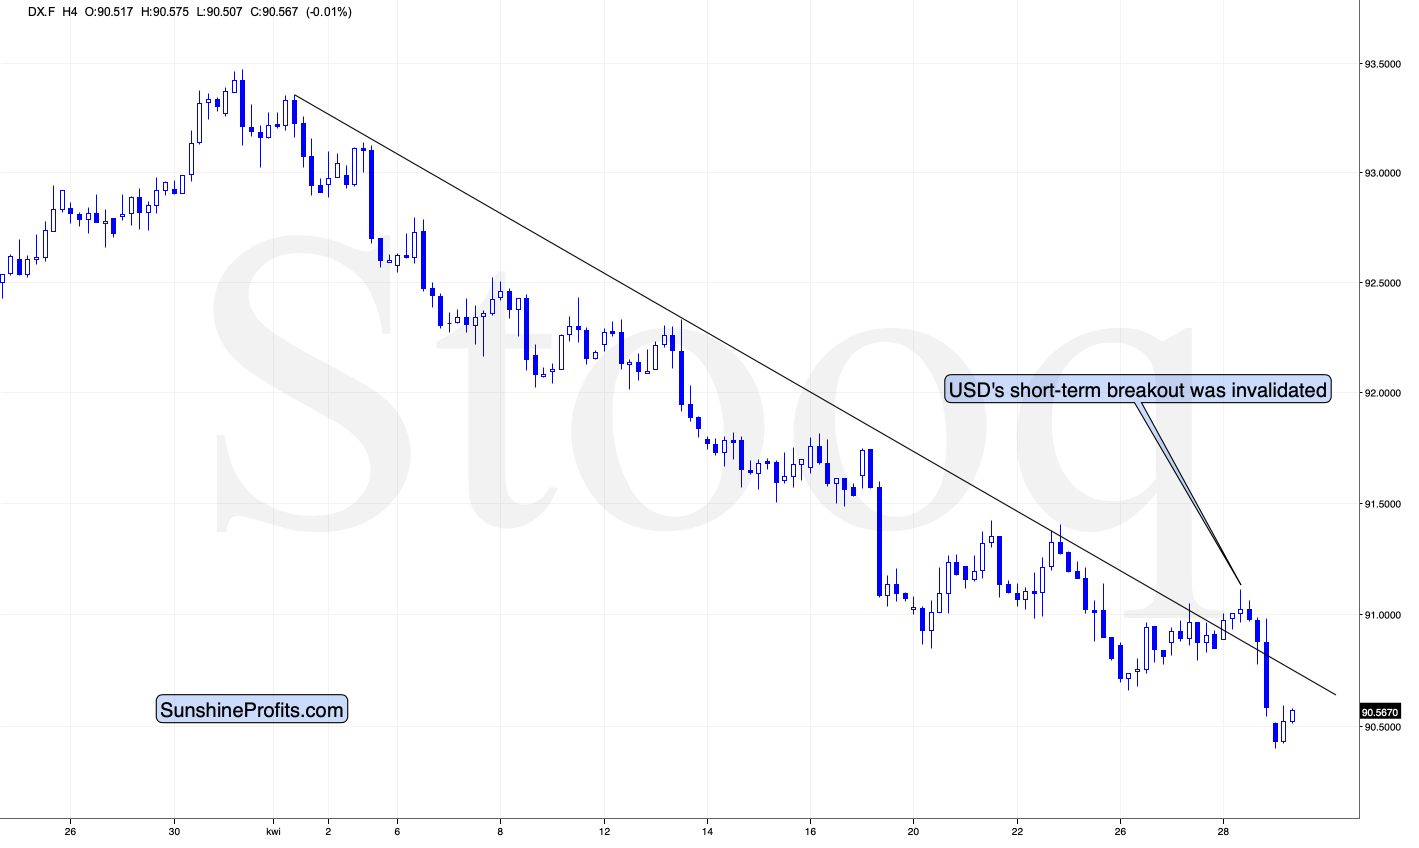
On the above 4-hour USD Index chart we see that the short-term breakout was invalidated, which triggered a substantial sell-off, but… Whatever was likely to happen based on this invalidation seems to have already happened. And the precious metals market has barely reacted. Consequently, it mattered little for the PM investors and traders. Once the USD Index breaks higher, gold, silver and mining stocks are likely to slide anyway. And since they are already underperforming relative to the (inverse) moves in the USDX, it suggests that even the move back up – to the declining resistance line – in the USDX could result in visible declines in the PMs.
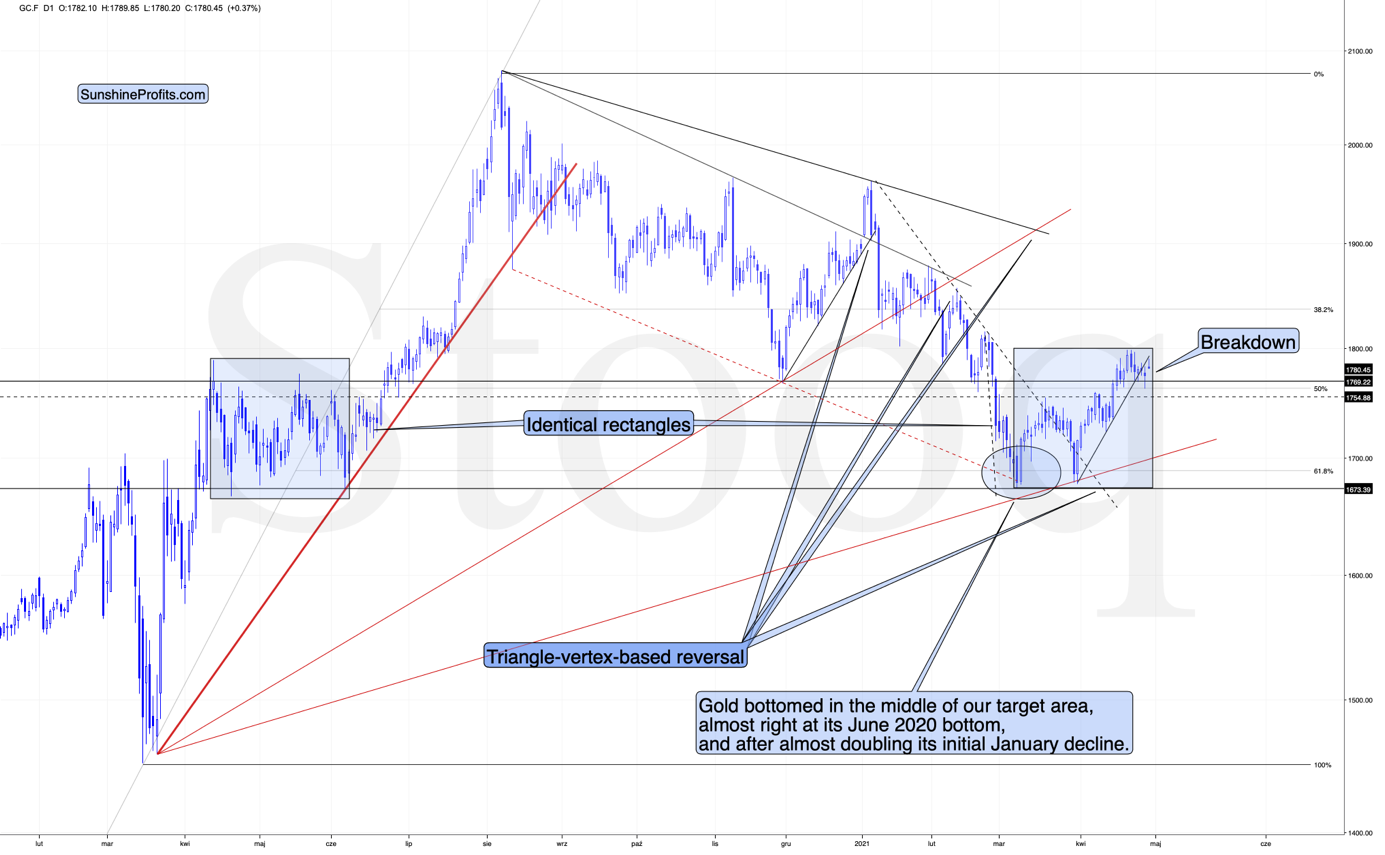
On the above gold chart, you can clearly see how gold moved back up to its rising short-term resistance line and – instead of invalidating the breakdown – it bounced from it and declined once again. This is what verifications of breakdowns look like.
Also, let’s keep in mind that the situation now seems to be a mirror image of what we saw in April – June 2020, and at the same time it’s somewhat similar to what we saw at the beginning of the year. You can see the former (the rectangles are identical) on the above chart, and you can see the similarity to the early January action below.
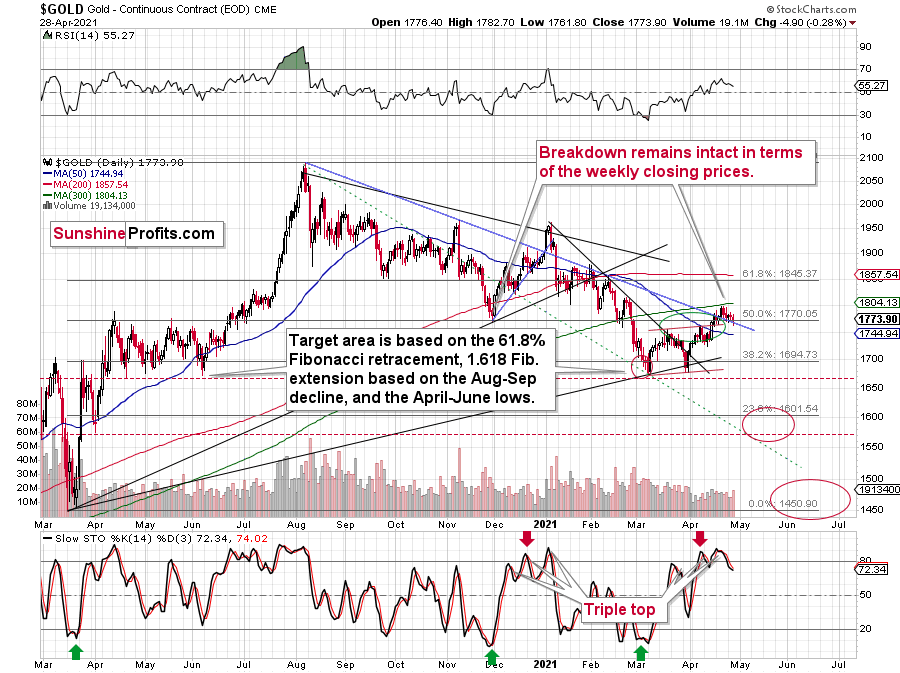
Just like it was the case in early January, we first saw a pause – a rebound – and the decline continued only thereafter. It seems that the Jan. 7 2021 price action is quite similar to what we saw earlier today. Moreover, please note that both happened just above the declining blue support line. It was the final pause before the move higher was invalidated.
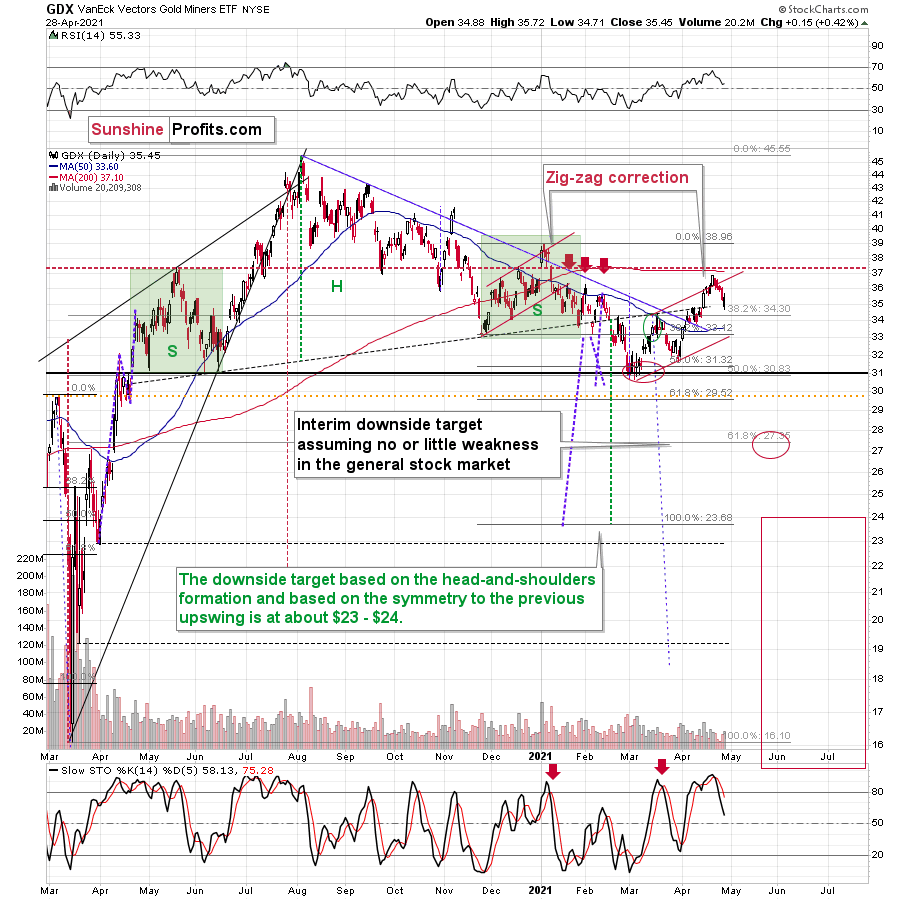
Gold stocks’ intraday recovery that we saw yesterday may seem profound, but not if we consider what happened in the USD Index and the general stock market. The former declined substantially while the latter was close to its all-time highs. This is a combination of factors that “should have” made gold miners move to new highs – and a daily gain of less than half percent is a sign of weakness, not strength.
In today’s pre-market trading the S&P 500 futures moved to new highs, and gold miners showed gains in the London trading, but they are nothing to write home about – and more importantly, nothing that would change the bearish forecast for gold I described more broadly previously.
Having said that, let’s take a look at the markets from a more fundamental angle.
It Makes Sense if You Don't Think About It
With Jerome Powell, Chairman of the U.S. Federal Reserve (FED), morphing into Harry Houdini on Apr. 28, the illusionist waved his magic wand and made the USD Index’s and the U.S. 10-Year Treasury yield’s gains disappear.
Citing its commitment to “smooth market functioning,” the FOMC unanimously agreed to keep interest rates near zero, purchase “at least” $120 billion worth of bonds per month and stay the course until “longer-run” inflation is “moderately above 2 percent for some time.”
Please see below:
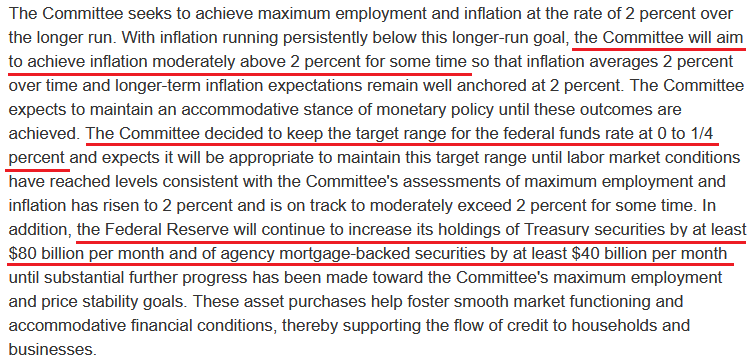 Source: FOMC
However, while the Committee’s commitment to loosen its monetary policy is much more rigid than its commitment to reality, Powell’s contradictory statements during his afternoon press conference signal that speculative inflation is here to stay.
Case in point: when asked about the state of the U.S. economy, Powell responded:
“The economy is a long way from our goals and is likely to take some time for substantial further progress to be achieved. We expect to maintain an accommodative stance to monetary policy until these employment and inflation outcomes are achieved.”
However, when asked later about the stock market, he said:
“Some of the asset prices are high. You are seeing things in the capital markets that are a bit frothy. That’s a fact. I won’t say it has nothing to do with monetary policy, but it also [has a] tremendous amount to do with vaccination and reopening of the economy”
“That’s really what has been moving markets a lot in the past few months, this turn away from what was a pretty dark winter to now a much faster vaccination process and a faster reopening, so that’s part of what is going on.”
So let’s do a little math: a “much faster vaccination process,” a “faster reopening” and a rebound from a “pretty dark winter” equals an economy that’s “a long way from our goals and is likely to take some time for substantial further progress to be achieved?”
Look, if it wasn’t clear before, it should be clear now that reverse-engineering a recovery – by pumping up asset prices and hoping that the strength will filter into the real economy – remains Powell’s plan of attack. And for better or for worse, we have to play the hand that we’re dealt. However, while Powell’s magic can jolt the PMs higher in the short term, the indirect effects of his policies are likely to haunt the PMs over the medium term.
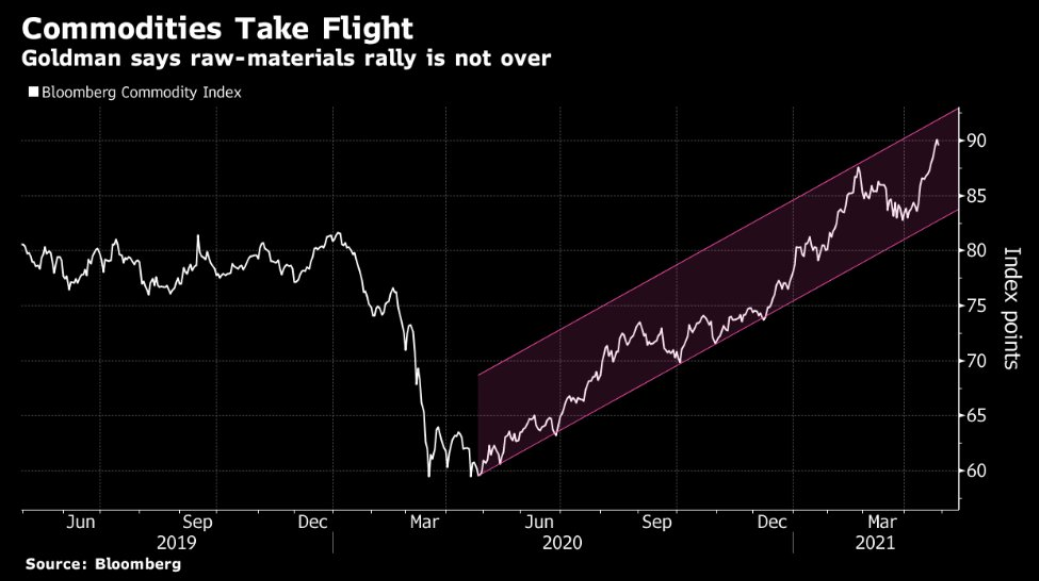
Case in point: with the liquidity spigots on full blast, Goldman Sachs published a report on Apr. 27 projecting another 13.5% rise in commodity prices over the next six months. Contrasting equities – which price in future growth – commodities focus on the here and now. And with futures traders already receiving the ‘all-clear’ from the FED Chair, the inflation story is likely to heat up as we approach the summer months.
Please see below:
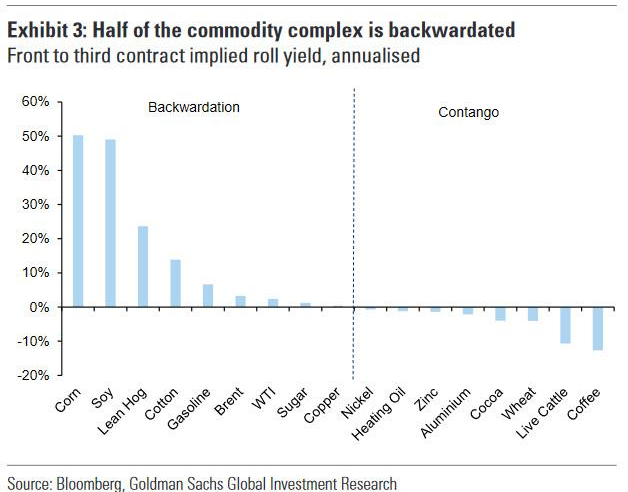
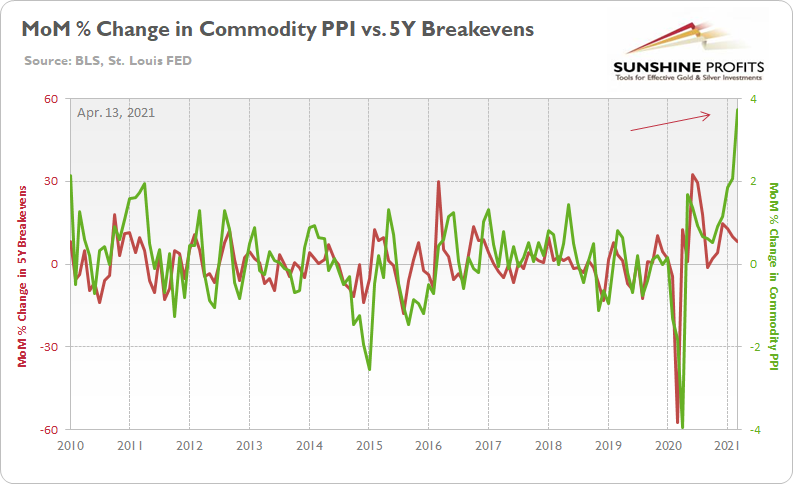
To explain, the blue bars above represent various commodities that are in backwardation and contango. For context, backwardation occurs when commodities’ spot price is greater than its futures price. Conversely, contango occurs when commodities’ futures price is greater than its spot price. And with more than half of the commodity complex in backwardation, short-term supply constraints have ushered their spot prices above their futures prices. More importantly, though, when you combine short-term supply pressures with rampant speculation, the recent surge in the Commodity Producer Price Index (PPI) is unlikely to abate anytime soon. For context, the 3.74% month-over-month (MoM) percentage increase in commodity PPI (released on Apr. 9) was the highest since July 1974.
Furthermore, during his press conference, Powell said that “we are likely to see upward pressure on prices, but [it] will be temporary […] Base effects carry no implication for the rate of inflation."
To explain, base effects distort data when the latest value is compared to an abnormally high or low value witnessed during the comparable period. Essentially, with the U.S. economy mostly shut down in March 2020, of course March 2021 data is going to show sharp spikes in activity, inflation, etc. when compared on a year-over-year (YoY) basis. However, if you analyze the chart below, it’s important to remember that the percentage increase in commodity PPI depicts MoM data, meaning that the March 2021 print is compared to the February 2021 print. The bottom line? There is no base effect distorting the chart below (which I presented on Apr. 13) and Powell’s rebuttal remains woefully invalid.
On top of that, while the commodities market continues its rampage, economists surveyed by Bloomberg have been rapidly raising their 2021 Consumer Price Index (CPI) estimates. For context, PPI is inflation that’s incurred by businesses, while CPI (which often follows) is inflation that’s incurred by consumers.
Please see below:
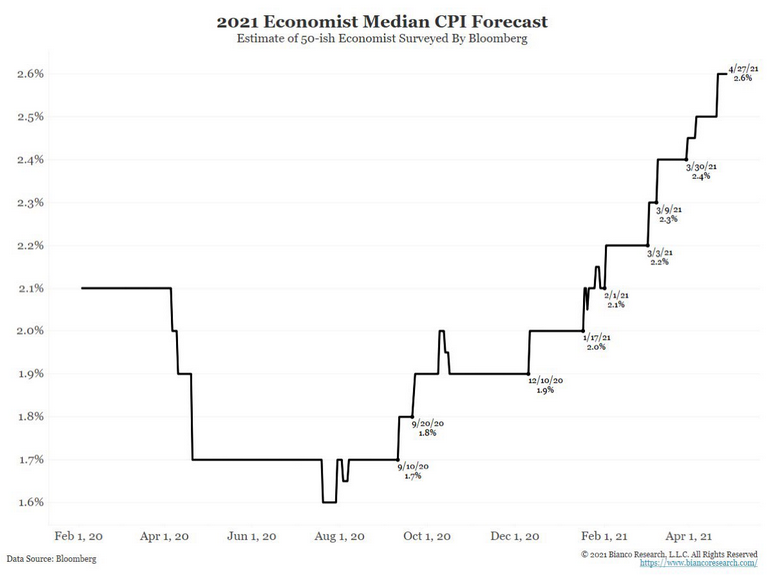
To explain, the black line above tracks economists’ median 2021 CPI estimate. And while on Jan. 17 the median forecast was 2.0%, as of Apr. 27 the median forecast has swelled to 2.60%. Moreover, with the FED Chair essentially green-lighting another round of commodity speculation, what’s stopping another round of upward CPI revisions?
As further evidence, it’s not only commodity inflation that’s on the rise. When the National Federation of Independent Business (NFIB) calculates its monthly Small Business Optimism Index, the group asks respondents about their plans to increase or decrease their output prices. And with a record number (42%) reporting that job openings can’t be filled due to a shortage of skilled labor (incoming wage inflation), while a net 28% of respondents said that they’ve already increased employee compensation (current wage inflation), it’s easy to see why small businesses are raising prices at the fastest pace ever.
Please see below:
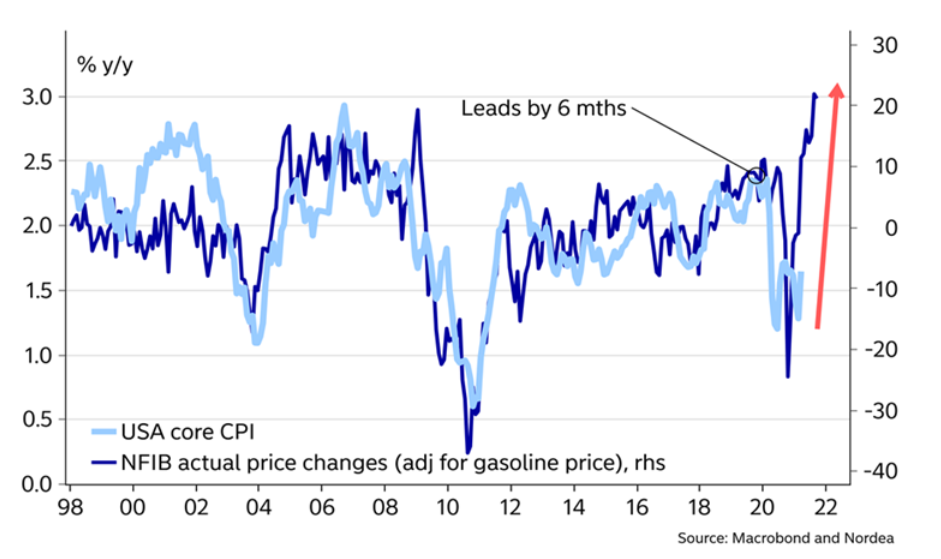 To explain, the dark blue line above tracks the actual price changes of NFIB respondents’ finished goods, while the light blue line above tracks U.S. core CPI (which excludes food and energy). If you analyze the right side of the chart, notice the large gap? And with the former leading the latter by six months, follow-through by U.S. core CPI implies a YoY percentage increase of more than 3.0%. For context, the last time U.S. core CPI rose by more than 3.0% YoY for a monthly print was October 1995.
If that wasn’t enough, during the FED Chair’s press conference, Powell said that inflation expectations should be “well-anchored at 2%, and we really don’t see that yet.” Well, despite his lack of vision, the U.S. 10-Year breakeven inflation rate is now at its highest level since April 2013. More importantly, though, the long-term inflation benchmark is approaching levels similar to when then-FED Chair Ben Bernanke incited the 2013 “taper tantrum.”
Please see below:
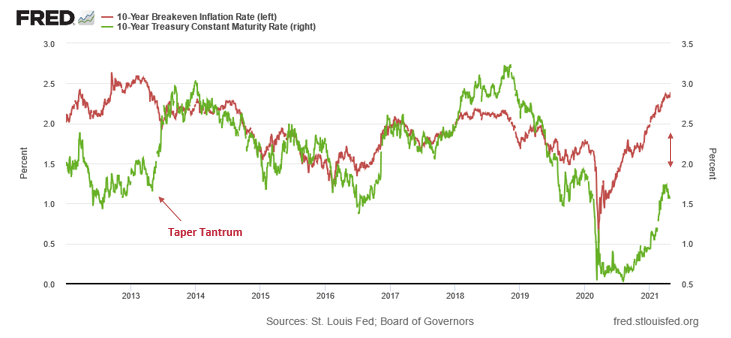
To explain, the red line above tracks the U.S. 10-Year breakeven inflation rate, while the green line above tracks the U.S. 10-Year Treasury yield. If you analyze the left side of the chart, you can see that a massive decoupling occurred in 2012. However, after the U.S. 10-Year breakeven inflation rate jumped above 2.60%, Bernanke’s unintentional whisper about tapering in May 2013 led to a surge in the U.S. 10-Year Treasury yield. And while Powell is unlikely to make the same mistake this time (by tapering), the gap between the U.S. 10-Year breakeven inflation rate and the U.S. 10-Year Treasury yield still increased over the last month. If you analyze the right side of the chart, while the U.S. 10-Year breakeven inflation rate made another new high of 2.41% on Apr. 28, the U.S. 10-Year Treasury yield’s recent consolidation only widened their gap.
To that point, with Powell almost daring bond investors to repeat their behavior from 2013, the two lines are likely to reconnect sooner rather than later. Case in point: after demonstrating the material divergence in 2012, it took roughly 13 months for the two to reconnect. And with an even larger divergence apparent in August 2020, a similar timeframe signals that the current gap should close by September.
Remember, back in May 2007, then-FED Chair Bernanke had this to say about the housing market: “We believe the effect of the troubles in the subprime sector on the broader housing market will likely be limited, and we do not expect significant spillovers from the subprime market to the rest of the economy or to the financial system.”
And… well, we all know what happened next.
The bottom line? With Powell’s inflation predictions lacking the same fundamental foundation, his words are likely history in the making too.
In conclusion, much like during his performance on Mar. 17, Powell was successful in talking down the USD Index, talking down the U.S. 10-Year Treasury yield and talking up the PMs. However, with the synthetic show of force eliciting a sugar high that’s likely to fade, Powell believes that exuding ‘confidence’ will distract investors from the fact that he’s materially behind the inflation curve. Thus, with surging commodity inflation leaving plenty of room for the U.S. 10-Year Treasury yield to move higher over the medium term, interest rates are akin to the PMs’ kryptonite. As a result, gold, silver and mining stocks are unlikely to sidestep the forthcoming volatility.
Overview of the Upcoming Part of the Decline
- It seems likely to me that the corrective upswing was already completed or (less likely than the above) that it will be completed this week. Consequently, it seems that the next big move lower is already underway or about to start.
- After miners slide once again in a meaningful and volatile way, but silver doesn’t (and it just declines moderately), I plan to switch from short positions in miners to short positions in silver (this could take another 1-2 weeks to materialize). I plan to exit those short positions when gold shows substantial strength relative to the USD Index, while the latter is still rallying. This might take place with gold close to $1,450 - $1,500 and the entire decline (from above $1,700 to about $1,475) would be likely to take place within 1-12 weeks, and I would expect silver to fall hardest in the final part of the move. This moment (when gold performs very strongly against the rallying USD and miners are strong relative to gold – after gold has already declined substantially) is likely to be the best entry point for long-term investments, in my view. This might happen with gold close to $1,475, but it’s too early to say with certainty at this time. In other words, the entire decline could take between 1 and 12 weeks, with silver declines occurring particularly fast in the final 1-2 weeks.
- If gold declines even below $1,500 (say, to ~$1350 or so), then it could take another 10 weeks or so for it to bottom, but this is not what I view as a very likely outcome.
- As a confirmation for the above, I will use the (upcoming or perhaps we have already seen it?) top in the general stock market as the starting point for the three-month countdown. The reason is that after the 1929 top, gold miners declined for about three months after the general stock market started to slide. We also saw some confirmations of this theory based on the analogy to 2008. All in all, the precious metals sector would be likely to bottom about three months after the general stock market tops. If the mid-February 2020 top was the final medium-term top (based on NASDAQ’s top, then it seems that we might expect the precious metals sector to bottom in mid-May or close to May’s end. If, however, the upcoming (unless we just saw one) top in the S&P 500 is the key one, then it seems that we’re at least ~3 months from the final bottom.
- The above is based on the information available today, and it might change in the following days/weeks.
Please note that the above timing details are relatively broad and “for general overview only” – so that you know more or less what I think and how volatile I think the moves are likely to be – on an approximate basis. These time targets are not binding or clear enough for me to think that they should be used for purchasing options, warrants or similar instruments.
Letters to the Editor
Q: Allow me to express my sheer appreciation for your exceptional dedication to your subscribers. I have worked in finance for most of my life, and it is rare to find this level of detailed analysis and even more so to find an analyst that sticks to his gun and flavors his report with tons of humor.
I follow your predictions on gold and the market as a whole, and I totally agree with you. My main question is if you find a better use (from the risk-reward aspect) to your current cash position while waiting to enter the long position as this might take a few more months. My biggest concern is to sit on cash during the time we see cost pressure; pushing higher and higher, and cash perhaps is the worse asset to be in an inflationary environment (Cash is Trash; Ray Dalio).
Secondly, I noticed your target price for the JDST is $39,87 and GDXJ is $24.12, so the former is expected to generate (39.87/10.20-1) x 100 = 290% and the latter 50%. JDST is levered x2, so it should result in 100% approx. Is it possible that the other 190% is because of the time decay of the instrument?
A: Thank you very much for your kind words, I appreciate them a lot! As for the cash position that’s ready to be deployed into the precious metals market, it seems to me that any losses due to inflation would still be tiny compared to possible losses that could stem from placing the capital in the wrong place. Some people might consider moving some of that capital into the “trading” part of the portfolio, but only after giving it some serious thought and while paying attention not to get over-leveraged. Perhaps, for diversification purposes, it would be a good idea to consider taking small positions in other markets as well. We provide crude oil and stock market analysis in separate subscriptions, so it might be a good time to investigate those. Also, please note that the waiting for deploying the long-term investment capital is almost over – “almost” from the long-term point of view, where a couple of months doesn’t mean that much.
As for the GDXJ and JDST (and for other similar pairs like GDX and DUST), please note that the 2x leverage is for DAILY price moves, not for the entire move. If something grows 1% per day for 100 days and something else grows by 2% for 100 days, they would end up being 2.7 of the original value (1% growth) and 7.2 of the original value (2% growth). And 7.2 is more than twice as much as 2.7.
Summary
To summarize, the PMs’ medium-term decline is well underway, and based on the recent performance of the USD Index, gold and mining stocks, it seems that the corrective upswing is close to being over. In fact, it seems very likely that it ended last week. Even if it didn’t (which seems relatively unlikely but still possible), the key thing here is that the really big move seems very close to starting, and when it does start, the recent upswing will likely seem to have been nothing more than a blip on the radar screen.
In addition, because we’re likely entering the “winter” part of the Kondratiev cycle (just like in 1929 and then the 1930s), the outlook for the precious metals’ sector remains particularly bearish during the very first part of the cycle, when cash is king.
The confirmed breakout in the USD Index is yet another confirmation of the bearish outlook for the precious metals market.
After the sell-off (that takes gold to about $1,450 - $1,500), we expect the precious metals to rally significantly. The final part of the decline might take as little as 1-5 weeks, so it's important to stay alert to any changes.
Most importantly, please stay healthy and safe. We made a lot of money last March and this March and it seems that we’re about to make much more on the upcoming decline, but you have to be healthy to enjoy the results.
As always, we'll keep you - our subscribers - informed.
By the way, we’re currently providing you with a possibility to extend your subscription by a year, two years or even three years with a special 20% discount. This discount can be applied right away, without the need to wait for your next renewal – if you choose to secure your premium access and complete the payment upfront. The boring time in the PMs is definitely over and the time to pay close attention to the market is here. Naturally, it’s your capital, and the choice is up to you, but it seems that it might be a good idea to secure more premium access now, while saving 20% at the same time. Our support team will be happy to assist you in the above-described upgrade at preferential terms – if you’d like to proceed, please contact us.
To summarize:
Trading capital (supplementary part of the portfolio; our opinion): Full speculative short positions (300% of the full position) in mining stocks are justified from the risk to reward point of view with the following binding exit profit-take price levels:
Mining stocks (price levels for the GDXJ ETF): binding profit-take exit price: $24.12; stop-loss: none (the volatility is too big to justify a stop-loss order in case of this particular trade)
Alternatively, if one seeks leverage, we’re providing the binding profit-take levels for the JDST (2x leveraged) and GDXD (3x leveraged – which is not suggested for most traders/investors due to the significant leverage). The binding profit-take level for the JDST: $39.87; stop-loss for the JDST: none (the volatility is too big to justify a SL order in case of this particular trade); binding profit-take level for the GDXD: $94.87; stop-loss for the GDXD: none (the volatility is too big to justify a SL order in case of this particular trade).
For-your-information targets (our opinion; we continue to think that mining stocks are the preferred way of taking advantage of the upcoming price move, but if for whatever reason one wants / has to use silver or gold for this trade, we are providing the details anyway.):
Silver futures upside profit-take exit price: unclear at this time - initially, it might be a good idea to exit, when gold moves to $1,512.
Gold futures upside profit-take exit price: $1,512.
Long-term capital (core part of the portfolio; our opinion): No positions (in other words: cash
Insurance capital (core part of the portfolio; our opinion): Full position
Whether you already subscribed or not, we encourage you to find out how to make the most of our alerts and read our replies to the most common alert-and-gold-trading-related-questions.
Please note that we describe the situation for the day that the alert is posted in the trading section. In other words, if we are writing about a speculative position, it means that it is up-to-date on the day it was posted. We are also featuring the initial target prices to decide whether keeping a position on a given day is in tune with your approach (some moves are too small for medium-term traders, and some might appear too big for day-traders).
Additionally, you might want to read why our stop-loss orders are usually relatively far from the current price.
Please note that a full position doesn't mean using all of the capital for a given trade. You will find details on our thoughts on gold portfolio structuring in the Key Insights section on our website.
As a reminder - "initial target price" means exactly that - an "initial" one. It's not a price level at which we suggest closing positions. If this becomes the case (like it did in the previous trade), we will refer to these levels as levels of exit orders (exactly as we've done previously). Stop-loss levels, however, are naturally not "initial", but something that, in our opinion, might be entered as an order.
Since it is impossible to synchronize target prices and stop-loss levels for all the ETFs and ETNs with the main markets that we provide these levels for (gold, silver and mining stocks - the GDX ETF), the stop-loss levels and target prices for other ETNs and ETF (among other: UGL, GLL, AGQ, ZSL, NUGT, DUST, JNUG, JDST) are provided as supplementary, and not as "final". This means that if a stop-loss or a target level is reached for any of the "additional instruments" (GLL for instance), but not for the "main instrument" (gold in this case), we will view positions in both gold and GLL as still open and the stop-loss for GLL would have to be moved lower. On the other hand, if gold moves to a stop-loss level but GLL doesn't, then we will view both positions (in gold and GLL) as closed. In other words, since it's not possible to be 100% certain that each related instrument moves to a given level when the underlying instrument does, we can't provide levels that would be binding. The levels that we do provide are our best estimate of the levels that will correspond to the levels in the underlying assets, but it will be the underlying assets that one will need to focus on regarding the signs pointing to closing a given position or keeping it open. We might adjust the levels in the "additional instruments" without adjusting the levels in the "main instruments", which will simply mean that we have improved our estimation of these levels, not that we changed our outlook on the markets. We are already working on a tool that would update these levels daily for the most popular ETFs, ETNs and individual mining stocks.
Our preferred ways to invest in and to trade gold along with the reasoning can be found in the how to buy gold section. Furthermore, our preferred ETFs and ETNs can be found in our Gold & Silver ETF Ranking.
As a reminder, Gold & Silver Trading Alerts are posted before or on each trading day (we usually post them before the opening bell, but we don't promise doing that each day). If there's anything urgent, we will send you an additional small alert before posting the main one.
Thank you.
Przemyslaw Radomski, CFA
Founder, Editor-in-chief

