

Briefly: in our opinion, full (300% of the regular position size) speculative short positions in mining stocks are justified from the risk/reward point of view at the moment of publishing this Alert.
The situation in the precious metals market didn’t change substantially yesterday (Jan. 15), and it didn’t change so far in today’s pre-market trading. Some will call this performance calm, while others will call it boring; I’d say that what’s happening is quite natural. Periods of high volatility can - and actually tend to – be cut by periods of low volatility. In other words, markets quite often take two steps forward and one step back. That’s exactly what we’re seeing. We’re also seeing – based on action in the USD Index and mining stocks – that the next two steps forward are likely to begin shortly.
Still, let’s start with a quick look at gold and silver.
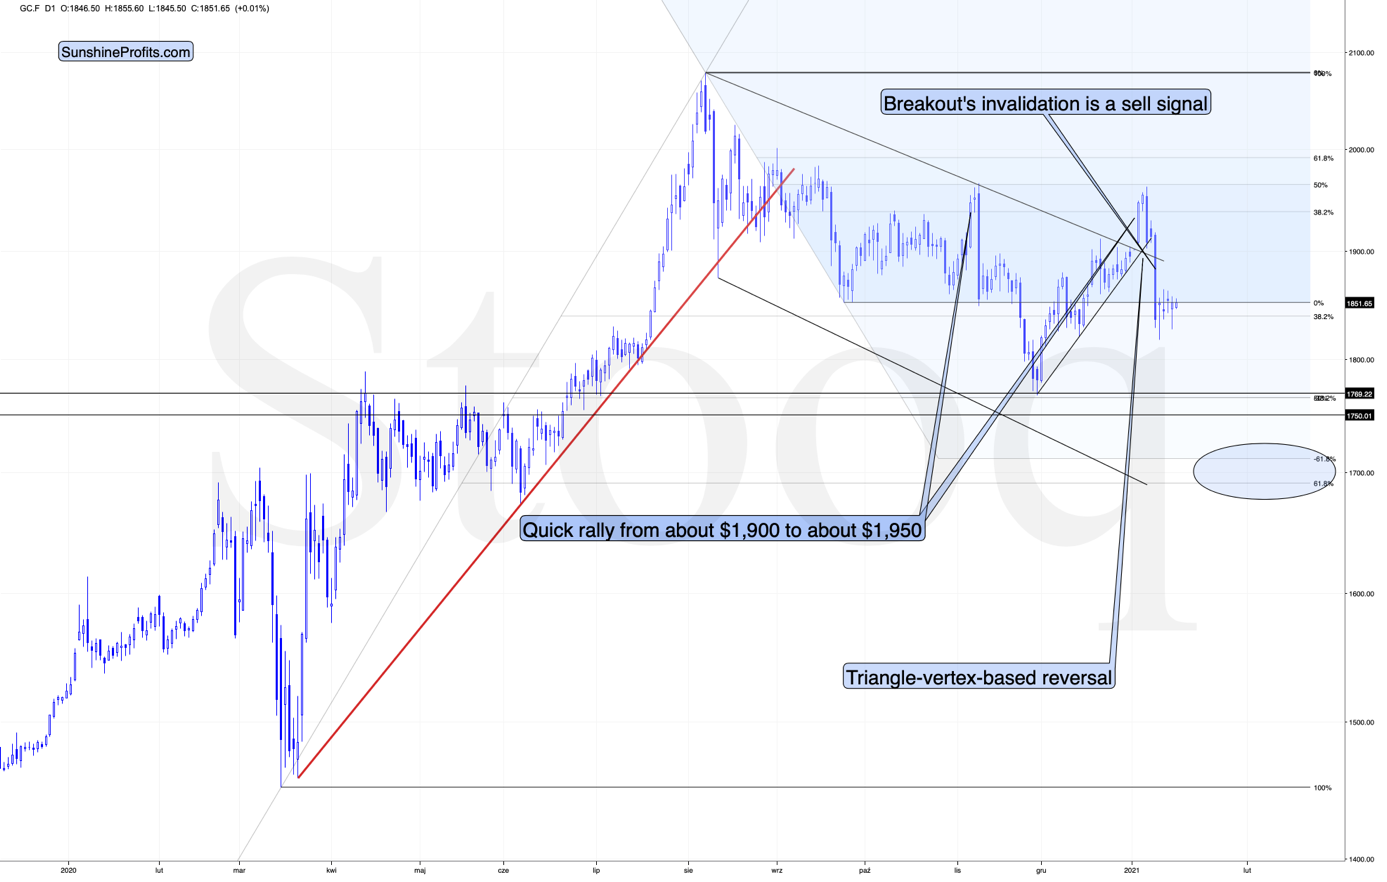
Figure – COMEX Gold Futures
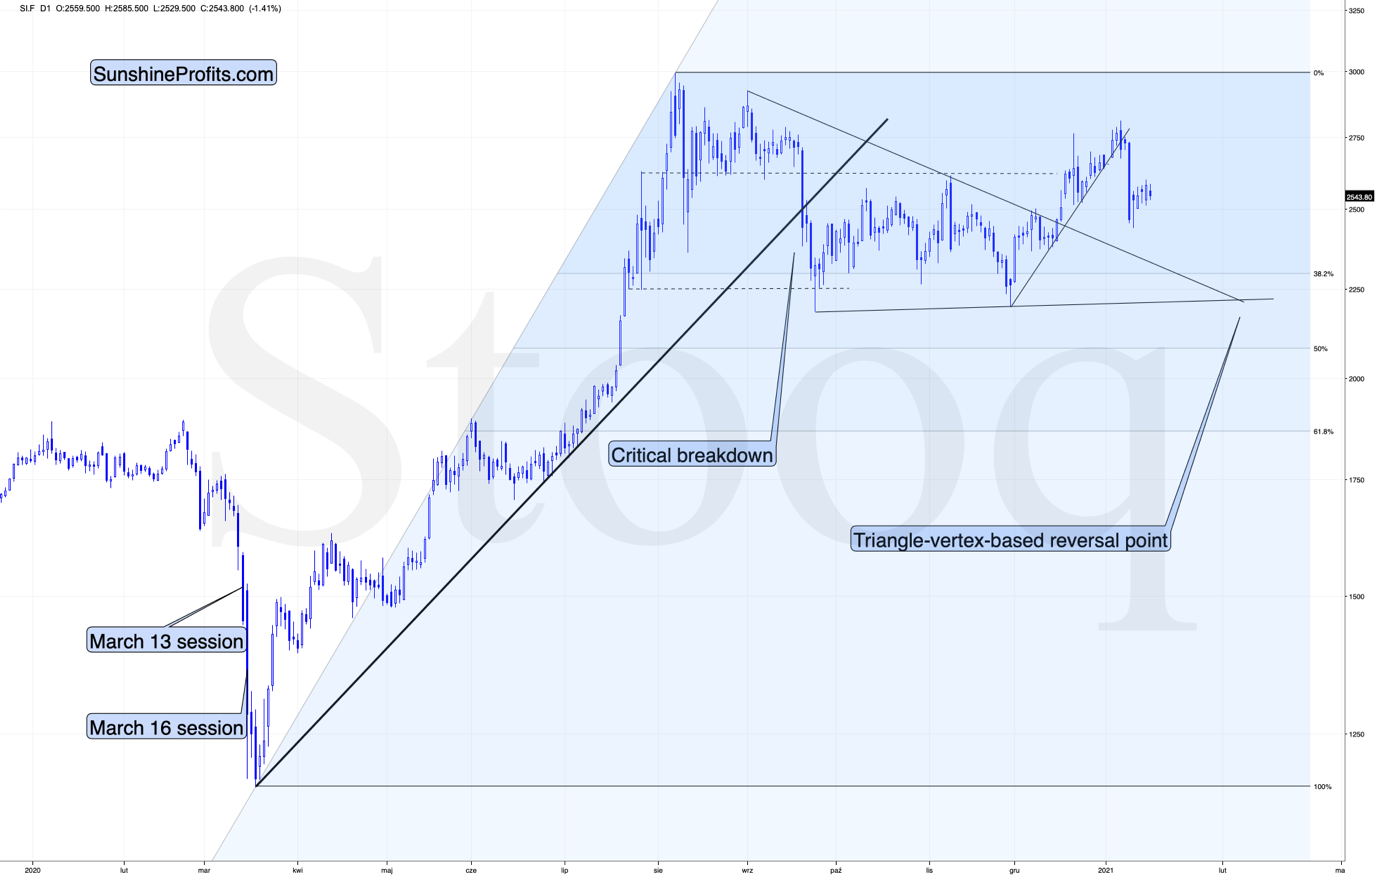
Figure – COMEX Silver Futures
In short, the breather in gold and silver continues. This is natural and normal, given the size of the slide that we saw recently. The decline is likely to resume soon.
After all, gold did reverse just as I described previously – right at its triangle-vertex-based reversal.
Having said that, let’s move on to something more interesting.
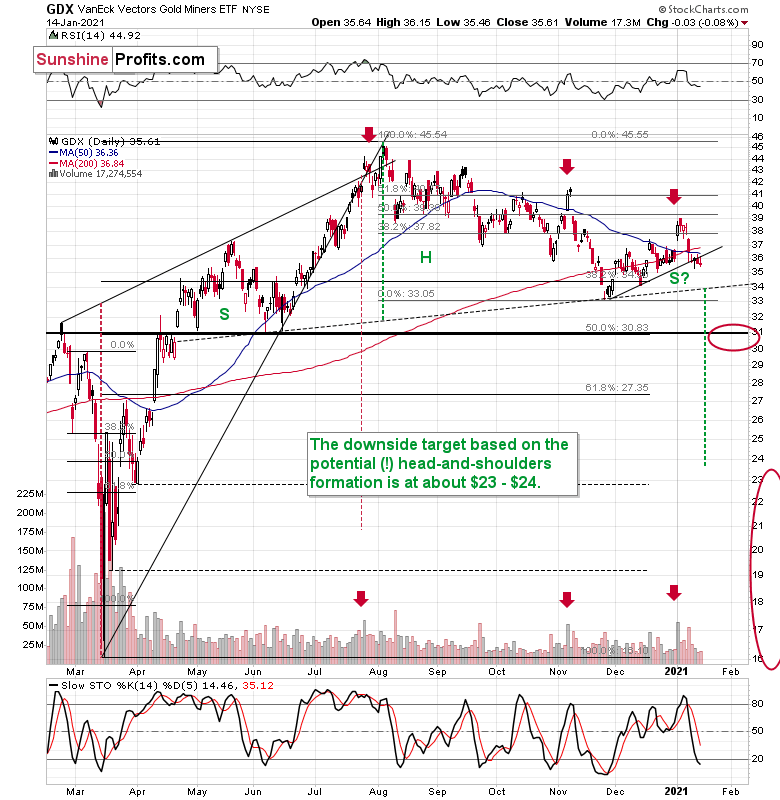
Figure - VanEck Vectors Gold Miners ETF (GDX)
In yesterday’s (Jan. 14) analysis, I wrote the following:
The interesting thing about the mining stocks is that they closed the day below the rising, short-term support line. While it’s still unconfirmed, that looks like a breakdown. The volume on which it materialized was low. This, by itself, doesn’t invalidate the breakdown, but it means that it requires a confirmation before the implications get very bearish. The first crack in a dam seems innocent at first, but we all know what happens after a short while.
Yesterday, the GDX ETF has once again closed below the rising support line, and it happened right after the miners tried to rally on an intraday basis. This is exactly how a quiet confirmation of a breakout looks like. Some view two daily closes below a certain level as a confirmed breakdown, but based on my experience with this sector, I think that applying the three-day-rule is better. So, if the GDX closes below the rising support line (approximately $36) today, the breakdown will be clearly confirmed – especially considering that today’s close will also be the weekly close. This would be a clear bearish confirmation for the short term.
Consequently, my previous comments on the above chart remain up-to-date:
The sell signal from the stochastic indicator remains in place, and so does the sell signal coming from the volume spike in the first session of the year (analogy to July and November tops).
Please note that, based on the analogy to the November top, a small, two-day corrective upswing, would be quite normal here. It wouldn’t change the bearish outlook at all.
In addition, the GDX is on the cusp of forming a head and shoulders pattern. If you analyze the chart above, the area on the left (marked S) represents the first shoulder, while the area in the middle (H) represents the head and the area on the right (second S) represents the potential second shoulder.
Right now, $33.7-$34 is the do-or-die area. If the GDX breaks below this (where the right shoulder forms) it could trigger a decline back to the $24 to $23 range (measured by the spread between the head and the neckline; marked with green).
Since there’s a significant support at about $31 in the form of the 50% retracement based on the 2020 rally, and the February 2020 high, it seems that we might see the miners pause there. In fact, it wouldn’t be surprising to see a pullback from these levels to about $33, which could serve as the verification of the completion of the head-and-shoulder pattern. This might take place at the same time, when gold corrects the decline to $1,700, but it’s too early to say with certainty.
Also, let’s not forget that the GDX ETF has recently invalidated the breakout above the 61.8% Fibonacci retracement based on the 2011 – 2016 decline.
On top of that we have a classic post-breakout action in the USD Index.
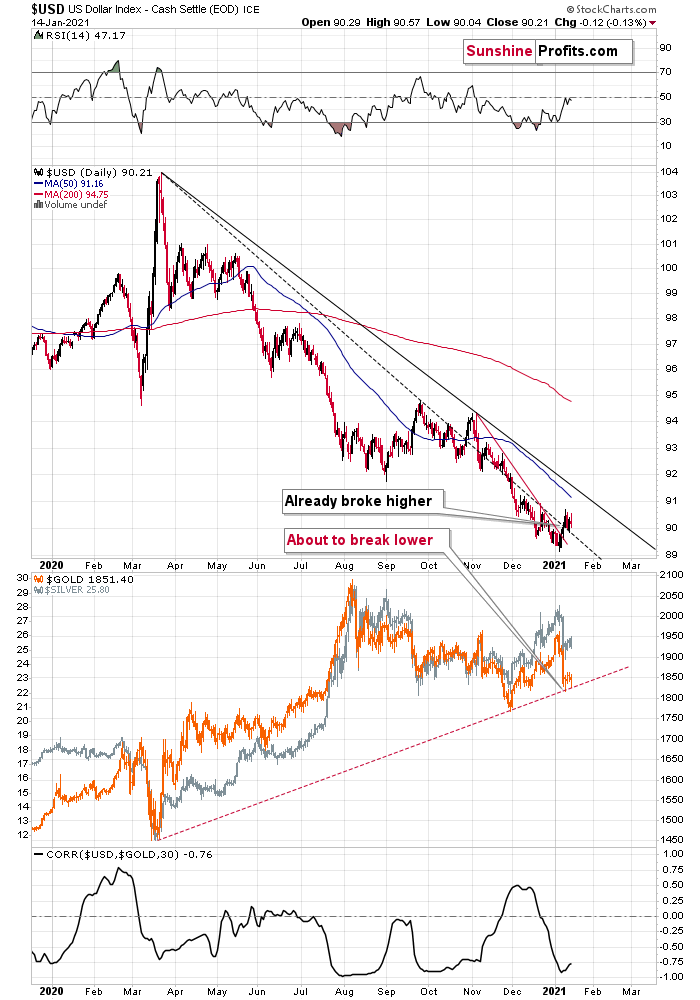
Figure - USD Index, USD, GOLD and CORR Comparison
After confirming the breakout above the very short-term declining resistance line, the USD Index has now broken above the declining dashed line that’s based on the March 2020 and September 2020 tops.
This breakout is now confirmed and verified. The USD Index moved back to this line and then rallied back up. The implications are bullish for the U.S. currency. The next strong resistance is at about 91.3 – at the declining resistance line based on the March 2020 and November 2020 highs.
With the correlation between the USD index and gold (bottom part of the chart) being strongly negative, the USD’s breakouts are bullish for gold. Namely, they tell us that after a breather, the USD Index is likely to continue its rally, while precious metals are likely to fall.
Before summarizing, let’s take a more fundamental look at precious metals price drivers: currencies, yields, and stocks.
As you can see in our Correlation Matrix, the 30-trading-day correlation values are strongly negative in the case of all key parts of the precious metals market (gold, silver, senior miners, junior miners) and the USD Index, while they remain generally positive in case of the link with the stock market. Both links are most visible when we take the 250 trading days into account (effectively about 1 year).
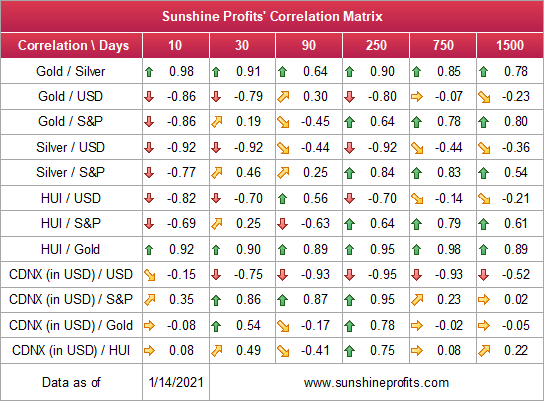
Figure 5 – Sunshine Profits’ Correlation Matrix
The closer to -1 the number gets, the more negatively correlated given assets are, and the closer to 1 it gets, the stronger the positive correlation. Numbers close to zero imply no correlation.
So, what do these markets tell us about future movements in the price of gold?
Yielding More Than They Bargained For
With a waterfall of fresh fiscal stimulus set to rain down on the U.S. economy, a paradigm shift is unfolding in real-time. Previously, fiscal and/or monetary stimulus was dollar-negative, with the greenback suffering body blows every time a rumor circulated.
However, after whispers of Joe Biden’s $1.90 trillion stimulus plan leaked (late Wednesday night), the U.S. 10-Year yield made a complete U-turn (For context, CNN initially reported that the fiscal package would be ~$2.00 trillion, with Biden taking a "shoot for the moon" approach.”)
But after the New York Times revealed that the official package would total $1.90 trillion, the U.S. 10-Year yield spiked on Thursday (Jan. 14) and clawed back all of Wednesday’s (Jan. 13) losses.
Please see below:
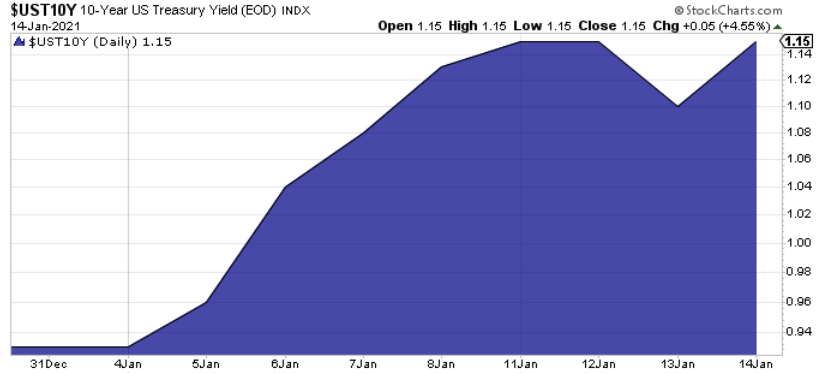
Figure 6 – 10-Year U.S. Treasury Yield
And how did this drama affect the USD Index?
Well, barely flinching, the USDX traded roughly flat on Thursday (Jan. 14) and the greenback bounced off session lows after the news broke (Keep in mind, it was barely a month ago that many pundits were mourning the ‘death of the dollar.’)
As a result, an interesting development is unfolding right before our eyes. Instead of traders dumping the U.S. dollar at the first hint of new stimulus, loose fiscal policy is causing a sell-off in the bond market and leading to dollar strength (remember, to pay the bills, the U.S. government needs to sell $1.90 trillion worth of U.S. Treasuries; and as the supply of Treasuries rise, yields rise, which in turn, pushes prices down.)
Thus, as the unintended consequences mount, 2020’s bearish stimulus story has now become dollar-positive in 2021.
To explain, the U.S. government has essentially painted itself into a corner:
- If they let yields rise, the cost of borrowing rises, the cost of equity rises, and the U.S. dollar is supported (all leading to shifts in the bond and stock markets and destroying the halcyon environment they worked so hard to create).
- To stop yields from rising, the U.S. Federal Reserve (FED) has to increase its asset purchases (and buy more bonds in the open market). However, the added liquidity should have the same net-effect because it increases inflation expectations (which, as I mentioned yesterday, is a precursor to higher interest rates).
Thus, the stars are aligning for a sustained USDX rally. With the bearish-only narrative seemingly shifting, the USDX’s bullish technicals (that show it holding firmly above its declining resistance line) have just gained another ally.
And judging by gold’s recent reaction, the yellow metal is definitely taking notice.
He Said It
As another piece of the interest rate puzzle, Jerome Powell (Chairman of the U.S. Federal Reserve) said on Thursday (Jan. 14) that “when the time comes to raise interest rates, we’ll certainly do that. And that time, by the way, is no time soon.”
End of discussion?
Not even close.
The FED Chair continued by saying, “If inflation were to move up in ways that are unwelcome, we have the tools for that, and we will use them. No one should doubt that.”
Similar to the argument that I expanded on yesterday, his rhetoric mirrors what I wrote on Jan. 8: that weak CPI is a precursor to a weaker euro. Only here, strong CPI (inflation) is a precursor to a stronger U.S. dollar. Unlike the Eurozone – where inflation has been negative for five-straight months – U.S. CPI has been positive for seven-straight months, inching up by 0.40% (rounded) in December.
But is 0.40% really enough to move the needle?
Well, if you analyze the chart below, you can see that commodities are telling a different story. Over the last month, basic necessities like WTI (oil), corn, wheat and sugar have all risen by more than 12%.
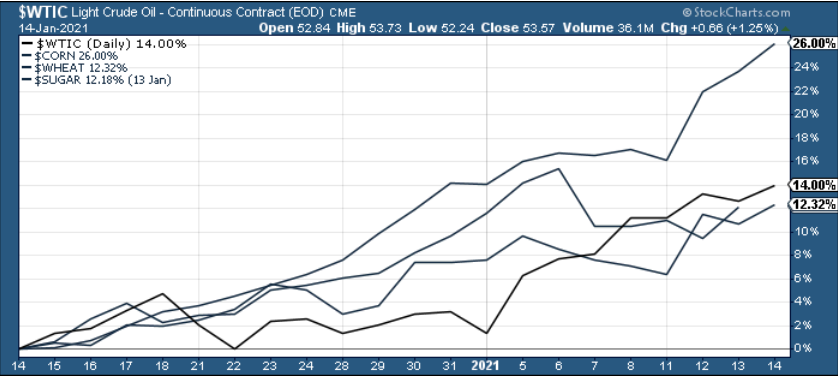
Figure 7 - Light Crude Oil (WTIC)
In addition, the Philadelphia Housing Index (HGX) – which tracks residential home builders, mortgage insurers and suppliers of building materials across the U.S. – is up by nearly 22% over the last six months, while lumber prices have spiked by nearly 34%.
Please see below:
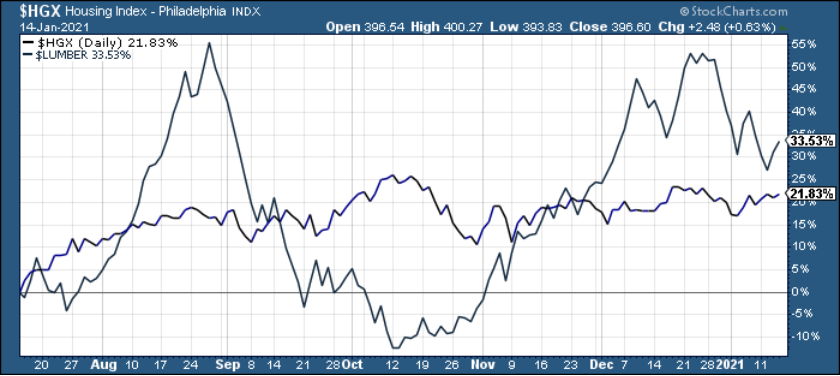
Figure 8 - Housing Index (HGX)
Thus, while the FED Chair doesn’t see any “unwelcome” inflation, commodities aren’t exactly supporting his vision. Furthermore, U.S. CPI data released on Wednesday (Jan. 13) showed that gasoline and fuel costs increased by 8.4% and 10.0% month-over-month in December.
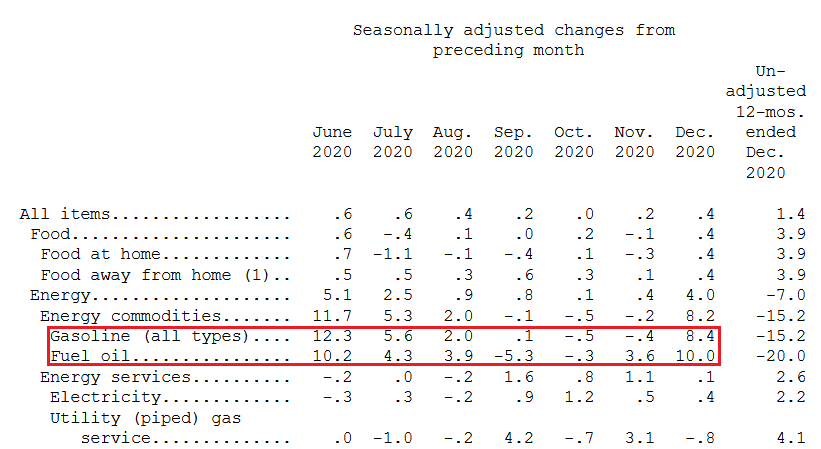
Figure 9 - Rise in Gasoline and Fuel Costs (Source: U.S. Bureau of Labor Statistics [BLS])
The bottom line?
As long as you don’t eat, drive or require lodging, then inflation might not be a problem. However, for goods and services that we use/need on a daily basis, inflation is abundant. And because higher inflation is a precursor to higher interest rates, Powell’s own polices (and their impact on real and financial assets) actually eliminate his ability to determine when interest rates rise.
Thus, while rising inflation is a long-term positive for gold, the short-term effect of higher interest rates and a higher USD Index should pressure the yellow metal in the near future. However, after the dust settles, it will present an attractive buying opportunity.
Letters to the Editor
Q: It seems the $ only hits the upper Bollinger Band and then collapses; it has no legs. Trillions of stimulus dollars coming, says Biden. Regardless, the consolidative drop in gold would be short lived. It’s the time to buy junior miners at great discounts. I see a lower low, perhaps to 30-31, in GDX as the possibility but not probable result. Eventually gold at $2350 is my target for the next push when it does transpire, just above the old highs. Hold or sit is the best advice on gold and silver stocks - the same applies for oil and uranium. I believe day trading is a loser’s game, and so is shorting. Bargains, though, are just that - bargains.
A: Regarding “legs” (so, the reasoning behind the rally that could make it be something more than just a short-term correction), I think the following are very important leg-contributing factors:
- The reaction to information about stimulus was practically nonexistent, while the USDX should have declined. This is a very strong sign that this market is done declining in the medium term.
- The multiple technical details that I’ve been discussing in the previous analyses (and also today’s issue)
- The fundamental issues regarding Europe that I’ve been covering recently. Please note that it’s a relative valuation “game” – it’s not only the case of what happens in the U.S., it’s also the case of what happens in other monetary areas, most importantly in the Eurozone and Japan.
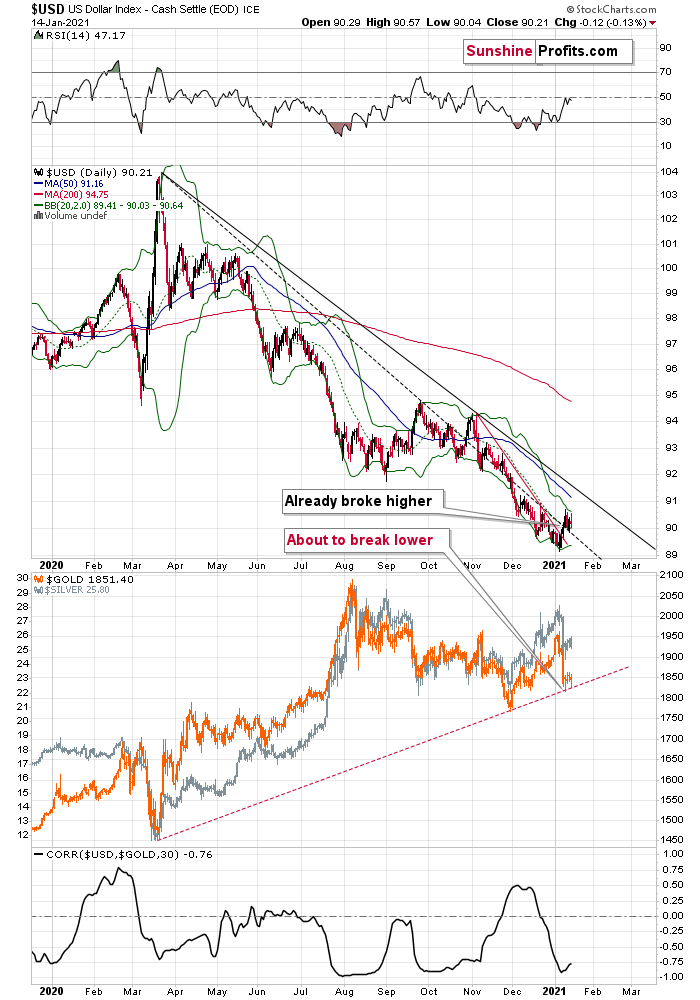
Figure 10
I added the Bollinger Bands to the above USDX chart. Please note that during bigger rallies, the USD Index does indeed move to the upper band, but then it continues to rally along with it. For instance, in mid-January 2020, the USD Index moved very close to the upper band, paused, and then continued to rally for about a month right at the upper band. So, I wouldn’t use this tool to determine the topping points.
As for the rest of your comments – you definitely have every right to have these views and to position your capital as you see fit – it’s your capital, after all. I’ve been covering these points (with regard to the precious metals market) in the previous (and today’s) analysis, so you know my views.
There’s one thing that I’d like to mention additionally with regard to just “holding” or “waiting out” a decline. If both gold and the stock market slide, then the junior mining stocks are likely to be strongly (and negatively) affected, just as we saw last year. Please note that if a value of a junior miner declines substantially – say from $1 to $0.30 and one is able to sell it for $1 and then buy back at $0.40, then the final profits will be substantially higher (if one is able to sell back above $1 that is).
Let’s say that this hypothetical junior then rallies to $5. What are the profits in both cases assuming one started with the same amount of capital?
$5 / $0.4 – 1 = profit of 1,150%
$5 / $1 – 1 = profit of 400%.
Why are we removing 1 in both equations? Because we’re talking about “profits” on the “capital on the account” and 1 represents the starting capital.
Because the hypothetical investor decided to wait it out on this hypothetical trade, they just missed the chance of getting almost 3 times as much from a single trade. Of course, one would need to be able to buy back visibly below the initial price for this strategy to yield great results. However, in my view, the miners are about to decline profoundly, so I think that we are currently in this kind of position.
Before moving to the next question - of course, the above are just hypothetical results used to make a point about the entry price being very important, because investors and traders tend to focus on the exit price while forgetting about the former. The example mentioned above by no means promises any kind of performance or profitability in the future for any trades.
Q: PR - Thanks for the response back to my previous question.
One more (two part) question... what impact do you think that the proposed U.S. stimulus package of somewhere between one and two trillion dollars will have on the price of gold in the short and midterm.
As well, based on your analysis today, will the dollar decline again with the proposed stimulus?
In other words, is there a reasonable probability that the stimulus will provide a tailwind to Gold --- or is the stimulus really just preventing further deflation and/or insolvency deleveraging?
As always, I really appreciate the timely and detailed analysis.
A: We already “saw the reply” to the first question. The information became known about the stimulus, so markets – being forward looking – have already taken this information into account. In short, gold shrugged it off. The same with the USD Index. Actually, this action is bullish for the USDX and bearish for gold, because both should have moved based on this piece of news (USDX down and gold up) and they didn’t really do so.
My previous comments remain up-to-date in light of the above. Namely, the long-term fundamentals for gold and the rest of the PM sector remain great, but in the short- and (perhaps) the medium term, PMs are likely to fall as the USD Index rallies and (perhaps) as the stock market falls.
Q: Hello Mr. Radomski,
I'm sure you you've had many people ask this question already, but I would like to hear your opinion on what happens to Gold and Silver WHEN President Trump is back in office for these next 4 years?? This is a serious question that I have and truly believe.. Would Gold/Silver go up or stay stagnant?? Hope you would be so kind to steer me in the right direction with this, if you would please?
A: If, by saying “WHEN”, you mean President Trump continuing to stay in office right now, then I already replied to this question and you will find my reply in Tuesday’s (Jan. 12) analysis.
If, however, you are referring to the possibility of Trump getting back into the office of the president in another 4 years (next election), then it’s way too early to tell what the effect would be, because a lot would depend on the stage in which the precious metals market is at, and also based on how unexpected his return would be at that time. In 2016, his victory was unexpected, so the markets were shocked, and gold was very volatile. Gold soared at first, but then declined shortly thereafter. However, it seems that the next hypothetical victory would not be as unexpected, so the PMs market could react differently. Again, it’s too early to tell.
Overview of the Upcoming Decline
- As far as the current overview of the upcoming decline is concerned, I think it has already begun.
- During the final part of the slide (which could end within the next 1-12 weeks or so), I expect silver to decline more than miners. That would align with how the markets initially reacted to the COVID-19 threat.
- The impact of all the new rounds of money printing in the U.S. and Europe on the precious metals prices is incredibly positive in the long run, which does not make the short-term decline improbable. Markets can and will get ahead of themselves and decline afterward – sometimes very profoundly – before continuing with their upward climb.
- The plan is to exit the current short positions in miners after they decline far and fast, but at the same time, silver drops just “significantly” (we expect this to happen in 0 – 5 weeks ). In other words, the decline in silver should be severe, but the decline in the miners should look “ridiculous”. That’s what we did in March when we bought practically right at the bottom . It is a soft, but simultaneously broad instruction, so additional confirmations are necessary.
- As a point of reference, given that the inverse pattern above mirrors today’s price action, the duration of the precious metals’ decline could last longer than my initial forecast. Keep in mind though, a prolonged bear market is not my base case; I’m merely indicating that the possibility exists.
- The final bottom in gold could form close to $1,500, after a temporary rebound from about $1,700. The $1,700 is likely to correspond to a move to about $31 in the GDX ETF. We will likely exit the short positions at that time, and we might even open quick long positions. During the next move lower silver might decline more than gold and miners, so we might focus on shorting that market at that time.
- The precious metals market's final bottom is likely to take shape when gold shows significant strength relative to the USD Index . It could take the form of a gold’s rally or a bullish reversal, despite the ongoing USD Index rally.
Summary
Summing up, the outlook for gold and the rest of the precious metals market is bearish for at least the next few weeks. After topping at its triangle-vertex-based reversal, gold moved sharply lower and it just invalidated the breakout above its declining resistance line, while breaking below the rising support line. All this happened as the USD Index rallied visibly above its declining resistance lines and invalidated the breakdown below the 2020 lows. This creates a strongly bearish combination for the precious metals market.
The USD Index and cryptocurrencies suggest that we’re seeing the repeat of early 2018, when the USD Index bottomed. Given the current correlations between PMs and the USD Index, the rally in the USDX is likely to have very bearish implications for the precious metals market.
Despite a recent decline, it seems that the USD Index is going to move higher in the following months and weeks, in turn causing gold to decline. At some point gold is likely to stop responding to dollar’s bearish indications, and based on the above analysis, it seems that this is already taking place.
Naturally, everyone's trading is their responsibility. But in our opinion, if there ever was a time to either enter a short position in the miners or increase its size if it was not already sizable, it's now. We made money on the March decline, and on the March rebound, with another massive slide already underway.
After the sell-off (that takes gold to about $1,500), we expect the precious metals to rally significantly. The final part of the decline might take as little as 1-5 weeks, so it's important to stay alert to any changes.
Most importantly, please stay healthy and safe. We made a lot of money on the March decline and the subsequent rebound (its initial part) price moves (and we'll likely earn much more in the following weeks and months), but you have to be healthy to enjoy the results.
As always, we'll keep you - our subscribers - informed.
To summarize:
Trading capital (supplementary part of the portfolio; our opinion): Full speculative short positions (300% of the full position) in mining stocks is justified from the risk to reward point of view with the following binding exit profit-take price levels:
Senior mining stocks (price levels for the GDX ETF): binding profit-take exit price: $32.02; stop-loss: none (the volatility is too big to justify a SL order in case of this particular trade); binding profit-take level for the DUST ETF: $28.73; stop-loss for the DUST ETF: none (the volatility is too big to justify a SL order in case of this particular trade)
Junior mining stocks (price levels for the GDXJ ETF): binding profit-take exit price: $42.72; stop-loss: none (the volatility is too big to justify a SL order in case of this particular trade); binding profit-take level for the JDST ETF: $21.22; stop-loss for the JDST ETF: none (the volatility is too big to justify a SL order in case of this particular trade)
For-your-information targets (our opinion; we continue to think that mining stocks are the preferred way of taking advantage of the upcoming price move, but if for whatever reason one wants / has to use silver or gold for this trade, we are providing the details anyway. In our view, silver has greater potential than gold does):
Silver futures downside profit-take exit price: unclear at this time - initially, it might be a good idea to exit, when gold moves to $1,703.
Gold futures downside profit-take exit price: $1,703
Long-term capital (core part of the portfolio; our opinion): No positions (in other words: cash
Insurance capital (core part of the portfolio; our opinion): Full position
Whether you already subscribed or not, we encourage you to find out how to make the most of our alerts and read our replies to the most common alert-and-gold-trading-related-questions.
Please note that we describe the situation for the day that the alert is posted in the trading section. In other words, if we are writing about a speculative position, it means that it is up-to-date on the day it was posted. We are also featuring the initial target prices to decide whether keeping a position on a given day is in tune with your approach (some moves are too small for medium-term traders, and some might appear too big for day-traders).
Additionally, you might want to read why our stop-loss orders are usually relatively far from the current price.
Please note that a full position doesn't mean using all of the capital for a given trade. You will find details on our thoughts on gold portfolio structuring in the Key Insights section on our website.
As a reminder - "initial target price" means exactly that - an "initial" one. It's not a price level at which we suggest closing positions. If this becomes the case (like it did in the previous trade), we will refer to these levels as levels of exit orders (exactly as we've done previously). Stop-loss levels, however, are naturally not "initial", but something that, in our opinion, might be entered as an order.
Since it is impossible to synchronize target prices and stop-loss levels for all the ETFs and ETNs with the main markets that we provide these levels for (gold, silver and mining stocks - the GDX ETF), the stop-loss levels and target prices for other ETNs and ETF (among other: UGL, GLL, AGQ, ZSL, NUGT, DUST, JNUG, JDST) are provided as supplementary, and not as "final". This means that if a stop-loss or a target level is reached for any of the "additional instruments" (GLL for instance), but not for the "main instrument" (gold in this case), we will view positions in both gold and GLL as still open and the stop-loss for GLL would have to be moved lower. On the other hand, if gold moves to a stop-loss level but GLL doesn't, then we will view both positions (in gold and GLL) as closed. In other words, since it's not possible to be 100% certain that each related instrument moves to a given level when the underlying instrument does, we can't provide levels that would be binding. The levels that we do provide are our best estimate of the levels that will correspond to the levels in the underlying assets, but it will be the underlying assets that one will need to focus on regarding the signs pointing to closing a given position or keeping it open. We might adjust the levels in the "additional instruments" without adjusting the levels in the "main instruments", which will simply mean that we have improved our estimation of these levels, not that we changed our outlook on the markets. We are already working on a tool that would update these levels daily for the most popular ETFs, ETNs and individual mining stocks.
Our preferred ways to invest in and to trade gold along with the reasoning can be found in the how to buy gold section. Furthermore, our preferred ETFs and ETNs can be found in our Gold & Silver ETF Ranking.
As a reminder, Gold & Silver Trading Alerts are posted before or on each trading day (we usually post them before the opening bell, but we don't promise doing that each day). If there's anything urgent, we will send you an additional small alert before posting the main one.
Thank you.
Przemyslaw Radomski, CFA
Founder, Editor-in-chief

