

Briefly: in our opinion, full (250% of the regular size of the position) speculative short positions in gold, silver and mining stocks are justified from the risk/reward perspective at the moment of publishing this alert.
We often wrote that the weekly closing prices are more important than the daily and – in particular – intraday prices. It’s simply a reflection of the fact that the markets can act on random and / or emotional factors, but when it’s all said and done, they once again start to reflect the real, meaningful values. Many traders open and close positions within the session and some of them exit their positions before the end of the week. Sometimes – in case of expiring options – the positions are closed for them. Either way, The weekly values are critical when trying to determine where a given market is about to move and the precious metals market is not an exception from this rule. Since we just saw the weekly closes, let’s check what changed, what didn’t, and – most importantly – what’s next.
In short, we saw multiple confirmations of what we wrote earlier, and it appears that the next big downswing has just begun. The number of factors that currently points to the bearish outcome is astonishing. Let’s jump right into the charts for details (charts courtesy of http://stockcharts.com).
Gold’s Local Volume Analogy
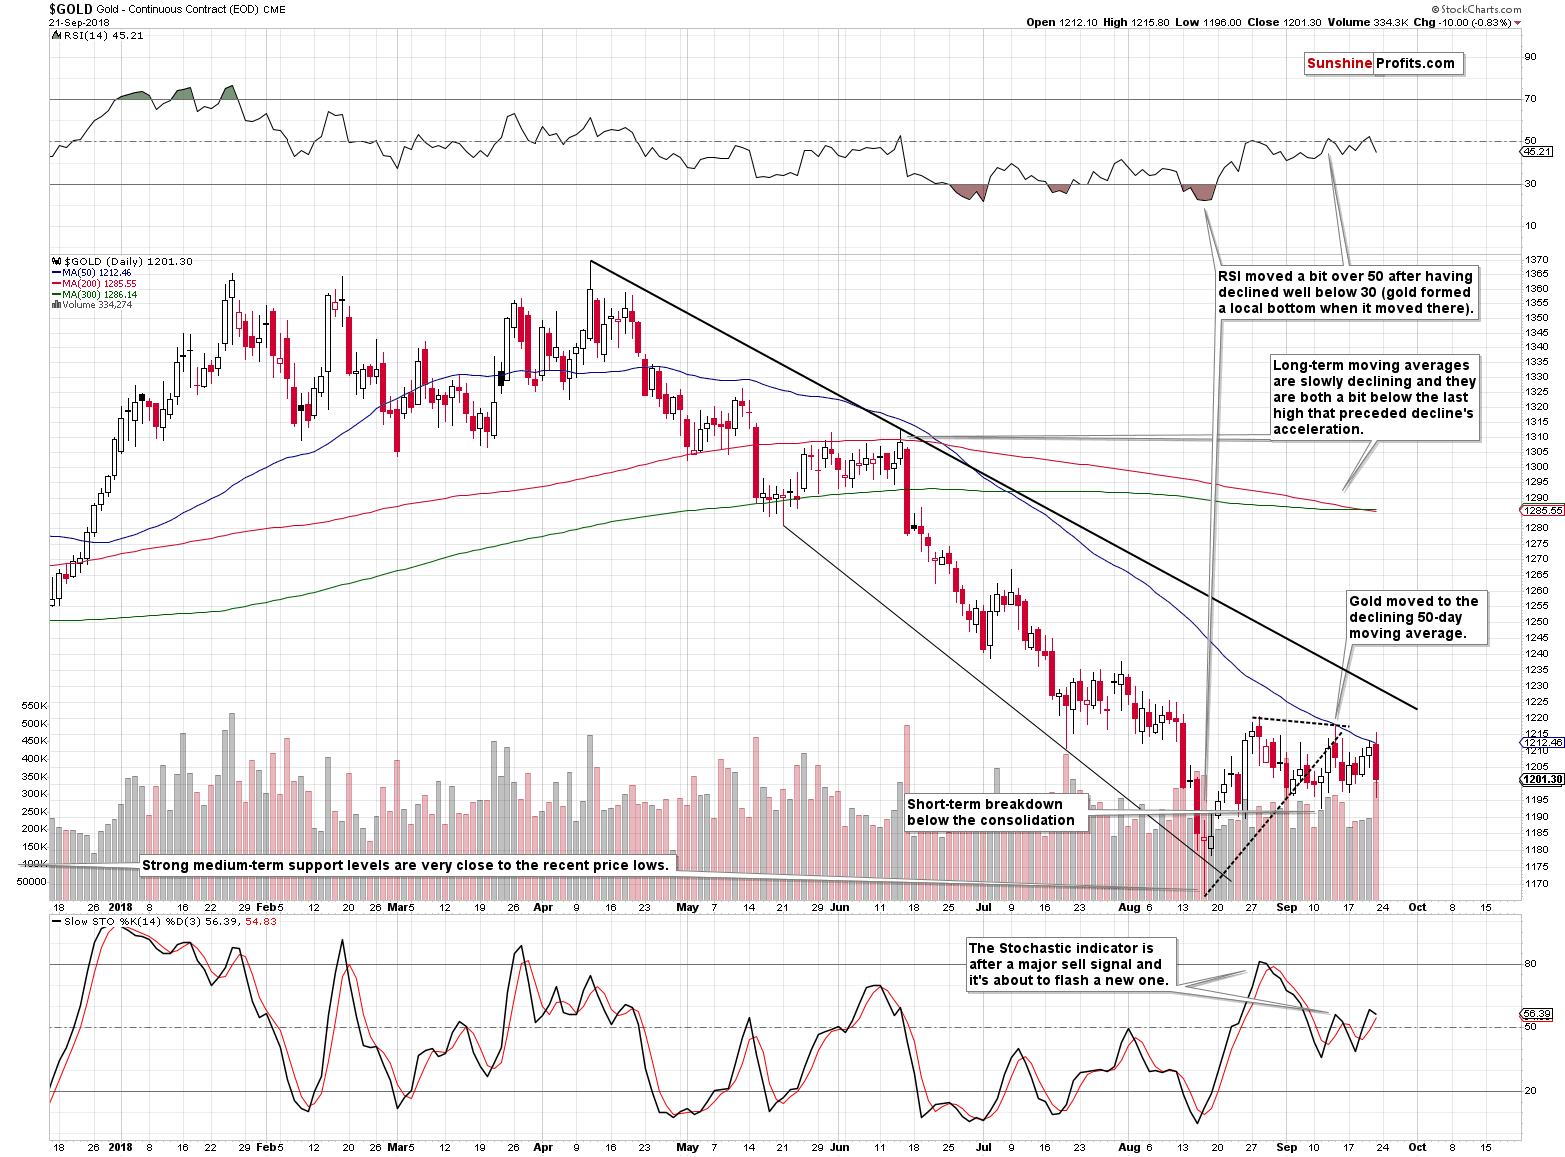
Gold declined on big volume and while the size of the price move was not huge, it was significant enough to make Friday’s decline similar to two cases from the recent past.
The first one is the decline that we saw on May 15, and the second one is the June 15 slide. What makes these declines similar to the current one is both: the relatively big volume, and the fact that we saw all of them after a bigger sideways trading pattern.
Both previous sessions market the starting points of major declines (the first one was not immediately followed by lower prices, but they followed eventually anyway), so the current implications are bearish.
To be objective, the above analogy is not particularly strong, but it’s just one of the small cherries on the big bearish analytical cake.
Silver’s performance is a stronger bearish sing.
Silver’s Final Fake Upswing
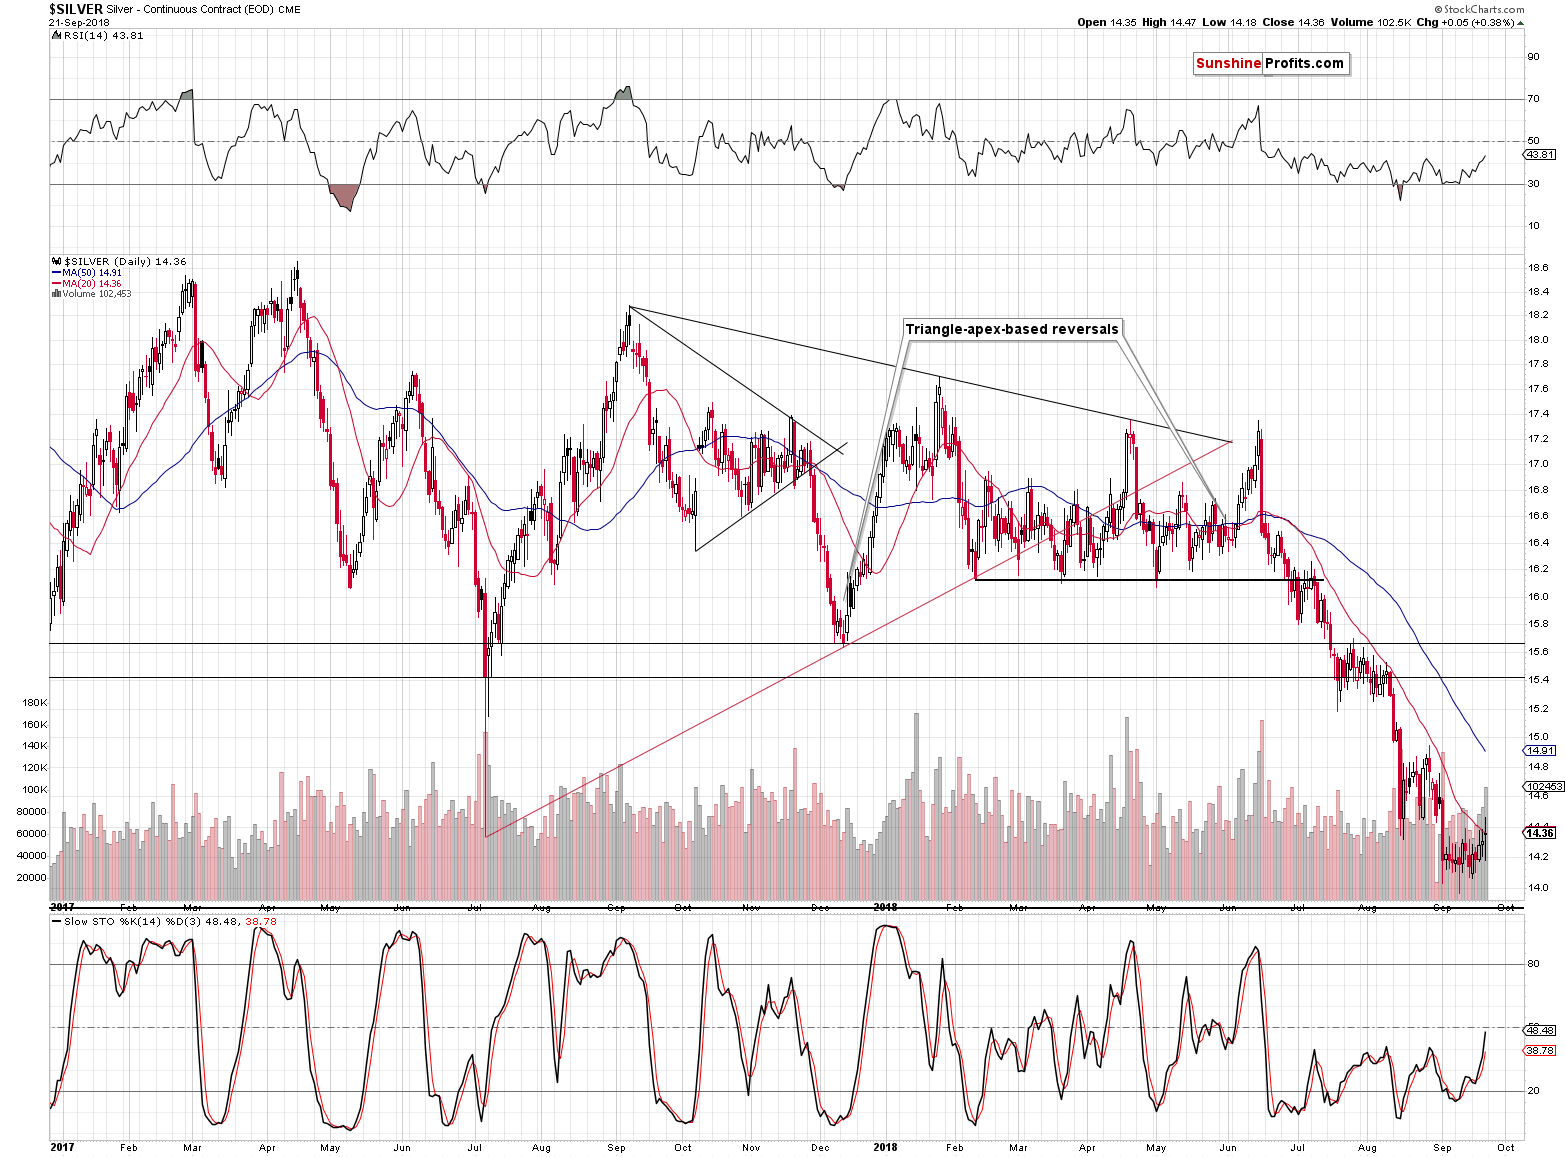
The white metal also moved on strong volume, and while spot silver ended the session lower, we saw a small upswing in case of silver futures. Moreover, silver moved higher on an intraday basis than gold did (comparing to the previous local highs), which is something that we very often see right before the sizable declines. Silver rallies are often fake, if they are not accompanied by analogous signs from other markets. Gold and miners declined on Friday, so this was definitely not the case.
The above is an extension of the signal that we had already discussed previously, by commenting on the SLV to GLD ratio on Thursday. Precisely, it’s a confirmation of the implications that we already had based on the ratio of the above ETFs’ volumes:
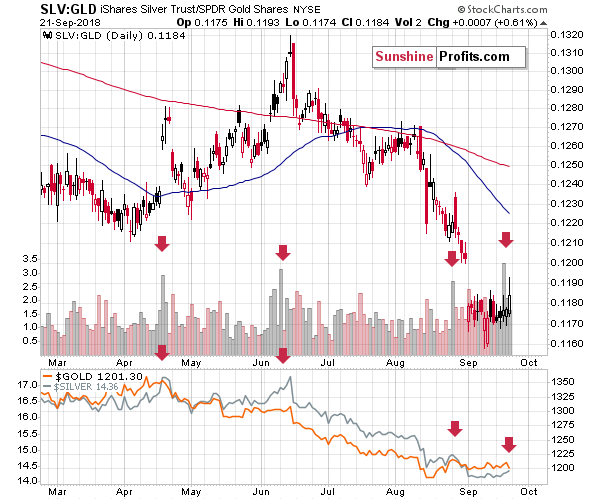
The above chart is quite self-explanatory. The red arrows mark cases when we saw huge volume spikes in the ratio. More precisely, they show spikes in the ratio of volumes, as the ratio, by itself, doesn’t have any volume.
On numerous occasions, we wrote that silver tends to be the metal of choice right before the local tops and before sizable price declines. We don’t want to get into details here, because it’s already after 8 AM EST, and we want to get this analysis to you ASAP, but we want to say that this phenomenon can be seen not only through the relative price movement, but also when looking at volume levels.
This is particularly useful right now, given the long-term breakout in the gold to silver ratio and the technical inability of silver to really outperform gold.
The spike in the ratio of volumes was the highest in months, which makes it very likely that we are at a major top or very close to one. We saw this signal a few times earlier this year and, in all cases, big price declines in gold and silver followed – if not immediately, then shortly.
We now have it all – the initial indication from the ratio of volumes, and the subsequent spike in the price ratio itself. The situation is now just as it was at / just before the April, June, and August declines. The implications are strongly bearish for the short and medium term.
Platinum’s Breakdown
In Friday’s analysis, we wrote the following:
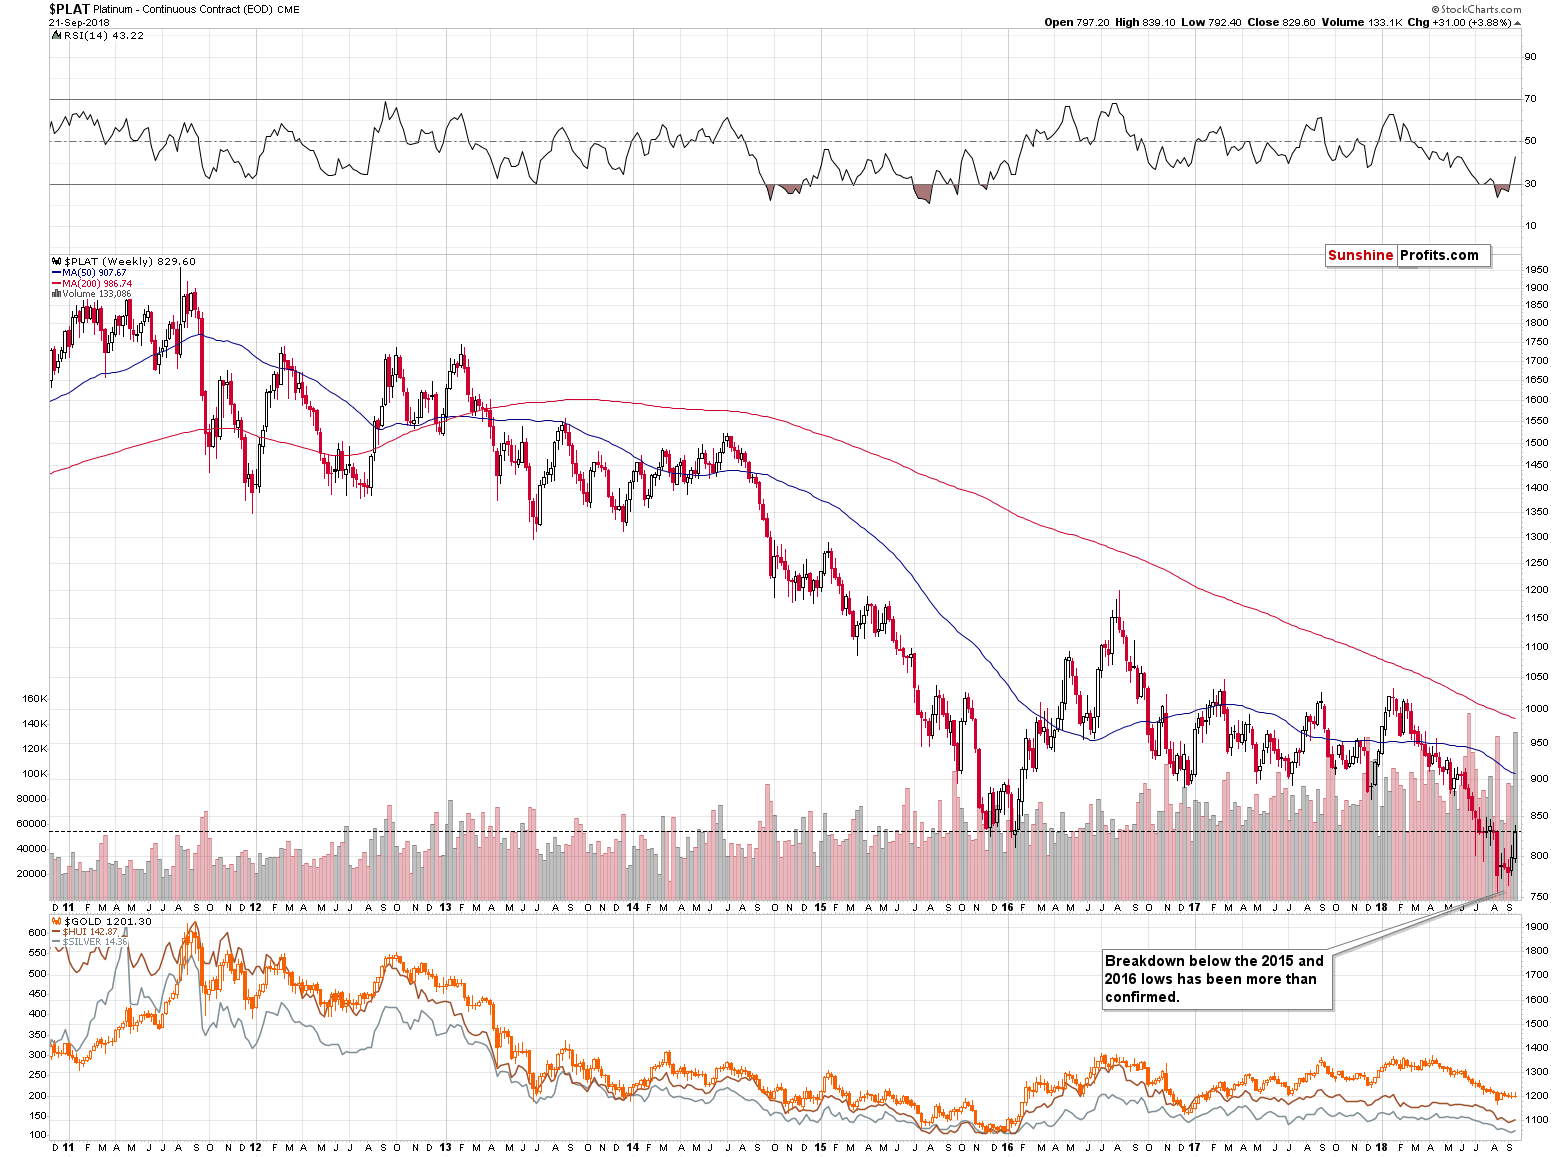
The week is ending today and it will be interesting to see where platinum closes it. The lowest weekly close of 2016 was $830.90 and at the moment of writing these words, platinum is trading at $836, so it’s almost right at this important resistance level. Precisely, it’s above it, but since resistance is based on the weekly closing prices and we have a full session ahead of us, there are no meaningful implications yet.
If we see a weekly close above the $830.90, this might change the short-term outlook for platinum, but without meaningful bullish confirmations from other parts of the PM sector, it would be unlikely to trigger a sizable rally in gold or silver.
Platinum closed the week at $829.60, which means that there was no invalidation of the previous breakdown. This means that at the same time:
- There was nothing really bullish about last weeks upswing.
- The upside is very limited as very strong resistance is just above Friday’s closing price.
The above is a very bearish combination.
Speaking of weekly closing prices and bearish confirmations, let’s take a look at the mining stocks to other stocks ratio.
Gold Miners’ Verified Breakout
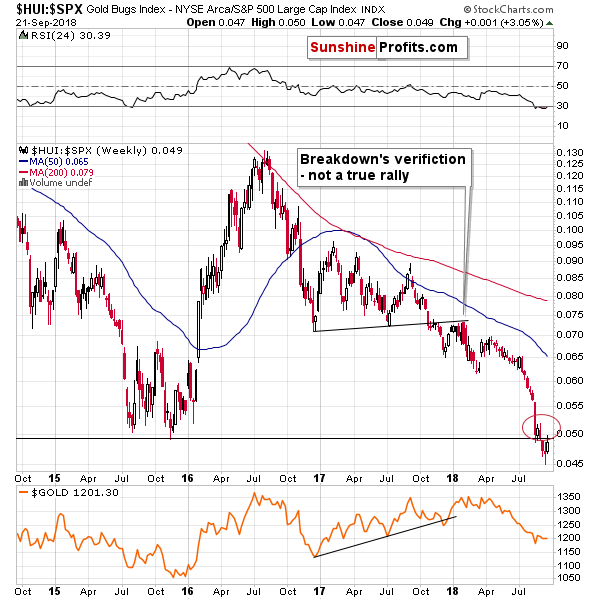
On Thursday, we wrote the following:
Some time ago, we reported the breakdown in the gold stocks to other stocks ratio. The implications were profoundly bearish for the medium term and they still are. The thing is…
That this breakdown is being verified. The ratio moved slightly above its previous low in intraday terms, but intraday values are of little meaning in case of such long-term price moves. In terms of the closing prices, the breakdown was not invalidated. Conversely, the ratio moved back to the 2015 lows, which suggests that the end of the rally is at hand or it was already reached.
Based on the weekly closing prices, the breakdown was verified and there was no invalidation to speak of. The implications remain strongly bearish and the upside is very limited.
Miners’ Reversal
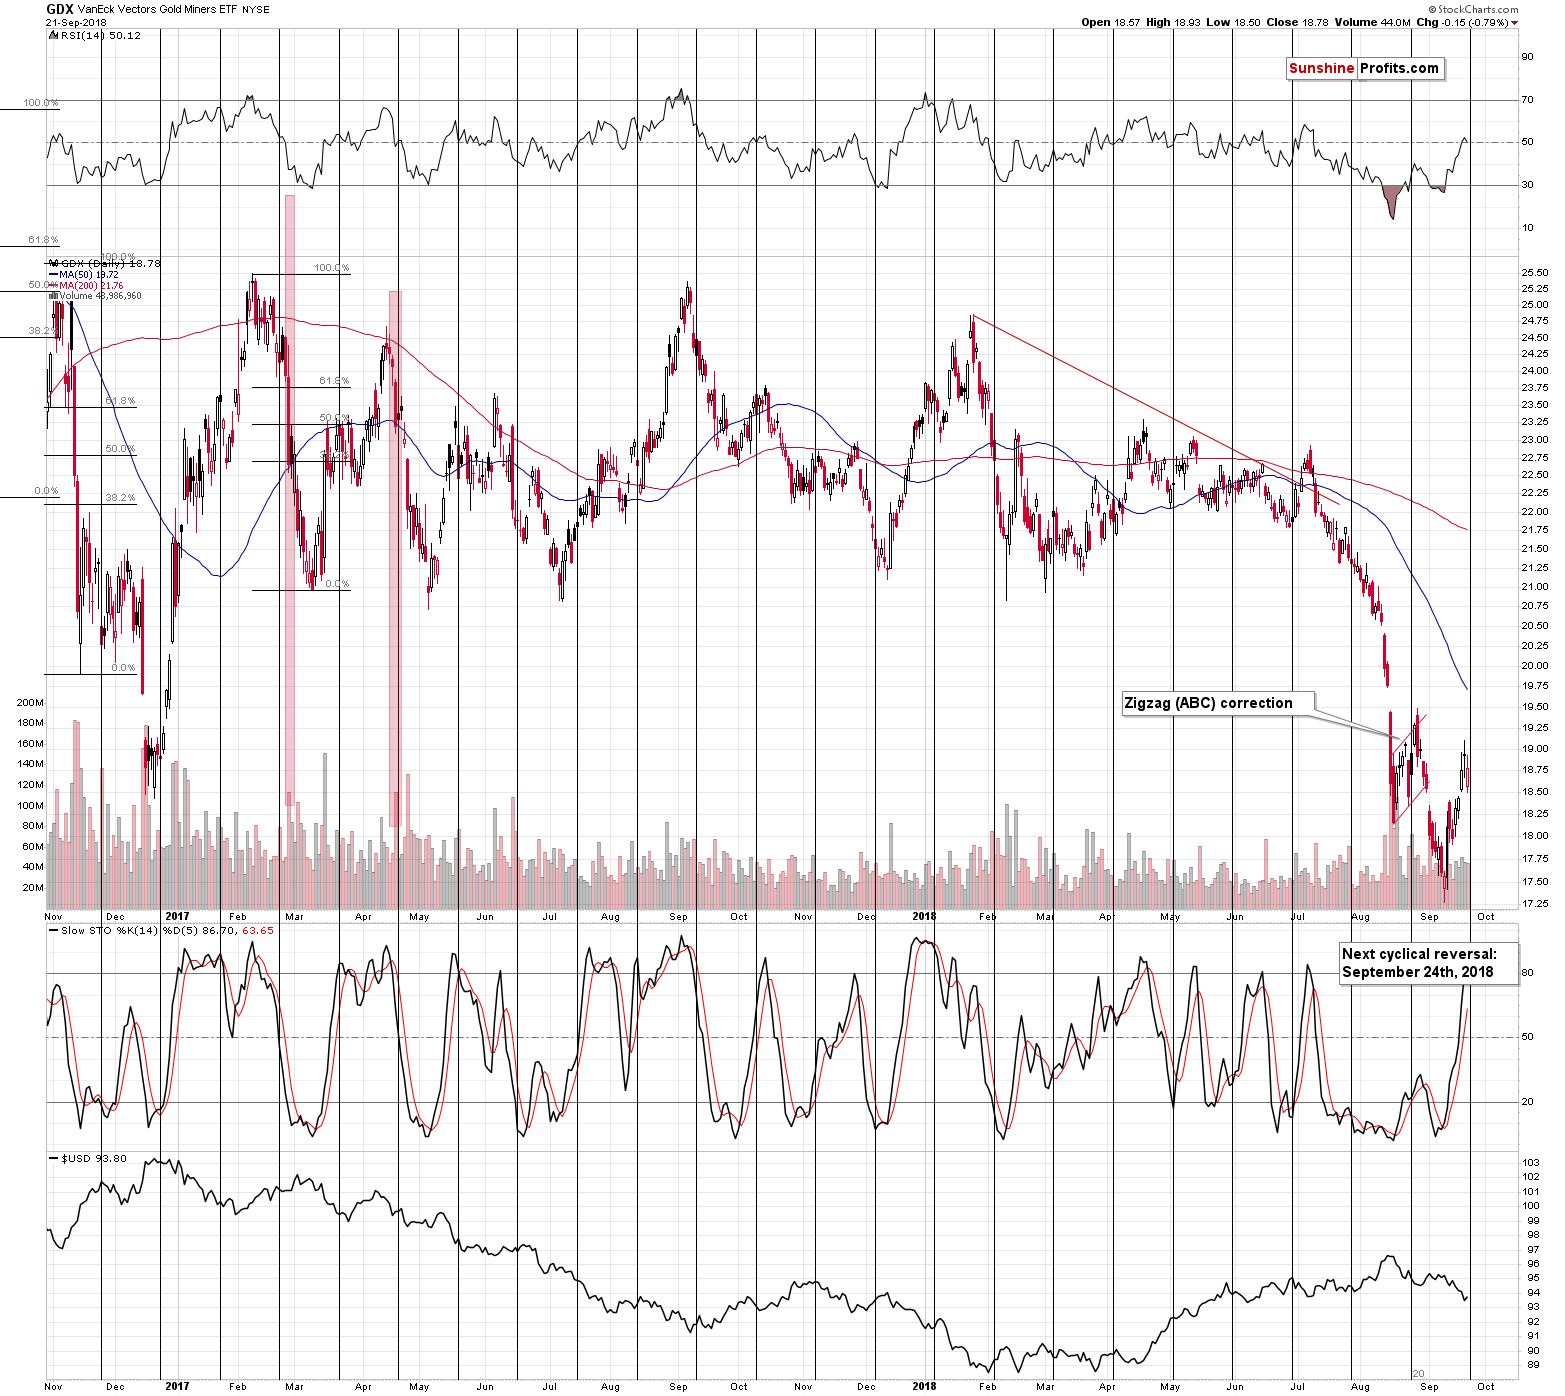
As far as the performance of mining stocks is concerned, it seems that the top is already in. Miners reversed right before the cyclical turning point. These points tend to work on a near-to basis, which means that the reversal is quite believable.
Moreover, the Stochastic indicator moved above the 80 level, which makes the current situation similar to what happened in early July 2018 – right before the biggest slide of the past years.
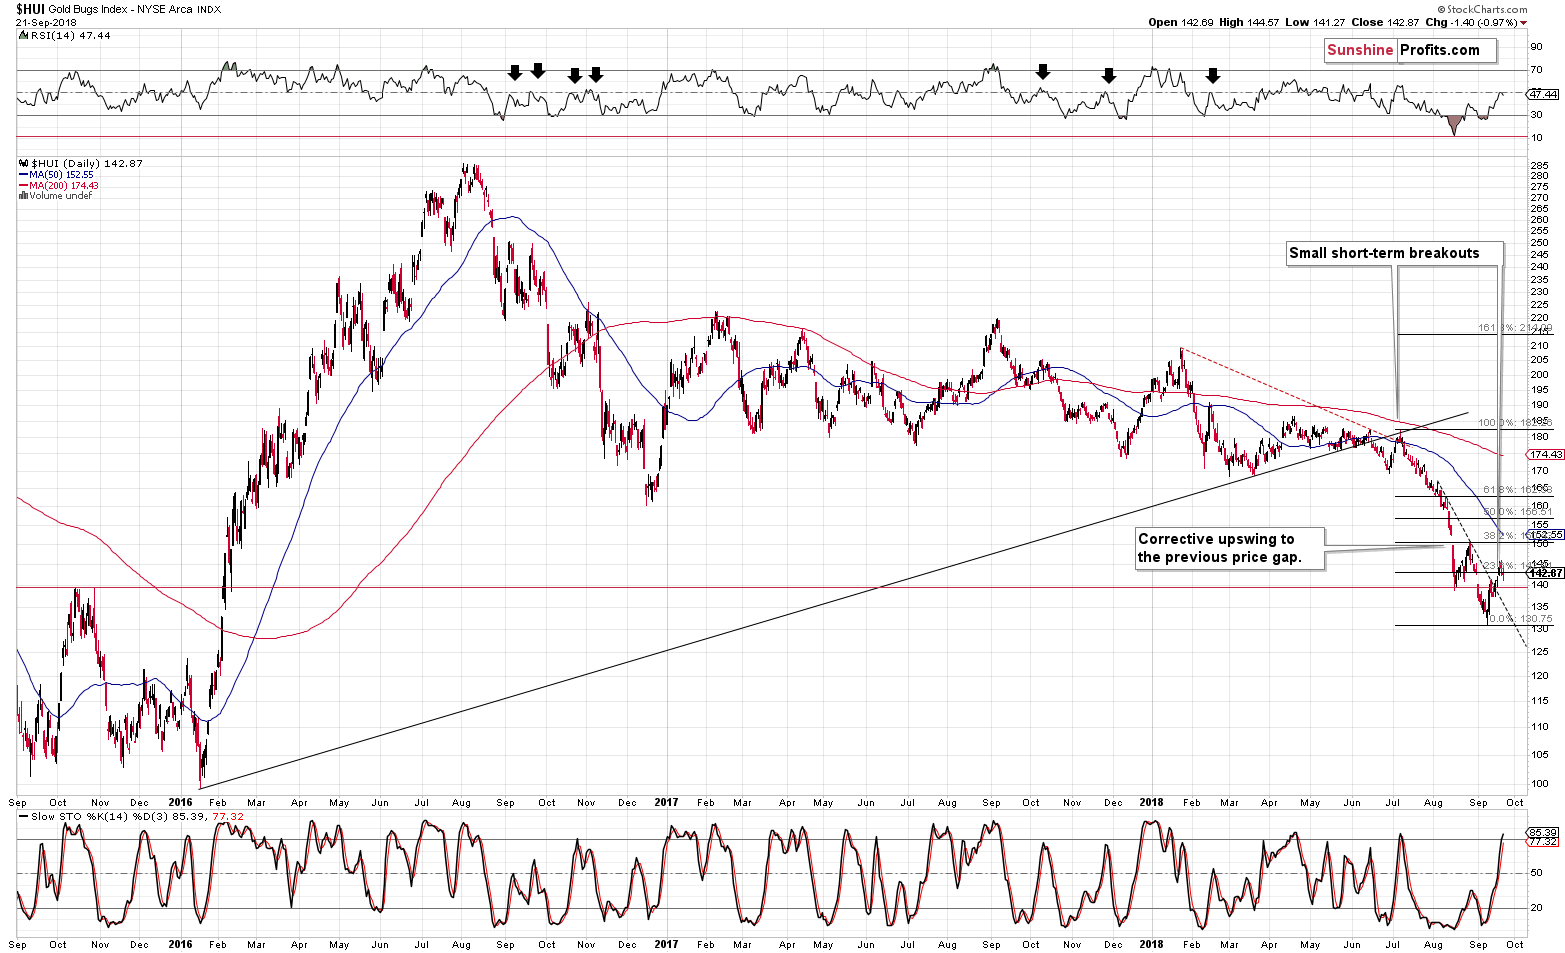
In the previous alerts, we commented on the above HUI Index chart in the following way:
(…) even on the above chart we can see a big warning sign in the form of the RSI indicator at about 50. That’s more or less where we had very often seen this indicator during the final parts of the counter-trend rallies that were parts of bigger declines. We marked those cases with black arrows on the above chart. The implication is that this rally is likely over or about to be over.
(…)
Practically nothing changed except for HUI’s Stochastic indicator, which moved to about 80. This level quite often meant that the local top is either in or at hand. For instance, we saw moves to approximately 80 in late October 2016, several days before the big November slide, and in early July 2018 – before the current decline started.
The bearish implications of the above remain in place.
Unchanged Currency Indications
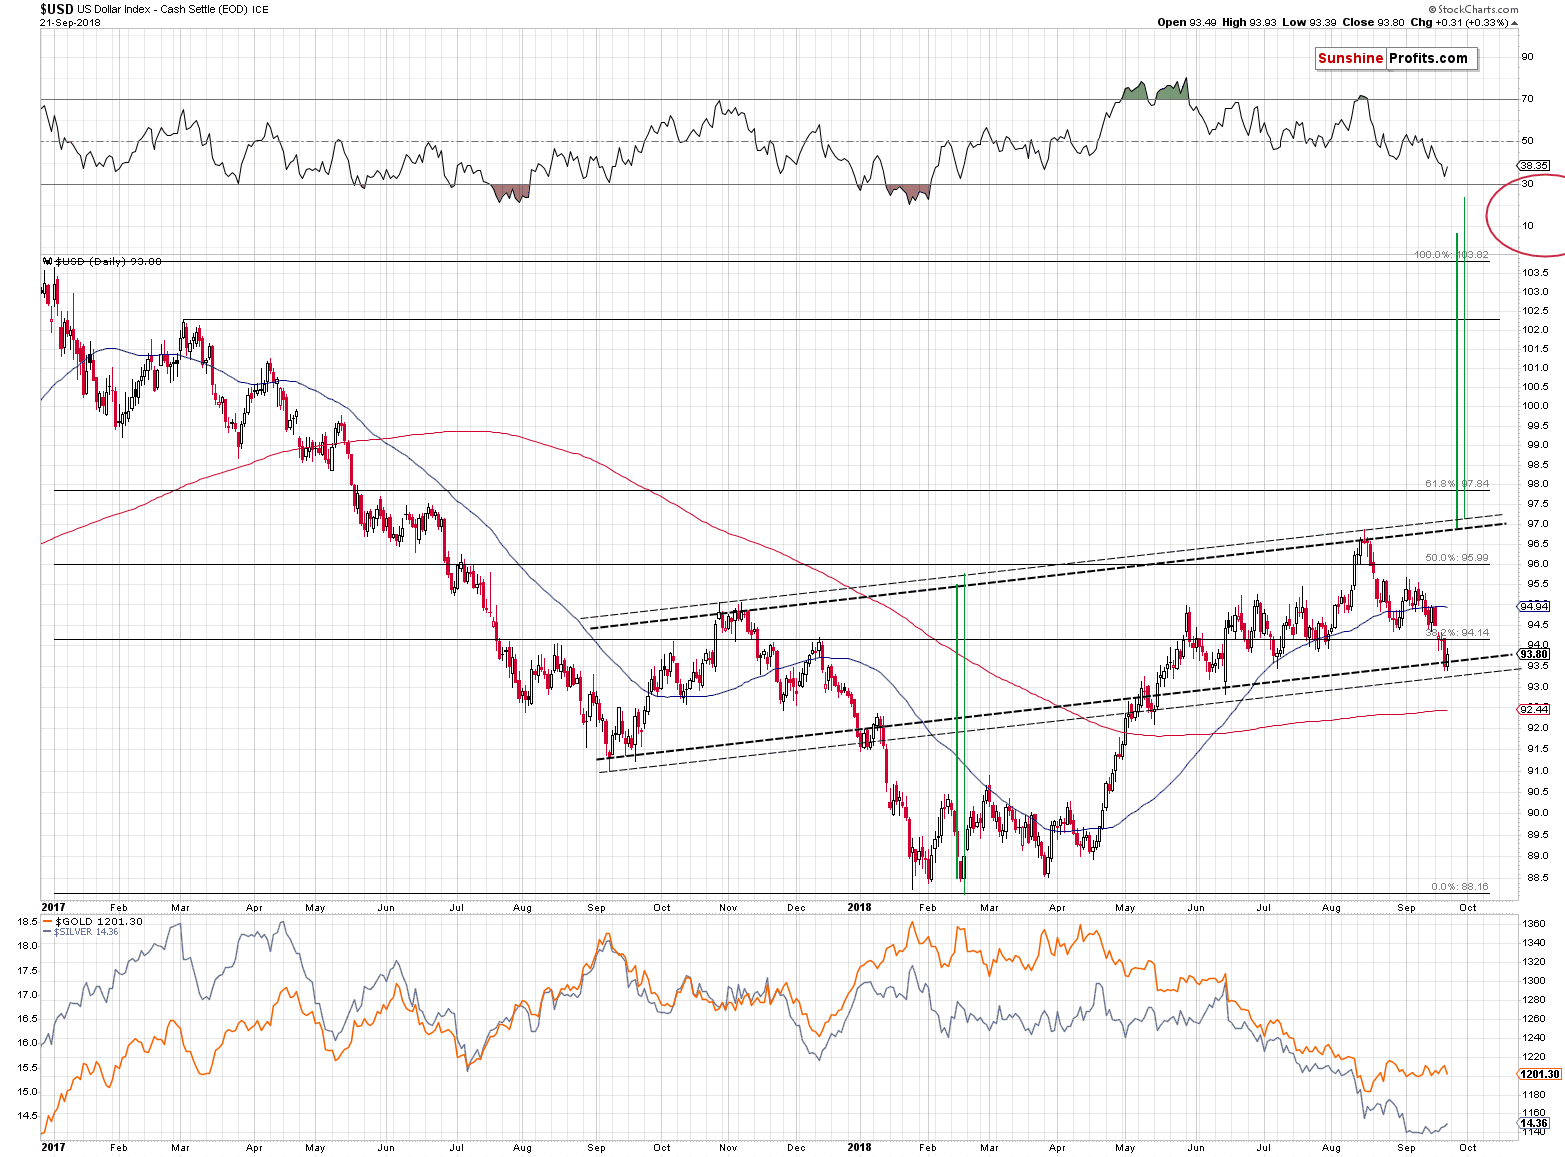
On Friday, we wrote the following:
In short, the USDX moved to one of the rising support lines and at the same time it seems to have completed a zigzag correction. Interestingly, the rally that started in the first quarter of this year is symmetrical to the decline that preceded it. The April – May 2018 rally is similar to the December 2017 decline and the same goes for the rest of the move. The October – December 2017 top took form of a head-and-shoulders pattern and it seems that we have also seen a similar pattern in the USDX (July high being the left shoulder, and the early September top being the right shoulder). And, just like the September – October 2017 zigzag started the previous correction, the August – September 2018 zigzag might be ending the current one. The implications of this specific symmetry are bullish for the USDX and bearish for the precious metals sector.
The above remains up-to-date and the thing that we would like to add today is that gold needed only a bit strength from the USDX to decline in a visible way (and on significant volume). This kind of relative performance combined with the above-described outlook for the USDX have bearish implications for the precious metals market.
But, even if the gold-USDX link weakened and its predictive strength is currently not as what it used to be, then we are still likely to get meaningful signals from the analysis of the Japanese yen, as the situation in the latter should be relatively unaffected by the UK-EU dilemma.
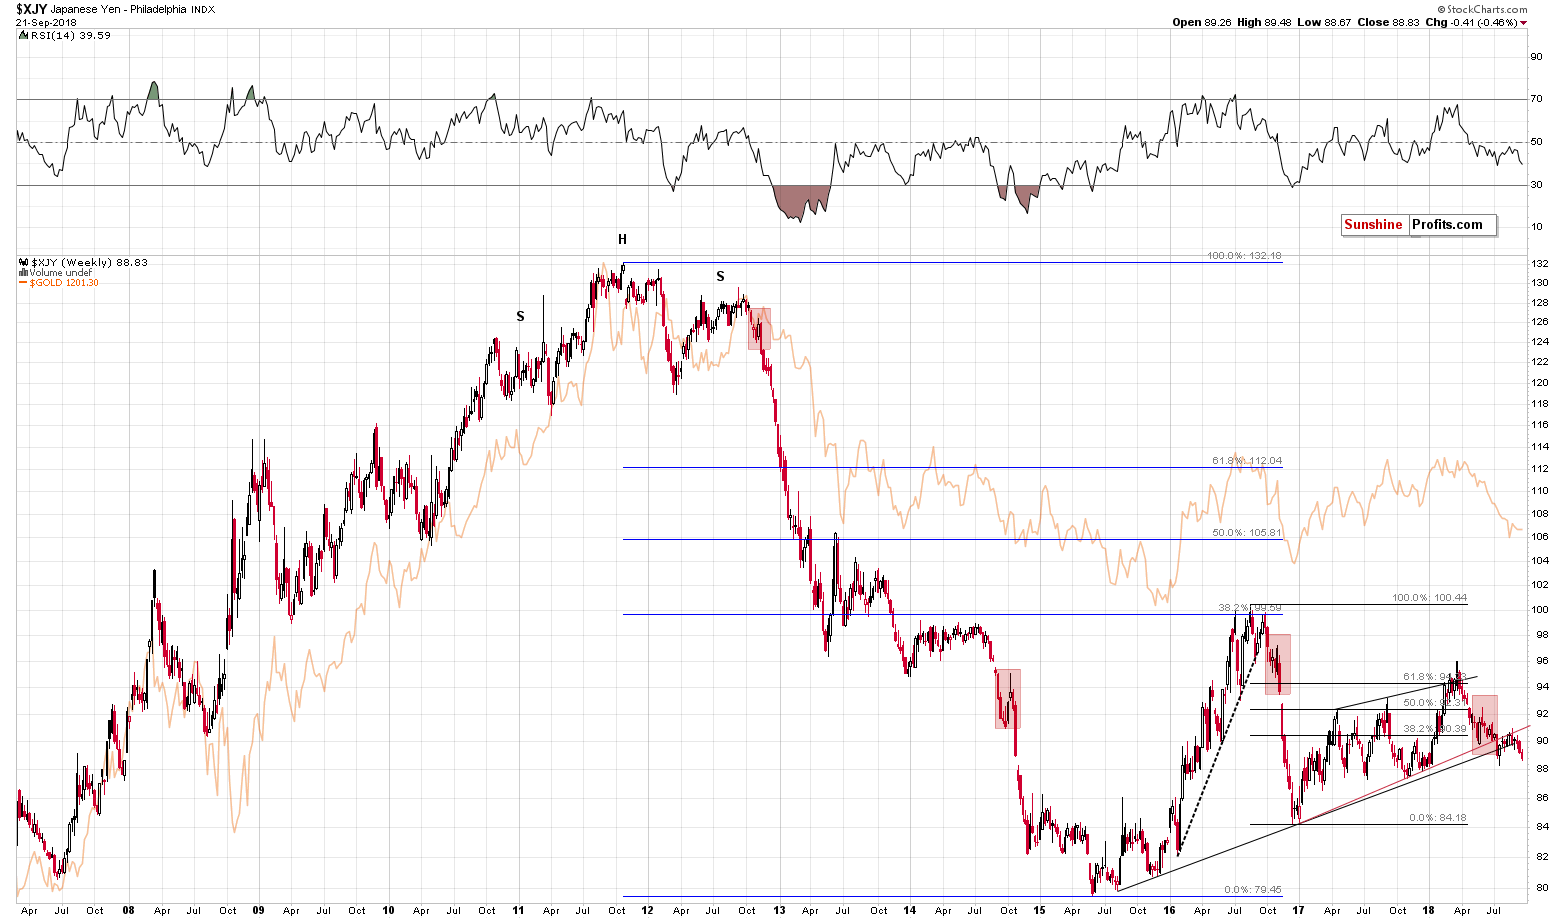
Our previous comments on the above chart are more than up-to-date, as we saw another weekly close below the rising, medium-term resistance line:
The yen simply points to lower values of both: the currency and the price of gold. Last week, we saw a major breakdown below he rising long-term support line. Since the yen declined also this week, the move is getting confirmed and the implications are getting increasingly more bearish.
Before summarizing, we would like to quote the key parts of our previous Alerts, as they remain up-to-date and are of utmost important to those who have just joined our services. If you’ve read the following two sections, you can safely skip to the summary as there are no changes in them.
Research, Investment, and Results
We recently received quite a few questions about the use of specific financial instruments and what should one do if they owned them (for instance, specific type of options). We cannot provide investment advice, and unfortunately telling someone (specifically) what they should do with a given financial instrument falls under the definition of such advice. Consequently, instead of providing the above, we planned to discuss some of the issues through this publication that is not directed to just one person, but that is used to present our opinions in general terms. However, during the process of writing our reply, we digressed so much that the comments turned into something else – perhaps even more useful to you.
What we ended up creating, is the list of key factors that determine whether a given trade is successful or not. It may appear that the success of a given trade depends on just one factor – being correct about a given price move or not. But the reality is not that simple.
- The first thing is thorough research and this is what we are helping you with through our Alerts as this is something objective. The same research is useful for many investors and traders.
- The second thing is timing and that is also what we are helping you with. We’re keeping you up-to-date through our regular Alerts and through the occasional intraday follow-ups. Again, the timing-related Alerts are useful for many investors and traders.
- The third thing is the choice of investment / trading vehicles. This is not something objective and thus this is not something that we can choose for you. At least not through a newsletter arrangement. Some investors will be able to take on leverage as they are experienced in trading and know that they are using capital that they can afford to lose. And some –
beginning investors and those who are using capital that they cannot
lose – should think at least twice before applying leverage. Some people
will prefer options because of the flexibility they provide, but some
will stick to traditional stock market purchases and sales. It all
depends on investor-specific factors. The key thing is that we can’t
tell you what you should choose, because that would be an investment
advice – which we can’t provide.
Naturally, in case of other arrangements, for instance through private investment fund or through managed futures trading and through private investment fund, we are able to manage the investment vehicles directly, but this is not possible through a newsletter.
Consequently, the choice of the investment / trading vehicle is yours to make. We can provide the information regarding various choices and we strive to explain their details etc., but the final call is up to you. For instance, we do the above by providing you with a list of investment / trading choices in general, an extensive list of ETFs, ETNs, several tools for choosing options: Position Size Calculator helps in choosing the expiration dates, the Pyramid Optimizer helps to choose the strike price, and the Option Calculator can help you make quick option pricing simulations. Speaking of options, in our opinion, it’s a good rule to give yourself at least (!) an extra month to any price/time prediction in order to lower the risk of options expiring before the price managed to move to its target. - The fourth thing is choosing the correct position size. Like above, this is something that we can do for our clients in case of the private investment fund and in case of the managed futures trading, but it’s not something that we can do through a newsletter. We strive to provide our thoughts in a way that makes it easier for you to make the decision regarding the position size (discussing the percentages of a regular size of a given position), but it will need to be you, who decides what the default position size can be. In this report you can read how important it is not to bet too much, and in this essay, you’ll see a simple simulation of what could happen if the position sizes are too big (it might be better to start with this one, and read the detailed pdf report later on). For general guidelines regarding the “trading capital”, and “investment capital”, please refer to our Gold & Silver Portfolio analysis. In the final part of that analysis, you’ll find pictures with sample portfolio structures for long-term investors, traders, and beginners. The rule of thumb is that if you can’t sleep well because of how big your position is, then it should be decreased by at least 30%. The same applies if you’re getting emotional about a given trade. For instance, we just saw a relatively small setback in profitability in case of the current short position - the profits on this single trade are multiple times greater than this year’s S&P 500 profits. If you got scared or emotional because of the above, it might be a good idea to limit the size of the position. Or have the trades managed professionally for you.
- The fifth thing is keeping in mind that trading and investment are processes that go well beyond a single trade. Moreover, there are developments of random nature and if one wants to make any money over time, one needs to accept that. Making all the research in the world, will not give you 100% certainty that something is going to happen or that it will happen exactly as you think. At times we will do everything correctly (points 1 and 2) and you will do everything correctly (points 3 and 4) and the trade will still end up being a losing trade. It’s natural and normal. For experienced investors and traders, it’s normal to the point that they are not even sad, angry, disappointed etc. by a trade that ended in the red. It’s just part of the process. As long as you’re making sure that all the previous points are taken care of and you’re striving to learn more about investments in general, it should all work out very well in the end. It’s important to keep that in mind as it should keep the emotions at bay, even during turbulent times. This, in turn is likely to lead to more objective, and thus better investment decisions. Not to mention better sleep and better health overall due to lower levels of stress.
Important Analyses
Before summarizing, we would like to emphasize that we have recently posted several analyses that are very important and that one should keep in mind, especially in the next several weeks. If you haven’t had the chance of reading them previously, we encourage you to do so today:
- Dear Gold Investor - Letters from 2013 - Analogy to 2013, which should make it easier to trade the upcoming sizable upswing (if enough factors point to it, that is) and to enter the market close to the final bottom.
- Gold to Soar Above $6,000 - discussion of gold’s long-term upside target of $6,000.
- Preparing for THE Bottom in Gold: Part 6 – What to Buy - extremely important analysis of the portfolio structure for the next huge, multi-year rally in the precious metals.
- Preparing for THE Bottom in Gold: Part 7 – Buy-and-hold on Steroids - description of a strategy dedicated to significantly boosting one’s long-term investment returns while staying invested in the PM sector.
- Gold’s Downside Target, Upcoming Rebound, and Miners’ Buy Plan - details regarding the shape of the following price moves, a buying plan for mining stocks, and a brief discussion of the final price targets for the current decline.
- Gold: What Happened vs. What Changed - discussion of the latest extreme readings from gold’s CoT report
- Key Factors for Gold & Silver Investors - discussion of key, long-term factors that support the bearish outlook for PMs. We are often asked what makes us so bearish – this article is a reply to this question.
- The Upcoming Silver Surprise - two sets of price targets for gold, silver and mining stocks: the initial and the final one.
- Precious Metals Sector: It’s 2013 All Over Again - comparison between 2013 and 2018 throughout the precious metals sector, the general stock market and the USD Index. Multiple similarities point to the repeat of a 2013-style volatile decline in the PMs.
Summary
Summing up, it seems that the next big downswing in the precious metals sector is already underway. The mining stocks reversed very close to their turning point, while silver’s performance relative to gold is just like it was at / just before big declines in the past. The situation in the currency market and multiple other signs that we discussed in the previous Alerts point to a major decline in the precious metals market in the upcoming weeks. It seems that the huge profits on our short positions will soon become enormous.
As always, we’ll keep you – our subscribers – informed.
To summarize:
Trading capital (supplementary part of the portfolio; our opinion): Full short positions (250% of the full position) in gold, silver and mining stocks are justified from the risk/reward perspective with the following stop-loss orders and exit profit-take price levels:
- Gold: profit-take exit price: $1,062; stop-loss: $1,226; initial target price for the DGLD ETN: $82.96; stop-loss for the DGLD ETN $53.67
- Silver: profit-take exit price: $12.72; stop-loss: $15.16; initial target price for the DSLV ETN: $46.97; stop-loss for the DSLV ETN $31.37
- Mining stocks (price levels for the GDX ETF): profit-take exit price: $13.12; stop-loss: $19.61; initial target price for the DUST ETF: $80.97; stop-loss for the DUST ETF $33.37
Note: the above is a specific preparation for a possible sudden price drop, it does not reflect the most likely outcome. You will find a more detailed explanation in our August 1 Alert. In case one wants to bet on junior mining stocks’ prices (we do not suggest doing so – we think senior mining stocks are more predictable in the case of short-term trades – if one wants to do it anyway, we provide the details), here are the stop-loss details and target prices:
- GDXJ ETF: profit-take exit price: $17.52; stop-loss: $29.43
- JDST ETF: initial target price: $154.97 stop-loss: $64.88
Long-term capital (core part of the portfolio; our opinion): No positions (in other words: cash)
Insurance capital (core part of the portfolio; our opinion): Full position
Important Details for New Subscribers
Whether you already subscribed or not, we encourage you to find out how to make the most of our alerts and read our replies to the most common alert-and-gold-trading-related-questions.
Please note that the in the trading section we describe the situation for the day that the alert is posted. In other words, it we are writing about a speculative position, it means that it is up-to-date on the day it was posted. We are also featuring the initial target prices, so that you can decide whether keeping a position on a given day is something that is in tune with your approach (some moves are too small for medium-term traders and some might appear too big for day-traders).
Plus, you might want to read why our stop-loss orders are usually relatively far from the current price.
Please note that a full position doesn’t mean using all of the capital for a given trade. You will find details on our thoughts on gold portfolio structuring in the Key Insights section on our website.
As a reminder – “initial target price” means exactly that – an “initial” one, it’s not a price level at which we suggest closing positions. If this becomes the case (like it did in the previous trade) we will refer to these levels as levels of exit orders (exactly as we’ve done previously). Stop-loss levels, however, are naturally not “initial”, but something that, in our opinion, might be entered as an order.
Since it is impossible to synchronize target prices and stop-loss levels for all the ETFs and ETNs with the main markets that we provide these levels for (gold, silver and mining stocks – the GDX ETF), the stop-loss levels and target prices for other ETNs and ETF (among other: UGLD, DGLD, USLV, DSLV, NUGT, DUST, JNUG, JDST) are provided as supplementary, and not as “final”. This means that if a stop-loss or a target level is reached for any of the “additional instruments” (DGLD for instance), but not for the “main instrument” (gold in this case), we will view positions in both gold and DGLD as still open and the stop-loss for DGLD would have to be moved lower. On the other hand, if gold moves to a stop-loss level but DGLD doesn’t, then we will view both positions (in gold and DGLD) as closed. In other words, since it’s not possible to be 100% certain that each related instrument moves to a given level when the underlying instrument does, we can’t provide levels that would be binding. The levels that we do provide are our best estimate of the levels that will correspond to the levels in the underlying assets, but it will be the underlying assets that one will need to focus on regarding the signs pointing to closing a given position or keeping it open. We might adjust the levels in the “additional instruments” without adjusting the levels in the “main instruments”, which will simply mean that we have improved our estimation of these levels, not that we changed our outlook on the markets. We are already working on a tool that would update these levels on a daily basis for the most popular ETFs, ETNs and individual mining stocks.
Our preferred ways to invest in and to trade gold along with the reasoning can be found in the how to buy gold section. Additionally, our preferred ETFs and ETNs can be found in our Gold & Silver ETF Ranking.
As a reminder, Gold & Silver Trading Alerts are posted before or on each trading day (we usually post them before the opening bell, but we don't promise doing that each day). If there's anything urgent, we will send you an additional small alert before posting the main one.
=====
Latest Free Trading Alerts:
Stocks were mixed on Friday, as investors took short-term profits off the table following the recent record-breaking rally. The S&P 500 index has reached the new record high at the level of 2,940.91, before closing virtually flat. Will stocks continue higher? Or is this a topping pattern ahead of a downward reversal?
Reversal or Just Quick Correction Before Another Leg Up?
=====
Thank you.
Sincerely,
Przemyslaw Radomski, CFA
Founder, Editor-in-chief, Gold & Silver Fund Manager
Gold & Silver Trading Alerts
Forex Trading Alerts
Oil Investment Updates
Oil Trading Alerts

