

Briefly: in our opinion, full (100% of the regular position size) speculative long position in mining stocks is justified from the risk/reward point of view at the moment of publishing this Alert.
Folks, it seems that gold has formed an interim bottom, and a short-term corrective upswing is now likely, before the medium-term downtrend resumes.
Any further declines from this point are not likely to be significant for the short-term. The same applies to silver and the miners.
In yesterday’s (Mar. 4) intraday Gold & Silver Trading Alert, I described briefly why I think that the very short-term bottom is already in (or is at hand), and in today’s analysis, I’ll illustrate my points with charts. Let’s start with gold.
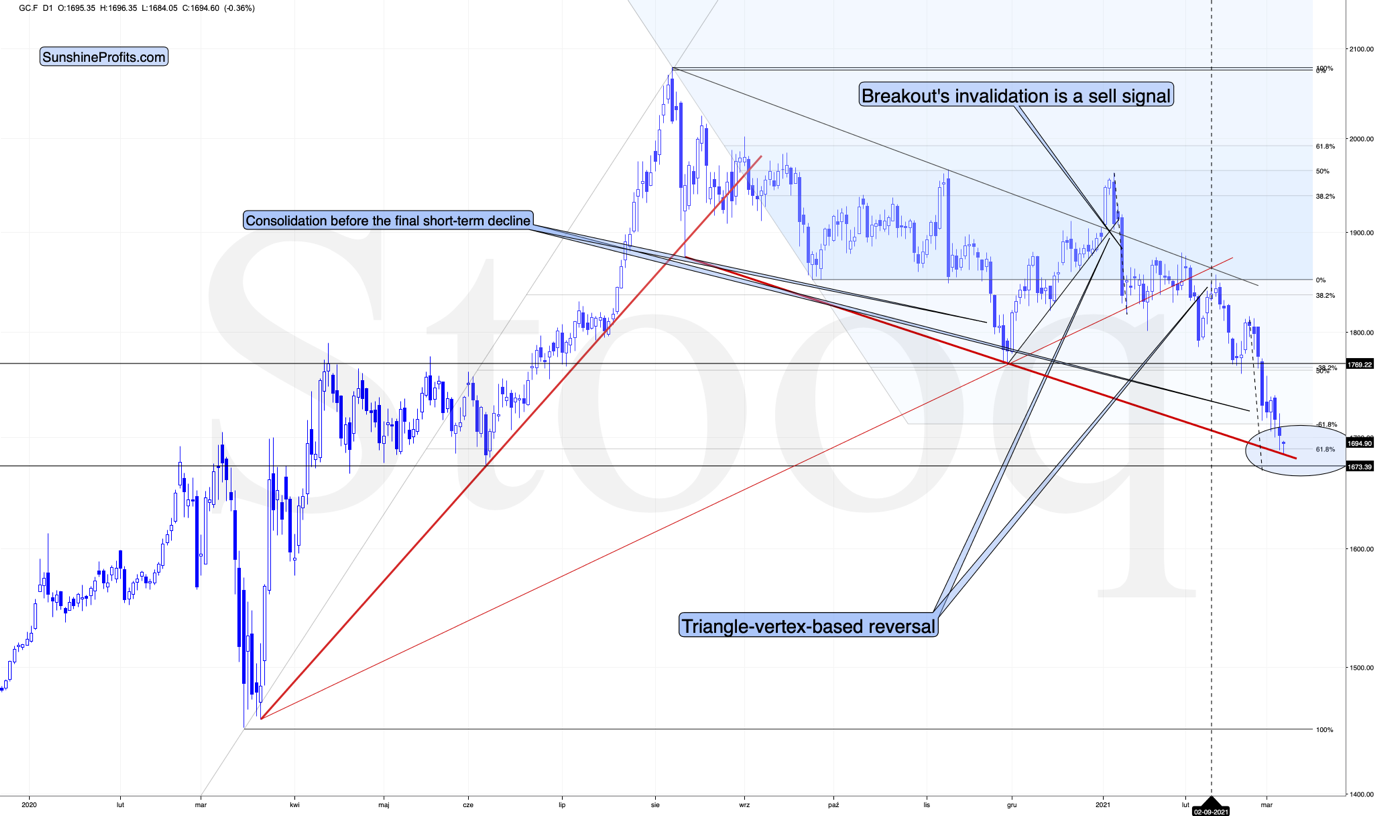
Figure 1 – COMEX Gold Futures (GC.F)
Gold just reached its 61.8% Fibonacci retracement level (based on the entire 2020 rally), and it just bounced off the declining red support line based on the August and November 2020 bottoms.
Gold didn’t reach the previous 2020 lows just yet, but it moved very close to them and the two strong above-mentioned support levels could be enough to trigger a corrective upswing. After all, no market can move up or down in a straight line without periodic corrections.
I previously wrote that when gold moves $1,693 we’ll be closing any remaining short positions, and when gold moves to $1,692, we’ll automatically open long positions in the miners. Since gold moved below $1,690, that’s exactly what happened.
Yesterday (Mar. 4), gold futures were trading below $1,692 for about 10 minutes, so if you acted as I had outlined it in the Gold & Silver Trading Alerts, you made your purchases then. The GDX ETF was trading approximately between $30.80 and $31 (NUGT was approximately between $49.30 and $50) at that time – this seems to have been the exact daily bottom.
One of the bullish confirmations came from the silver market.
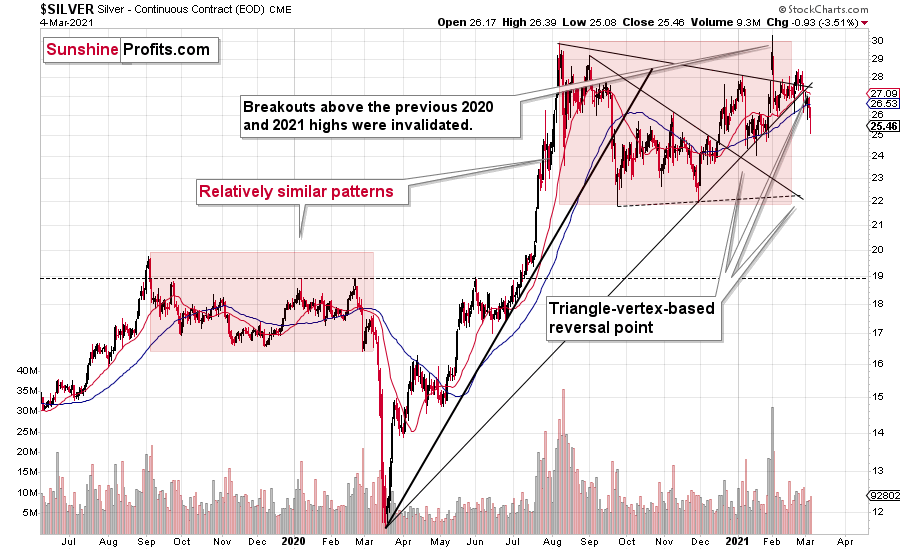
Figure 2 – COMEX Silver Futures
I previously wrote that silver is likely to catch up with the decline at its later stage, while miners are likely to lead the way.
While gold miners showed strength yesterday, silver plunged over 4% before correcting part of the move. Yesterday’s relative action showed that this was most likely the final part of a short-term decline in the precious metals sector, and that we should now expect a corrective rebound, before the medium-term decline resumes. If not, it seems that the short-term bottom is at hand and while silver might still decline somewhat in the very short term, any declines are not likely to be significant in case of the mining stocks. At least not until they correct the recent decline by rallying back up.
Speaking of mining stocks, let’s take a look at the GDX ETF chart.
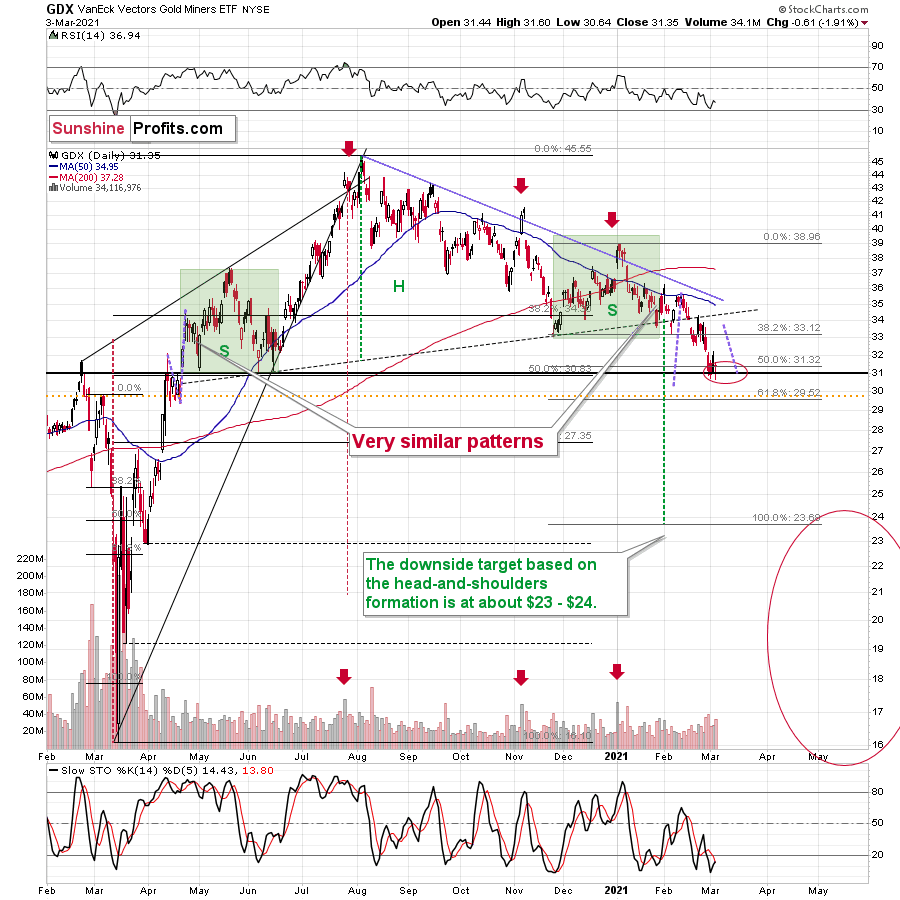
Figure 3 - VanEck Vectors Gold Miners ETF (GDX)
Mining stocks showed strength yesterday. Even though gold moved visibly to new yearly lows, the GDX didn’t move to new intraday lows. The GDXJ did move to new intraday lows, but the decline was relatively small compared to what happened in gold and to what happened on the general stock market. The latter declined substantially yesterday and the GDXJ is more correlated with it than GDX – hence GDXJ’s underperformance was normal. Still, compared to both gold’s decline and stocks’ decline, the GDXJ and GDX declined very little.
The price level at which miners showed strength matters greatly too. Miners stopped their decline practically right in my target area, which I based on the 50% Fibonacci retracement and the 2020 highs and lows. Moreover, the proximity of the $31 level corresponds to the 2019 high and the 2016 high. Since so many support levels coincide at the same price (approximately), the latter is likely to be a very strong support.
Moreover, the RSI was just close to 30, which corresponded to short-term buying opportunities quite a few times in the past.
How high are miners likely to rally from here before turning south once again? The nearest strong resistance is provided by the neck level of the previously broken head and shoulders pattern, which is slightly above $34.
Also, let’s keep in mind the mirror similarity in case of the price action that preceded the H&S pattern and the one that followed it. To be precise, we know that the second half of the pattern was similar to its first half (including the shape of pattern’s shoulders), but it’s not yet very clear if the follow-up action after the pattern is going to be similar to the preceding price action. It seems quite likely, though. If this is indeed the case, then the price moves that I marked using green and purple lines are likely to be at least somewhat similar.
This means that just as the late-April 2020 rally was preceded by a counter-trend decline, the recent decline would likely be followed by a counter-trend rally. Based on the size of the April counter-trend move, it seems that we could indeed see a counter-trend rally to about $34 this time.
There’s also an additional clue that might help you time the next short-term top, and it’s the simple observation that it was relatively safe to exit one’s long positions five trading days after the bottom.
That rule marked the exact bottom in November 2020, but it was also quite useful in early February 2021. In early December 2020, it would take one out of the market only after the very first part of the upswing, but still, let’s keep in mind that it was the “easy” part of the rally. The same with the October 2020 rally. And now, since miners are after a confirmed breakdown below the broad head and shoulders pattern, it’s particularly important not to miss the moment to get back on the short side of the market, as the next move lower is likely to be substantial. Therefore, aiming to catch the “easy” part of the corrective rally seems appropriate.
So, if the bottom was formed yesterday, then we can expect to take profits from the current long position off the table close to the end of next week.
Finally, let’s take a look at the USD Index.
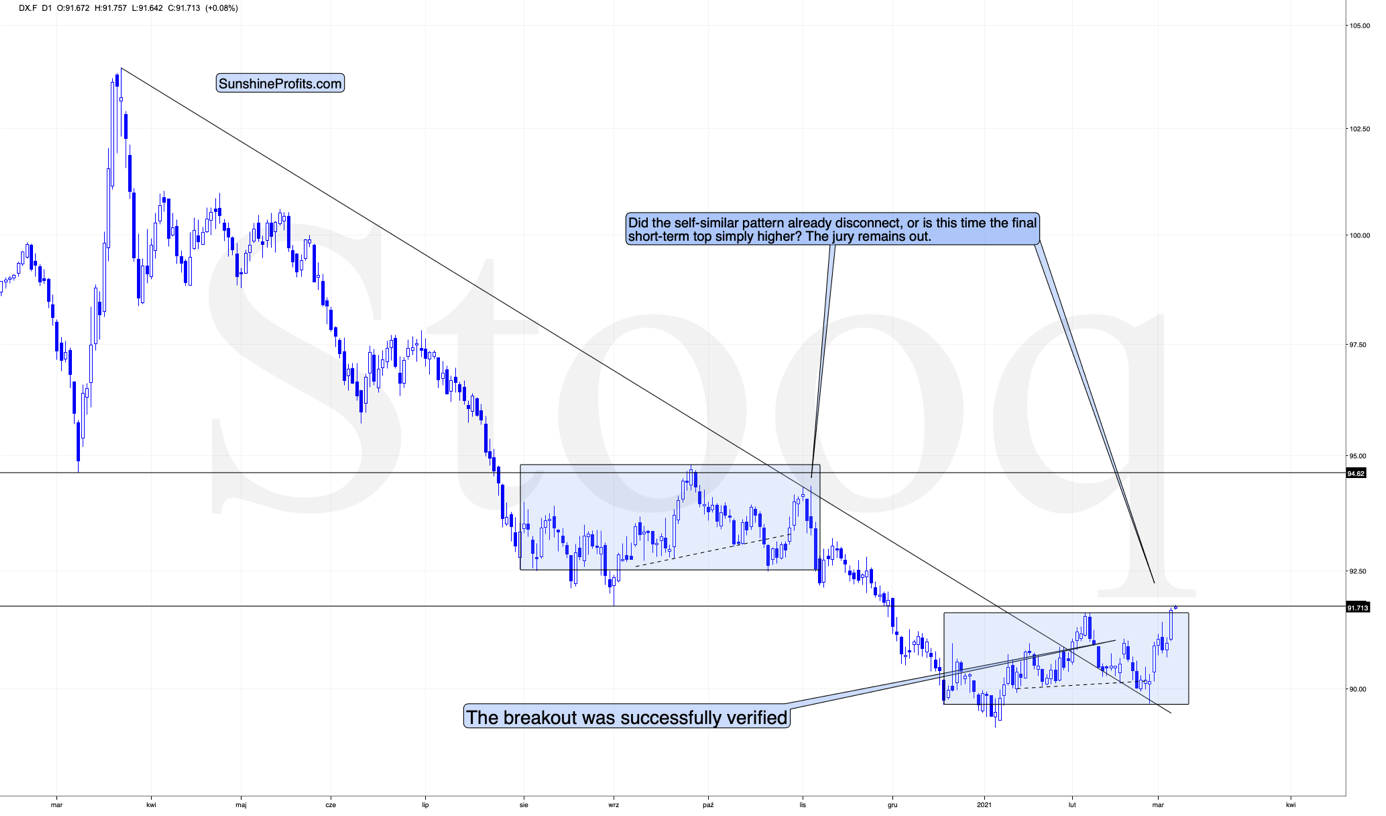
Figure 4 – USD Index
While the medium-term breakout continues to be the most important technical development visible on the above chart (with important bullish implications for the following months), there is one factor that could make the USD Index decline on a temporary basis.
This factor is the similarity to the mid-2020 price pattern. I previously commented on the head and shoulders pattern that had formed (necklines are marked with dashed lines), but that I didn’t trust. Indeed, this formation was invalidated, but a bigger pattern, of which this formation was part, wasn’t invalidated.
The patterns start with a broad bottom and an initial rally. Then it turns out that the initial rally is the head of a head-and-shoulders pattern that is then completed and invalidated. This is followed by a sharp rally, and then a reversal with a sizable daily decline.
So far, the situations are similar.
Last year, this pattern was followed by a decline to new lows. Now, based on the breakout above the rising medium-term support line, such a bearish outcome doesn’t seem likely, but we might see the pattern continue for several more days, before they disconnect. After all, this time, the USD Index is likely to really rally – similarly to how it soared in 2018 – and not move to new lows.
What happens before the patterns disconnect? The USD Index could decline temporarily.
Back in November 2020, the second top was below the initial one, and we just saw the USD Index move to new yearly high. Did the self-similar pattern break yet? In a way yes, but it doesn’t mean that the bearish implications are completely gone.
In mid-2020, the USD Index topped after moving to the previous important intraday low – I marked it with a horizontal line on the above chart.
Right now, the analogous resistance is provided by the September 2020 bottom and at the moment of writing these words, the USD Index moved right to this level.
Consequently, it could be the case that we see a decline partially based on the above-mentioned resistance and partially based on the remaining self-similar pattern. The latter would be likely to lose its meaning over the next several days and would be decisively broken once the USD Index rallies later in March. The above would create a perfect opportunity for the precious metals sector to correct the recent decline – and for miners (GDX ETF) to rally to $34 or so.
Please note that if gold rallies here – and it’s likely to – then this will be the “perfect” time for the gold and stock market permabulls to “claim victory” and state that the decline is over and that they were right about the rally all along. Please be careful when reading such analyses in the following days, especially if they come from people that have always been bullish. If someone is always bullish, the odds are that they won’t tell you when the next top is going to be (after all, this would imply that they stop being bullish for a while). Just because anyone can publish an article online, doesn’t mean that they should, or that others should follow their analyses. The internet is now replete people who claim to have expertise in the markets, and we all saw what happened to the profits of those who bought GameStop at $300. It’s the same thing that happened to the profits of those who were told since the beginning of this year that gold is going to rally – they turned into losses. What we see as well are internet echo chambers, where you are more likely to only read articles that express what you already agree with, instead of being exposed to differing viewpoints that shed light on other critical factors.
Gold is likely to rally from here, but it’s highly unlikely that this was the final bottom, and that gold can now soar to new highs. No. The rally in the USD Index has only begun and while it could pull back, it’s likely to soar once again, similarly to how it rallied in 2018. And gold is likely to respond with another substantial wave lower. This doesn’t mean we’re permabears either or that we want to see gold fail. On the contrary, gold has a bright future ahead, but not before it goes through a medium-term decline after this corrective rally is over.
Having said that, let’s take a look at the markets from the more fundamental point of view.
Panic at the Disco
As a game of chicken between financial markets and Jerome Powell, Chairman of the U.S. Federal Reserve (FED), plays out in real time, if the latter doesn’t inject more liquidity, investors could be in for a prolonged detox.
Delivering an encore, the U.S. 5-Year Treasury yield jumped by another 5.48% on Mar. 4. Along for the ride, the U.S. 7-Year and 10-Year Treasury yields also ripped higher.
Please see below:
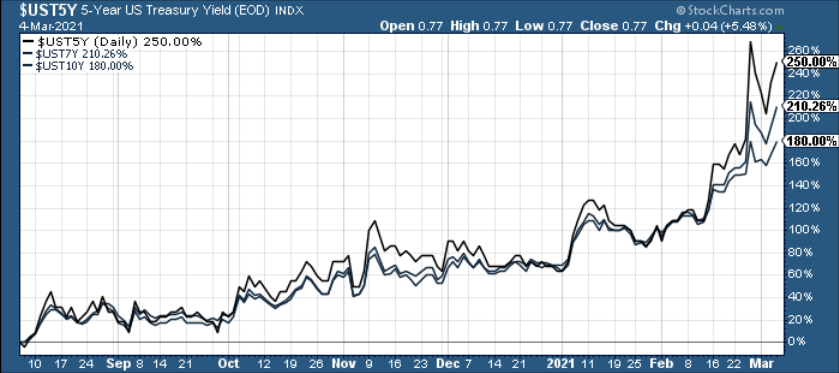
Figure 5
Setting the table for Thursday’s (Mar. 4) main course, overnight temperatures in the repo market fell below freezing. With liquidity nowhere to be found, the U.S. 10-Year Treasury’s fail charge – the penalty incurred when a seller fails to deliver the security – hit a record-low of – 4%. For context, a repo (repurchase agreement) occurs when one financial institution sells a security to another financial institution – usually on an overnight basis – and then ‘repurchases’ the security at a small premium the very next day.
Please see below:
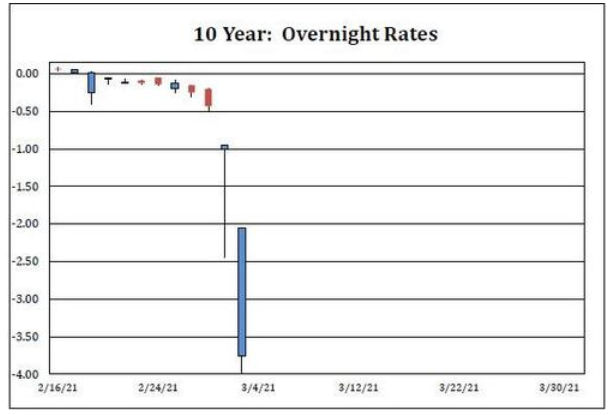
Figure 6 - Source: ZeroHedge
To explain, the fail charge is equivalent to the cost of borrowing for a stock short sale. To compensate the lender for providing the service, the borrower pays the lender a fee. However, with the fail charge normally ranging from 0% to – 3% (with – 3% considered extremely rare), – 4% is unprecedented.
But what caused the turbulence?
Well, it’s because short interest in the U.S. 10-Year Treasury has exploded.
Remember, bond prices move inversely of yields. Thus, investors fearing rising interest rates short U.S. Treasuries to capitalize on the momentum. However, because borrowing demand drastically outweighed supply, short sellers were willing to pay more than ever to obtain their positions. As further evidence, the 10-Year Treasury fail charge hit another new low of – 4.35% on Thursday (Mar. 4) afternoon.
Amid the rout in government bonds, corporate bonds are also signaling potential stress. Because corporate bonds are riskier than government bonds, lenders charge a ‘spread’ (additional rates of interest) to compensate for the excess risk. In a nutshell: the narrower (lower) the spread, the easier and cheaper it is for corporations to borrower money.
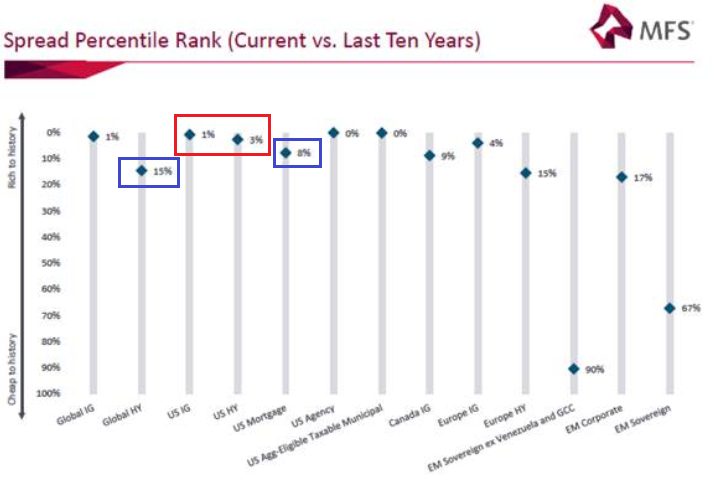
Figure 7
However, if you analyze the visual above, you can see that corporate spreads have begun to widen (increase). To explain, the blue diamonds above depict the percentile rank of current corporate spreads relative to their 10-year history. And despite U.S. investment grade (IG) and U.S. high yield (HY) spreads still extremely low (the red box above), global high yield spreads have risen to the 15th percentile, while U.S. mortgage spreads have risen to the 8th percentile (the blue boxes above).
In addition, the bond-market’s recent sell-off has coincided with an important economic plateau. Heralded as the bellwether of the forthcoming renaissance, China’s economy recovered more quickly from the coronavirus crisis. However, the latest data from J.P. Morgan shows that momentum has begun to flat-line.
Please see below:
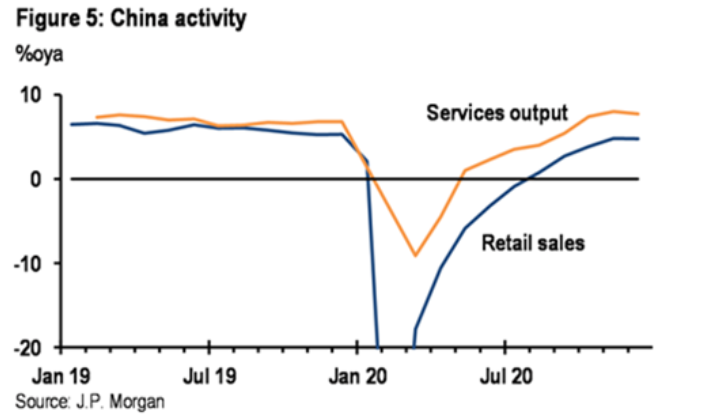
Figure 8
And while ignoring fundamentals was fashionable for much of 2020, data from the U.S. Bureau of Labor Statistics (compiled by Bloomberg) shows the 15 U.S. states ended the year with their lowest employment-to-population (E/P) ratios ever.
Please see below:
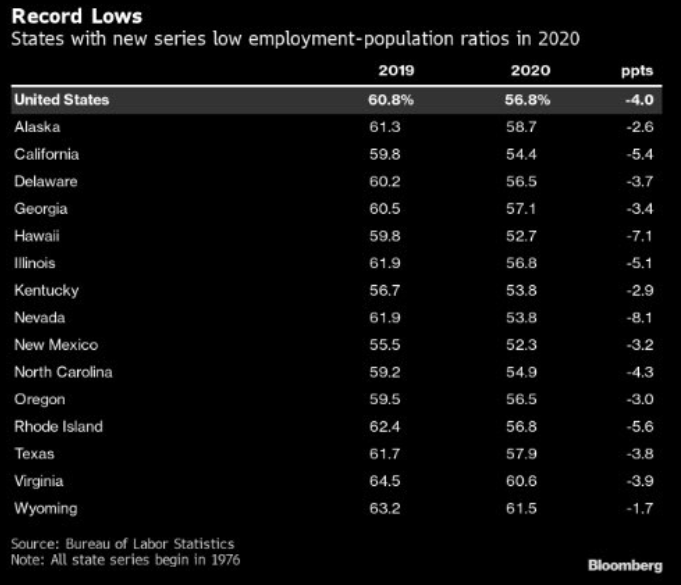
Figure 9
To explain, record-low E/P ratios means that fewer individuals than ever are employed in these states relative to their overall populations.
As for the market’s quantifier of chaos, the Cboe Volatility Index (VIX) has spiked by 18.55% over the last two days. And on March 2, I warned that a VIX uprising could breathe new life into the USD Index.
I wrote:
While the USD Index has slept through the U.S. 10-Year Treasury yield’s recent surge, it has a tendency to track the VIX’s movement.
Please see below:
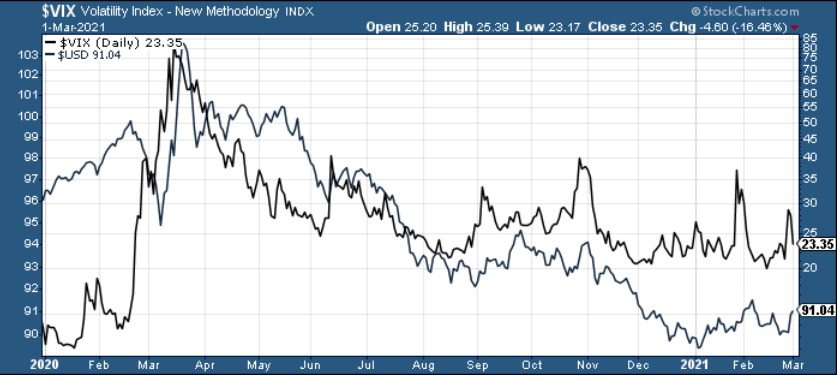
Figure 10
What’s more, VIX futures are already bracing for another bout of volatility. With the current contract trading at 23.31 on Mar. 1, the Jul. 21 expiration is pricing in a near 22% surge in the VIX.
And because “the journey of a thousand miles begins with one step” (Lao Tzu), the USD Index’s 0.94% rally has the greenback trading at its highest level since Nov. 27.
Please see below:
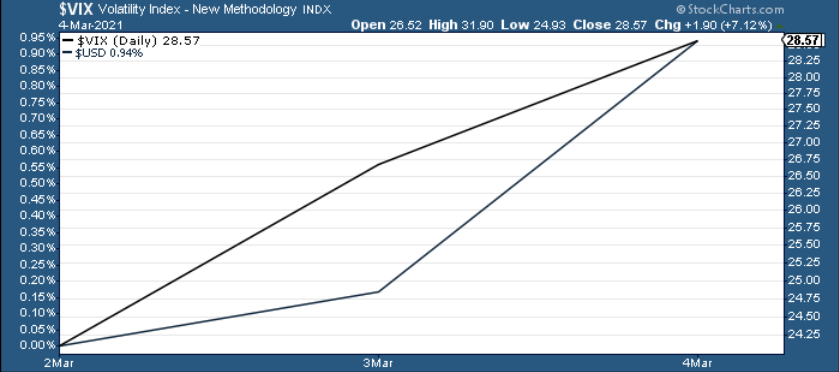
Figure 11
Also worth monitoring, the EUR/USD closed below 1.20 on Mar. 4 – its lowest level since Feb. 4. For context, the EUR/USD accounts for nearly 58% of the movement in the USD Index. As a result, its performance is extremely important.
And while we’re only in the first inning of a nine-inning ballgame, if the currency pair breaks below ~1.16, a tsunami of negativity could usher the USD Index well above 94.5.
To explain, I wrote previously:
Despite being a fair distance from the ~1.08 level, the euro’s weakness relative to sterling is a sign that the Eurozone calamity is finally starting to weigh on its currency.
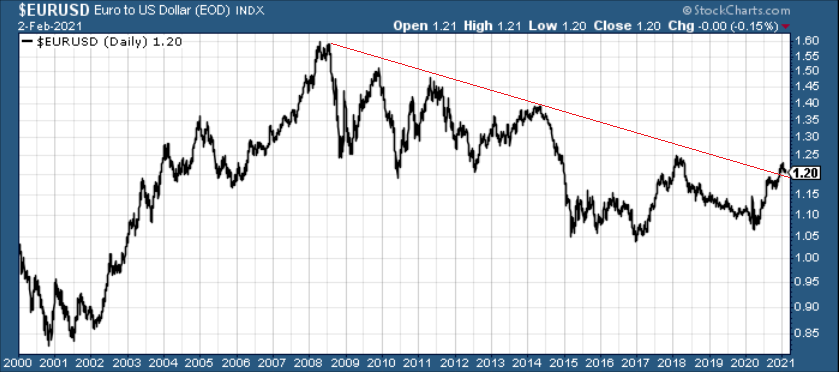
Figure 12
More importantly though, barely breaking out of a roughly 12-year downtrend, the EUR/USD has yet to invalidate its declining long-term resistance line. As a result, a break below ~1.16 puts ~1.08 well within the range of the EUR/USD’s 2015/2016 lows.
So how do we make sense of all of the above?
Well, for starters, over a 250-day period (roughly one year), gold, silver and the miners had negative correlations of – 0.72, – 0.93 and – 0.55 respectively, relative to the U.S. dollar. As a result, the PMs are extremely allergic to USD Index rallies.
Please see below:
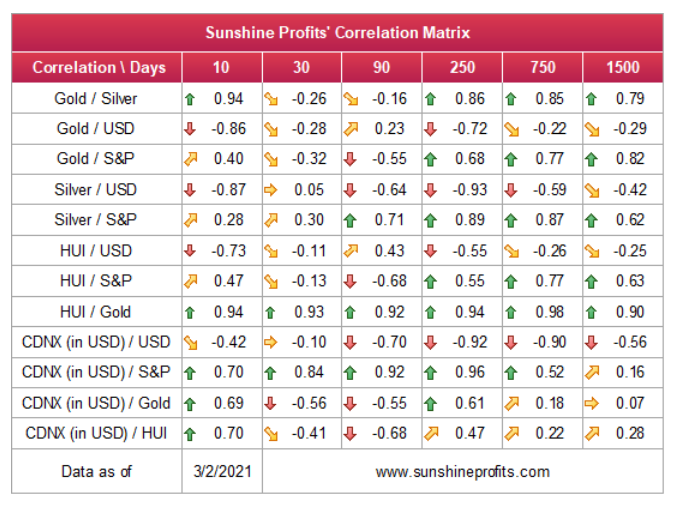
Figure 13
In addition, equity volatility also weighs heavily on the PMs. With the NASDAQ 100 falling by 1.73% on Mar. 4, gold and silver (though the miners were relatively unchanged) suffered mightily. Moreover, if you exclude silver’s short squeeze on Jan. 29 and the NASDAQ 100’s relatively ‘quiet’ 2.63% drawdown on Feb. 22, NASDAQ 100 drawdowns of more than 2% significantly impact the PMs.
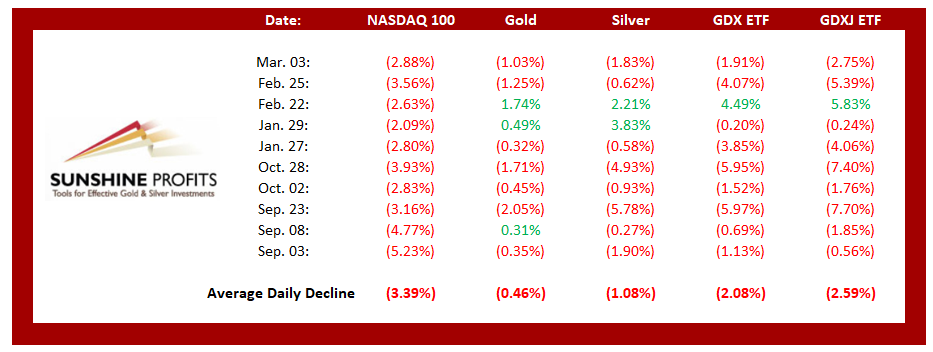
Figure 14
Keep in mind though: the above mosaic presents a profoundly bearish case for the PMs over the medium-term. Conversely, given gold’s bounce off of my initial downside target (the $1,670 to $1,700 range), a countertrend rally is likely in the works. Case in point: the GDX ETFs ability to ignore yesterday’s chaos signals that a bottom has likely formed. As a result, a corrective upswing to $33/$34 is likely to unfold over the coming days/weeks (perhaps over the next 5 trading days or so).
In conclusion, the PMs continue to stare into the medium-term abyss. However, a guiding light should make their journey more joyful over the short-term. With support forming and oversold conditions likely to give way to a short-term rally, positioning for a corrective upswing offers a solid risk-reward proposition. However, once the PMs conclude their short-term reprieve, a continuation of their medium-term downtrend is likely to culminate with new lows.
Overview of the Upcoming Part of the Decline
- It seems to me that the initial bottom has either just formed or is about to form with gold falling to roughly $1,670 - $1,680, likely this week.
- I expect the rebound to take place during the next 1-3 weeks.
- After the rebound (perhaps to $33 - $34 in the GDX), I plan to get back in with the short position in the mining stocks.
- Then, after miners slide once again in a meaningful and volatile way, but silver doesn’t (and it just declines moderately), I plan to switch from short positions in miners to short positions in silver (this could take another 1-4 weeks to materialize). I plan to exit those short positions when gold shows substantial strength relative to the USD Index, while the latter is still rallying. This might take place with gold close to $1,450 - $1,500 and the entire decline (from above $1,700 to about $1,475) would be likely to take place within 1-10 weeks and I would expect silver to fall hardest in the final part of the move. This moment (when gold performs very strongly against the rallying USD and miners are strong relative to gold – after gold has already declined substantially) is likely to be the best entry point for long-term investments in my view. This might happen with gold close to $1,475, but it’s too early to say with certainty at this time.
- Consequently, the entire decline could take between 3 and 17 weeks.
- If gold declines even below $1,500 (say, to ~$1350 or so), then it could take another 10 weeks or so for it to bottom, but this is not what I view as a very likely outcome.
- As a confirmation for the above, I will use the (upcoming or perhaps we have already seen it?) top in the general stock market as the starting point for the three-month countdown. The reason is that after the 1929 top, gold miners declined for about three months after the general stock market started to slide. We also saw some confirmations of this theory based on the analogy to 2008. All in all, the precious metals sector would be likely to bottom about three months after the general stock market tops . If the mid-February 2020 top was the final medium-term top, then it seems that we might expect the precious metals sector to bottom in mid-May or close to May’s end.
- The above is based on the information available today and it might change in the following days/weeks.
Summary
To summarize, the PMs’ medium-term decline is well underway, as miners broke below the neck level of their almost-yearly head-and-shoulders formation and then continued the decline. However, it now seems that we’re going to see a counter-trend bounce with the GDX ETF moving to about $34 or so, which is why I wrote about opening long positions in the mining stocks.
In addition, because we’re likely entering the “winter” part of the Kondratiev cycle (just like in 1929 and then the 1930s), the outlook for the precious metals’ sector remains particularly bearish during the very first part of the cycle, when cash is king.
The confirmed breakout in the USD Index is yet another confirmation of the bearish outlook for the precious metals market.
After the sell-off (that takes gold to about $1,450 - $1,500), we expect the precious metals to rally significantly. The final part of the decline might take as little as 1-5 weeks, so it's important to stay alert to any changes.
Most importantly, please stay healthy and safe. We made a lot of money last March and it seems that we’re about to make much more on this March decline, but you have to be healthy to enjoy the results.
As always, we'll keep you - our subscribers - informed.
To summarize:
Trading capital (supplementary part of the portfolio; our opinion): Full speculative long positions (100% of the full position) in mining stocks are justified from the risk to reward point of view with the following binding exit profit-take price levels:
Mining stocks (price levels for the GDX ETF): binding profit-take exit price: $33.92; stop-loss: none (the volatility is too big to justify a stop-loss order in case of this particular trade)
Alternatively, if one seeks leverage, we’re providing the binding profit-take levels for the NUGT (2x leveraged) and GDXU (3x leveraged – which is not suggested for most traders/investors due to the significant leverage). The binding profit-take level for the NUGT: $60.92; stop-loss for the NUGT: none (the volatility is too big to justify a SL order in case of this particular trade); binding profit-take level for the GDXU: $18.92; stop-loss for the GDXU: none (the volatility is too big to justify a SL order in case of this particular trade).
For-your-information targets (our opinion; we continue to think that mining stocks are the preferred way of taking advantage of the upcoming price move, but if for whatever reason one wants / has to use silver or gold for this trade, we are providing the details anyway.):
Silver futures upside profit-take exit price: unclear at this time - initially, it might be a good idea to exit, when gold moves to $1,758.
Gold futures upside profit-take exit price: $1,758.
Long-term capital (core part of the portfolio; our opinion): No positions (in other words: cash
Insurance capital (core part of the portfolio; our opinion): Full position
Whether you already subscribed or not, we encourage you to find out how to make the most of our alerts and read our replies to the most common alert-and-gold-trading-related-questions.
Please note that we describe the situation for the day that the alert is posted in the trading section. In other words, if we are writing about a speculative position, it means that it is up-to-date on the day it was posted. We are also featuring the initial target prices to decide whether keeping a position on a given day is in tune with your approach (some moves are too small for medium-term traders, and some might appear too big for day-traders).
Additionally, you might want to read why our stop-loss orders are usually relatively far from the current price.
Please note that a full position doesn't mean using all of the capital for a given trade. You will find details on our thoughts on gold portfolio structuring in the Key Insights section on our website.
As a reminder - "initial target price" means exactly that - an "initial" one. It's not a price level at which we suggest closing positions. If this becomes the case (like it did in the previous trade), we will refer to these levels as levels of exit orders (exactly as we've done previously). Stop-loss levels, however, are naturally not "initial", but something that, in our opinion, might be entered as an order.
Since it is impossible to synchronize target prices and stop-loss levels for all the ETFs and ETNs with the main markets that we provide these levels for (gold, silver and mining stocks - the GDX ETF), the stop-loss levels and target prices for other ETNs and ETF (among other: UGL, GLL, AGQ, ZSL, NUGT, DUST, JNUG, JDST) are provided as supplementary, and not as "final". This means that if a stop-loss or a target level is reached for any of the "additional instruments" (GLL for instance), but not for the "main instrument" (gold in this case), we will view positions in both gold and GLL as still open and the stop-loss for GLL would have to be moved lower. On the other hand, if gold moves to a stop-loss level but GLL doesn't, then we will view both positions (in gold and GLL) as closed. In other words, since it's not possible to be 100% certain that each related instrument moves to a given level when the underlying instrument does, we can't provide levels that would be binding. The levels that we do provide are our best estimate of the levels that will correspond to the levels in the underlying assets, but it will be the underlying assets that one will need to focus on regarding the signs pointing to closing a given position or keeping it open. We might adjust the levels in the "additional instruments" without adjusting the levels in the "main instruments", which will simply mean that we have improved our estimation of these levels, not that we changed our outlook on the markets. We are already working on a tool that would update these levels daily for the most popular ETFs, ETNs and individual mining stocks.
Our preferred ways to invest in and to trade gold along with the reasoning can be found in the how to buy gold section. Furthermore, our preferred ETFs and ETNs can be found in our Gold & Silver ETF Ranking.
As a reminder, Gold & Silver Trading Alerts are posted before or on each trading day (we usually post them before the opening bell, but we don't promise doing that each day). If there's anything urgent, we will send you an additional small alert before posting the main one.
Thank you.
Przemyslaw Radomski, CFA
Founder, Editor-in-chief

